. 2017 Feb 20;30(2):657-668.
doi: 10.1021/acs.chemrestox.6b00394. Epub 2016 Dec 15.

Metabolism of the Tobacco Carcinogen 2-Amino-9H-pyrido[2,3-b]indole (AαC) in Primary Human Hepatocytes

Affiliations

Metabolism of the Tobacco Carcinogen 2-Amino-9H-pyrido[2,3-b]indole (AαC) in Primary Human Hepatocytes

Medjda Bellamri et al. Chem Res Toxicol. .

Abstract

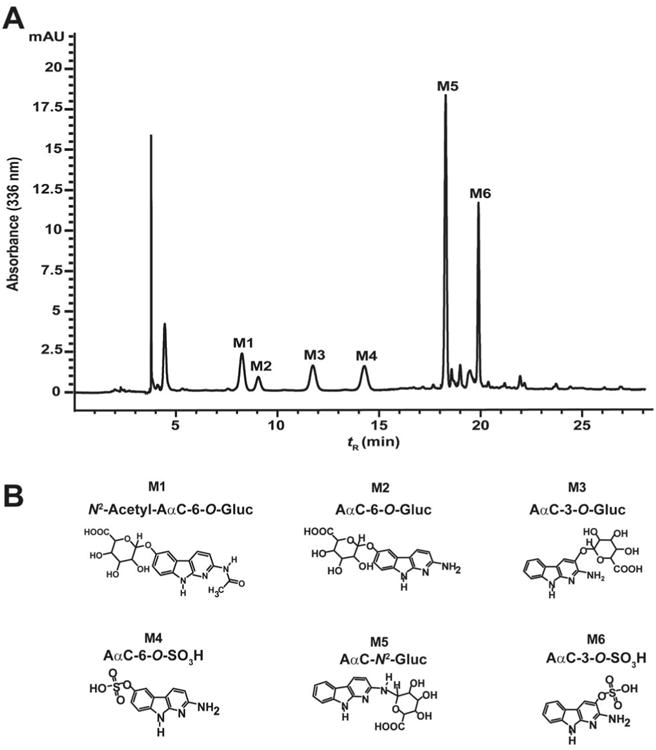
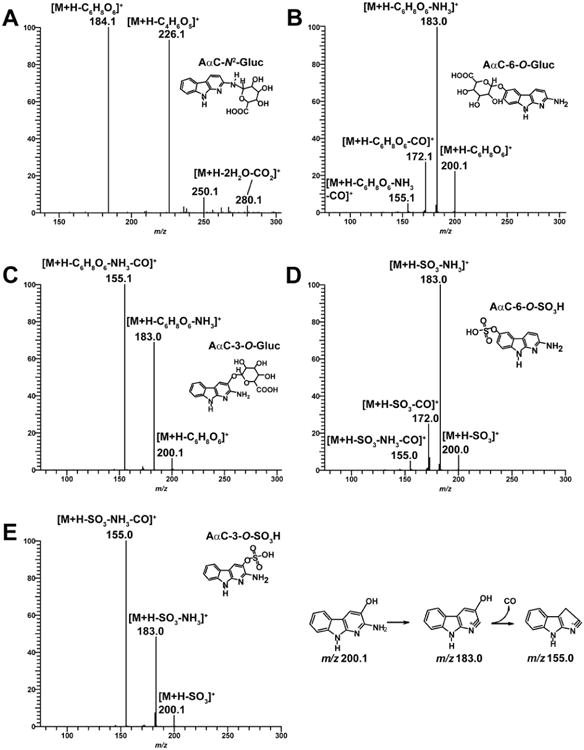
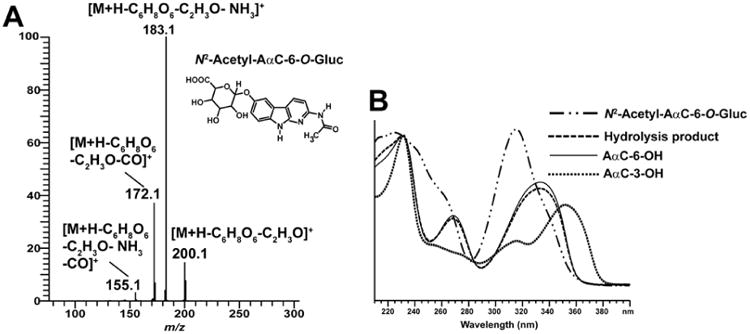
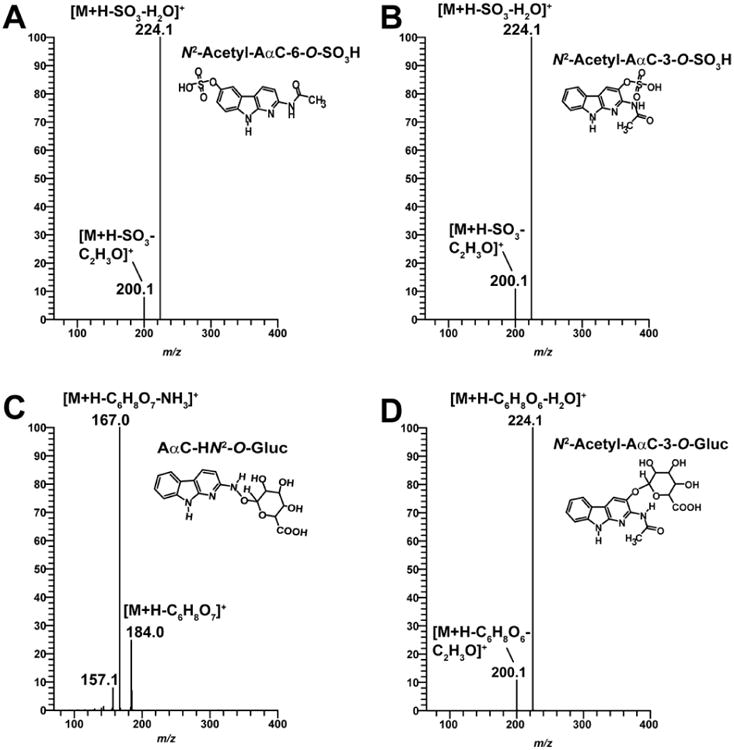
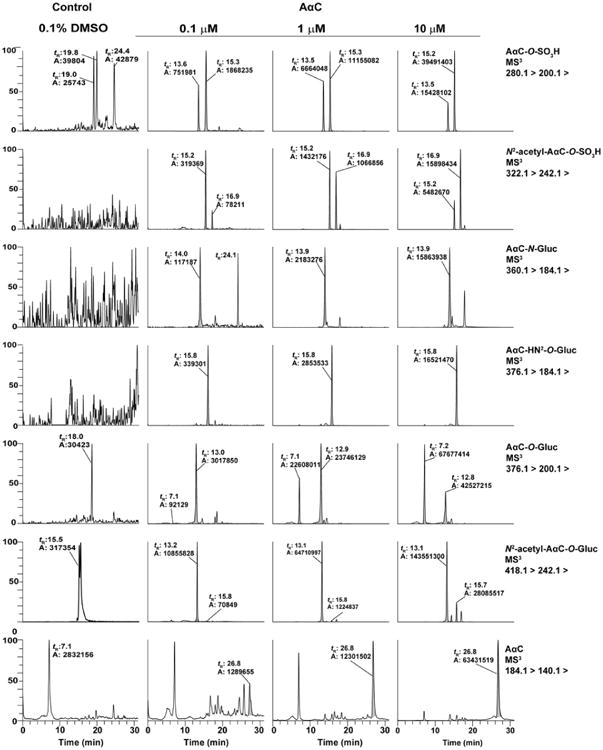
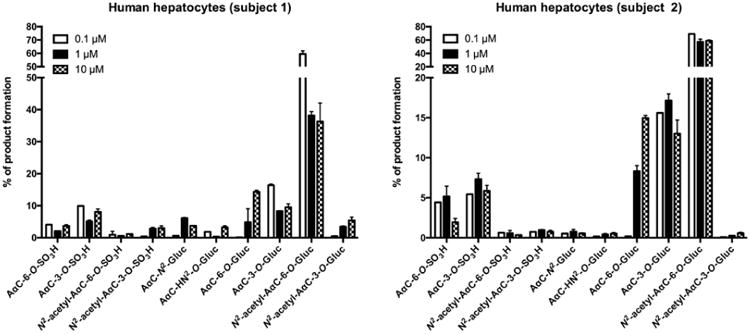
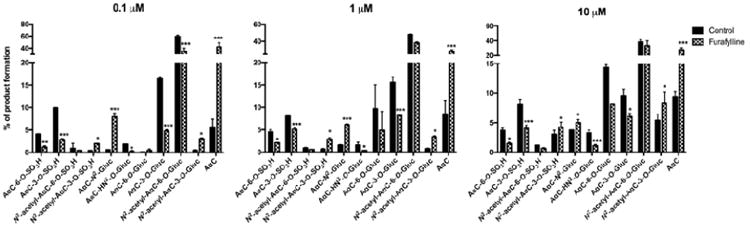
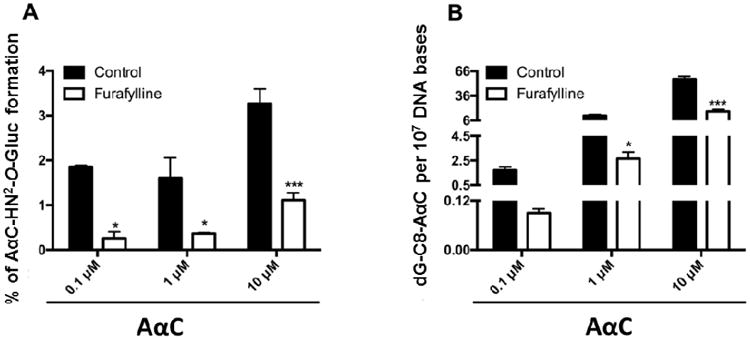
2-Amino-9H-pyrido[2,3-b]indole (AαC) is the most abundant carcinogenic heterocyclic aromatic amine (HAA) formed in mainstream tobacco smoke. AαC is a liver carcinogen in rodents, but its carcinogenic potential in humans is not known. To obtain a better understanding of the genotoxicity of AαC in humans, we have investigated its metabolism and its ability to form DNA adducts in human hepatocytes. Primary human hepatocytes were treated with AαC at doses ranging from 0.1-50 μM, and the metabolites were characterized by ultra-performance LC/ion trap multistage mass spectrometry (UPLC/MSn). Six major metabolites were identified: a ring-oxidized doubly conjugated metabolite, N2-acetyl-2-amino-9H-pyrido[2,3-b]indole-6-yl-oxo-(β-d-glucuronic acid) (N2-acetyl-AαC-6-O-Gluc); two ring-oxidized glucuronide (Gluc) conjugates: 2-amino-9H-pyrido[2,3-b]indol-3-yl-oxo-(β-d-glucuronic acid) (AαC-3-O-Gluc) and 2-amino-9H-pyrido[2,3-b]indol-6-yl-oxo-(β-d-glucuronic acid) (AαC-6-O-Gluc); two sulfate conjugates, 2-amino-9H-pyrido[2,3-b]indol-3-yl sulfate (AαC-3-O-SO3H) and 2-amino-9H-pyrido[2,3-b]indol-6-yl sulfate (AαC-6-O-SO3H); and the Gluc conjugate, N2-(β-d-glucosidurony1)-2-amino-9H-pyrido[2,3-b]indole (AαC-N2-Gluc). In addition, four minor metabolites were identified: N2-acetyl-9H-pyrido[2,3-b]indol-3-yl sulfate (N2-acetyl-AαC-3-O-SO3H), N2-acetyl-9H-pyrido[2,3-b]indol-6-yl sulfate (N2-acetyl-AαC-6-O-SO3H), N2-acetyl-2-amino-9H-pyrido[2,3-b]indol-3-yl-oxo-(β-d-glucuronic acid) (N2-acetyl-AαC-3-O-Gluc), and O-(β-d-glucosidurony1)-2-hydroxyamino-9H-pyrido[2,3-b]indole (AαC-HN2-O-Gluc). The latter metabolite, AαC-HN2-O-Gluc is a reactive intermediate that binds to DNA to form the covalent adduct N-(2'-deoxyguanosin-8-yl)-2-amino-9H-pyrido[2,3-b]indole (dG-C8-AαC). Preincubation of hepatocytes with furafylline, a selective mechanism-based inhibitor of P450 1A2, resulted in a strong decrease in the formation of AαC-HN2-O-Gluc and a concomitant decrease in DNA adduct formation. Our findings describe the major pathways of metabolism of AαC in primary human hepatocytes and reveal the importance of N-acetylation and glucuronidation in metabolism of AαC. P450 1A2 is a major isoform involved in the bioactivation of AαC to form the reactive AαC-HN2-O-Gluc conjugate and AαC-DNA adducts.


Figures

Figure 1
Figure 1
(A) HPLC-UV profile and (B) proposed chemical structures of AαC metabolites formed in primary human hepatocytes incubated with 50 μM of AαC over 24 h.
Figure 2
Figure 2
(A) LC/MS2 product ion mass spectra of AαC-N2-Gluc (m/z 360.1 >) and LC/MS3 product ion mass spectra of (B) AαC-6-O-Gluc (m/z 376.1 > 200.1 >), (C) AαC-3-O-Gluc (m/z 376.1 > 200.1 >), (D) AαC-6-O-SO3H (m/z 280.1 > 200.1 >), (E) AαC-3-O-SO3H (m/z 280.1 > 200.1 >) in positive ionization mode. The proposed mechanism of formation of the prominent fragment ion of AαC-3-OH at m/z 155.0 is presented.
Figure 3
Figure 3
Identification and characterization of N2-Acetyl-AαC-6-O-Gluc. (A) LC/MS3 product ion mass spectra of N2-Acetyl-AαC-6-O-Gluc (m/z 418.1 > 242.1 >) formed in primary human hepatocytes. N2-Acetyl-AαC-6-O-Gluc was purified by HPLC and characterized by mass spectrometry. (B) UV spectra of AαC-6-OH, AαC-3-OH, N2-acetyl-AαC-O-Gluc and its hydrolysis product obtained after β-glucuronidase followed by acid treatment of N2-acetyl-AαC-O-Gluc as described in material and method.
Figure 4
Figure 4
LC/MS3 product ion mass spectra of N2-acetyl-AαC-6-O-SO3H (m/z 322.1 > 241.1 >) (A), N2-acetyl-AαC-3-O-SO3H (m/z 322.1 > 241.1 >) (B), AαC-HN2-O-Gluc (m/z 376.1 > 200.1 >) (C) and N2-acetyl-AαC-3-O-Gluc (m/z 418.1 > 242.1 >) (D).
Figure 5
Figure 5
Mass chromatograms of AαC metabolites formed during 24h in primary human hepatocytes incubated 0.1, 1 and 10 μM of AαC. The retention time (tR) are AαC-6-O-SO3H (13.5), AαC-3-O-SO3H (15.2), N2-acetyl-AαC-6-O-SO3H (15.2), N2-acetyl-AαC-3-O-SO3H (16.9), AαC-6-O-Gluc (7.2), AαC-3-O-Gluc (12.8), N2-acetyl-AαC-6-O-Gluc (13.1), N2-acetyl-AαC-3-O-Gluc (15.7) min.
Figure 6
Figure 6
Distribution of AαC metabolites formed as a function of dose in two human primary hepatocyte preparations after 24 h of incubation. Primary human hepatocytes were incubated with various concentrations of AαC (0.1, 1 and 10 μM) during 24 h and the relative ion abundance of each metabolites derived from AαC formed were determined by mass spectrometry based on total ion counts in positive ion mode.
Figure 7
Figure 7
Role of P450 1A2 in AαC metabolism in human hepatocytes. Cells were pre-treated with furafylline (5 μM) for 24h prior to treatment with AαC (0.1, 1 and 10 μM) during 24h. The relative abundance of each AαC derived metabolites was determined by mass spectrometry based on total ion counts in positive ion mode. (Student's t-test, * P<0.05; **P<0.01, ***P<0.005 versus control).
Figure 8
Figure 8
Correlation between DNA adducts levels derived from AαC and the relative abundance of AαC-HN2-O-Gluc formed in human hepatocytes. Relative abundance of AαC-HN2-O-Gluc (A) and dG-C8-AαC (B) formed in human hepatocytes. Cells were pre-treated with furafylline (5 μM) for 24h prior to incubation with 0.1, 1, 10 and 50 μM of AαC for 24h and the relative abundance of AαC-HN2-O-Gluc and dG-C8-AαC levels derived from AαC formed were estimated by mass spectrometry. (Student's t-test, * P<0.05; **P<0.01, ***P<0.005 versus control).

Similar articles

Cited by

References

    1. Giovannucci E. An updated review of the epidemiological evidence that cigarette smoking increases risk of colorectal cancer. Cancer Epidemiol Biomarkers Prev. 2001;10:725–731. - PubMed
    1. IARC Monographs on the Evaluation of Carcinogenic Risks to Humans. IARC. Tobacco smoke and involuntary smoking. 2004;83:1–1438. - PMC - PubMed
    1. IARC Monographs on the Evaluation of Carcinogenic Risks to Humans. Personal habits and indoor combustions. 2012;100:1–538. - PMC - PubMed
    1. Hoffmann D, Hoffmann I, El-Bayoumy K. The less harmful cigarette: a controversial issue. a tribute to Ernst L. Wynder. Chem Res Toxicol. 2001;14:767–790. - PubMed
    1. Sugimura T, Wakabayashi K, Nakagama H, Nagao M. Heterocyclic amines: Mutagens/carcinogens produced during cooking of meat and fish. Cancer Sci. 2004;95:290–299. - PMC - PubMed

Publication types

LinkOut - more resources