. 2016 Dec 15;12(12):e1006523.
doi: 10.1371/journal.pgen.1006523. eCollection 2016 Dec.

On the Spatial Organization of mRNA, Plasmids, and Ribosomes in a Bacterial Host Overexpressing Membrane Proteins

Affiliations

On the Spatial Organization of mRNA, Plasmids, and Ribosomes in a Bacterial Host Overexpressing Membrane Proteins

Lieke A van Gijtenbeek et al. PLoS Genet. .

Abstract

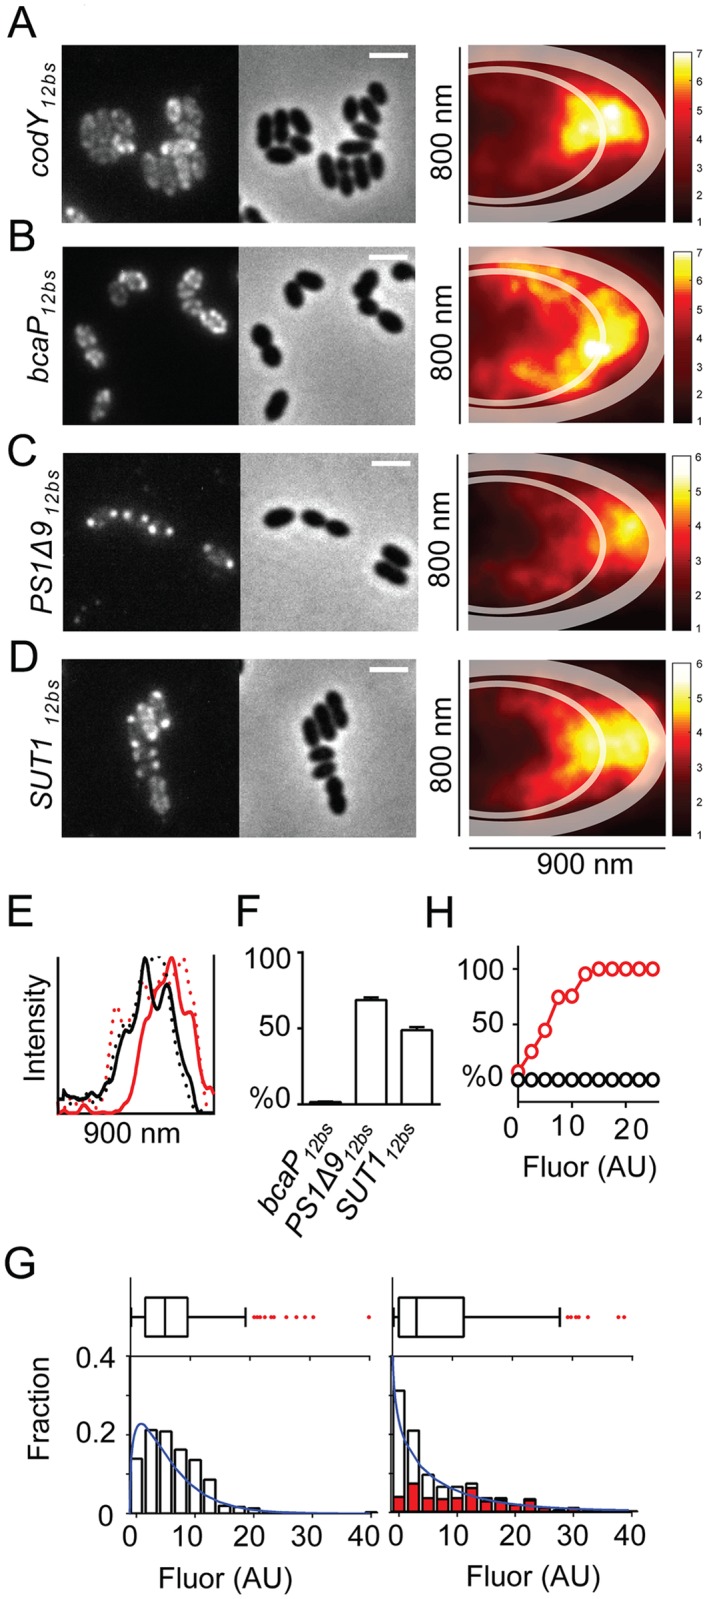
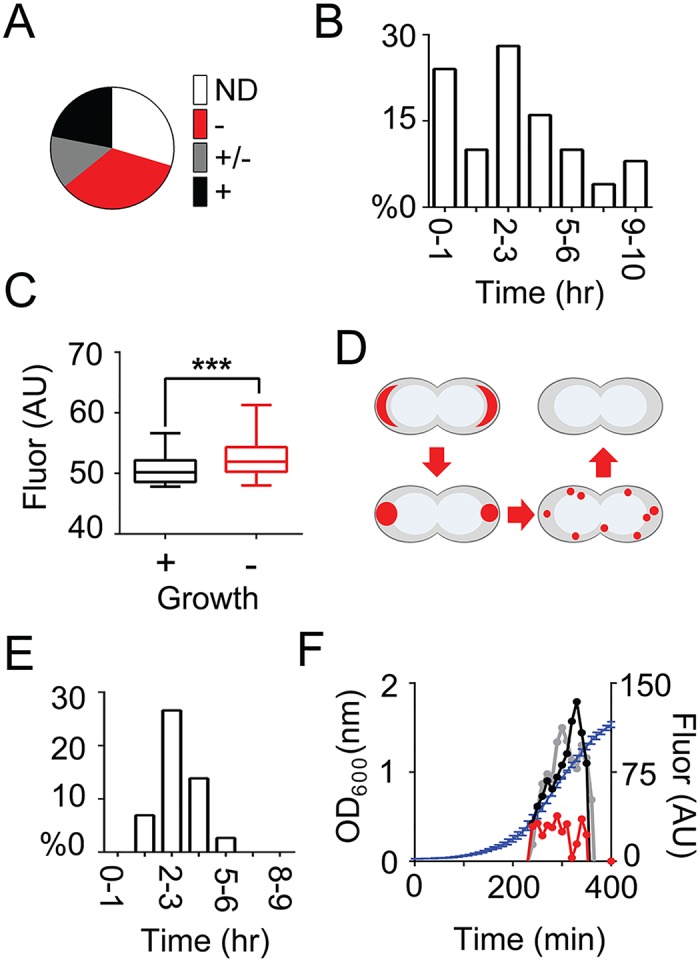
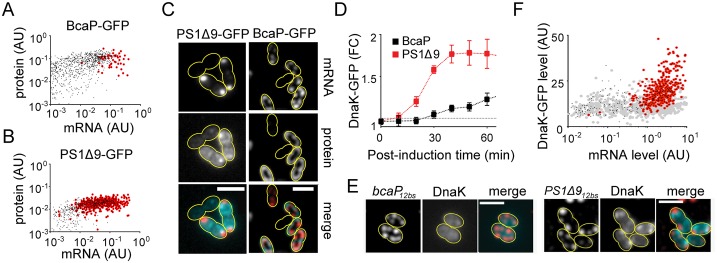
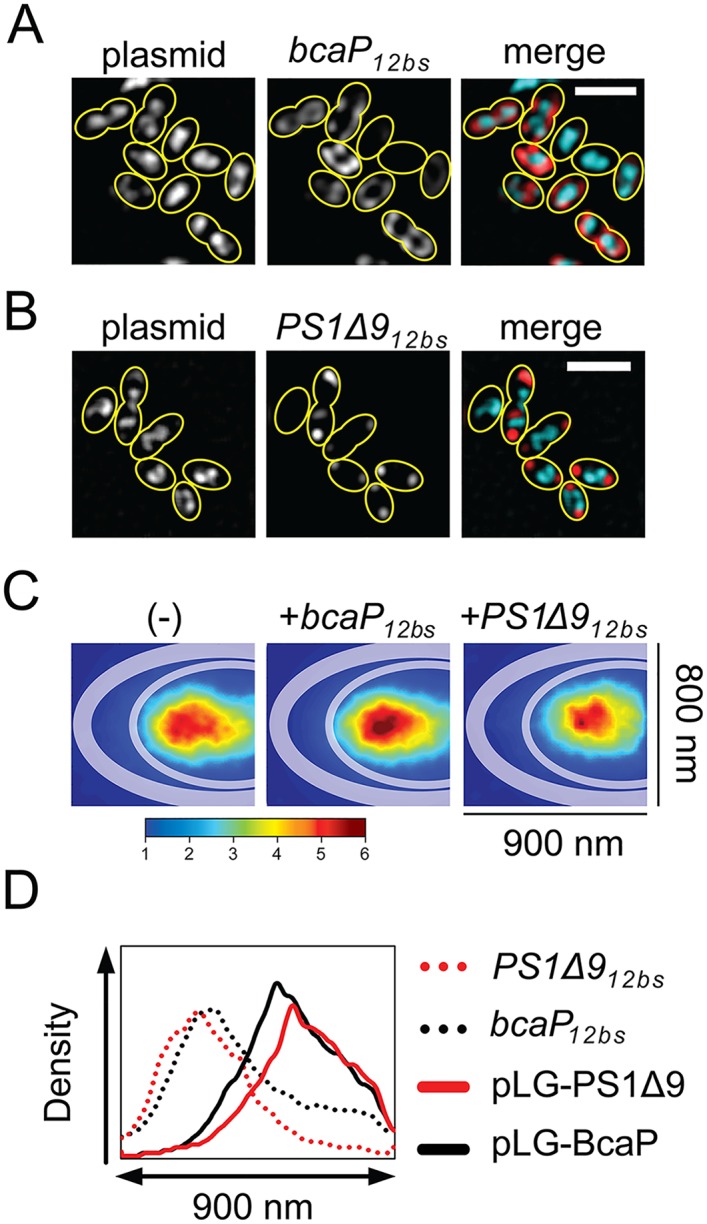
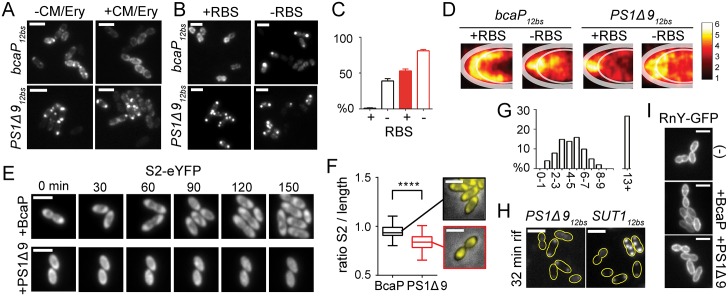
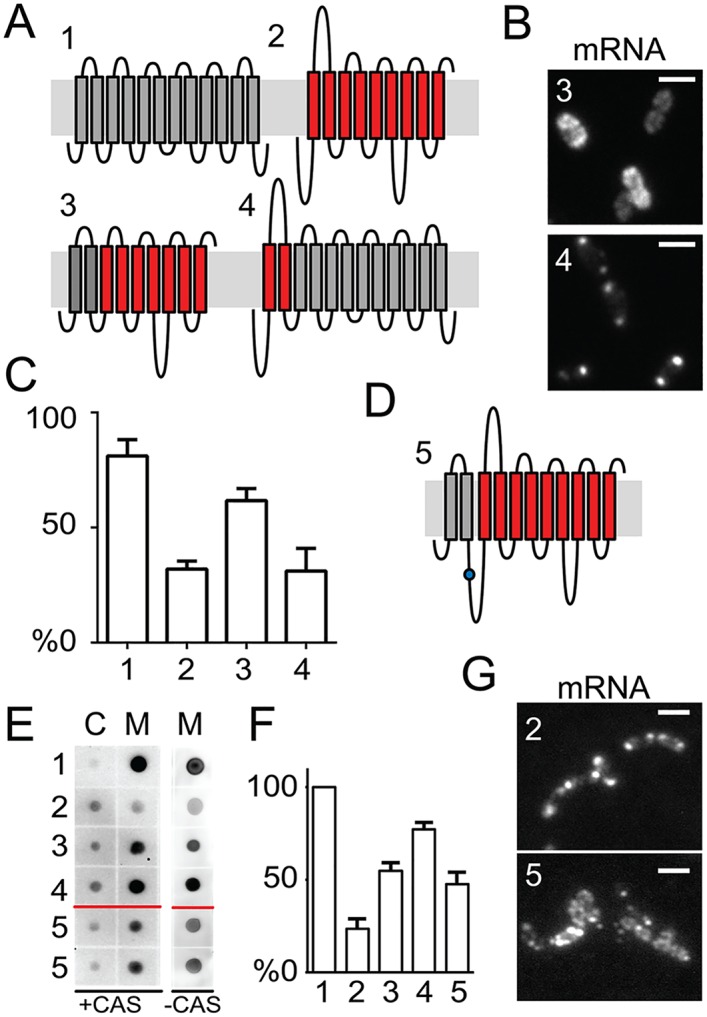
By using fluorescence imaging, we provide a time-resolved single-cell view on coupled defects in transcription, translation, and growth during expression of heterologous membrane proteins in Lactococcus lactis. Transcripts encoding poorly produced membrane proteins accumulate in mRNA-dense bodies at the cell poles, whereas transcripts of a well-expressed homologous membrane protein show membrane-proximal localization in a translation-dependent fashion. The presence of the aberrant polar mRNA foci correlates with cessation of cell division, which is restored once these bodies are cleared. In addition, activation of the heat-shock response and a loss of nucleoid-occluded ribosomes are observed. We show that the presence of a native-like N-terminal domain is key to SRP-dependent membrane localization and successful production of membrane proteins. The work presented gives new insights and detailed understanding of aberrant membrane protein biogenesis, which can be used for strategies to optimize membrane protein production.


Conflict of interest statement

The authors have declared that no competing interests exist.

Figures

Fig 1
Fig 1. Transcripts of poorly expressing membrane proteins accumulate in immobile polar foci.
(A-D) Left panels: Localization of codY12bs, bcaP12bs, PS1Δ912bs or SUT112bs transcripts in L. lactis NZ9000 cells. Center panels: Corresponding phase contrast images. Scale bar = 2 μm. Colored panels: Location maps constructed from fluorescent TAMRA spots observed in 1185, 877, 765, and 661 cells, respectively, highlighting the preferential localization of each overexpressed mRNA in one half of a model cell. Thick transparent lines: Cell boundaries including the portion occupied by cell wall and membrane as approximated using BcaP-GFP expressing cells (See S1C Fig). Thin transparent lines: Boundaries of chromosomal areas as approximated using DAPI staining in living cells (See S1C Fig). Scale bars depict the relative density of each mRNA species. (E) Intensity profiles drawn along the center of the X-axis of the location maps ((A-D), colored panels) of cells expressing bcaP12bs (solid black line), codY12bs (dotted black line), PS1Δ912bs (solid red line) or SUT112bs (dotted red line). (F) The percentage of cells with bcaP12bs, PS1Δ912bs, or SUT112bs polar mRNA clusters. Error bars: Standard errors. (G) The population-wide distribution of bcaP12bs or PS1Δ912bs mRNA content obtained from single-cell measurements depicted in box plots and histograms (lower panels). Red bars (right panel): The fraction of cells with polar PS1Δ912b mRNA clusters. Blue lines: Gamma distributions fitted to expression data. Fluor = fluorescence. (H) The percentage of cells containing polar bcaP12bs (black) or PS1Δ912bs (red) mRNA clusters plotted as a function of intracellular TAMRA levels (corresponding to bcaP12bs or PS1Δ912bs mRNA levels).
Fig 2
Fig 2. Time-resolved analysis of PS1Δ912bs mRNA abundance and localization using time-lapse microscopy.
(A) PS1Δ912bs mRNA expression in L. lactis LG010 cells was induced following a standard regime after which the cells were transferred to a microscopy slide carrying a thin layer of 1.5% agarose dissolved in GCDM* lacking nisin, for time-lapse fluorescence microscopy analysis. Shown are the portions of 100 tracked cells that contain polar PS1Δ912bs mRNA clusters that do not divide after transfer (ND), that grow very poorly and adopt swollen and deviating cell shapes (-), that grow at a moderate rate (+/-) and that grow at a normal rate (+). (B) Histogram displaying the time it takes for 100 individual cells to remove MS2-GFP-tagged PS1Δ912bs mRNA clusters from their poles, as visualized with time-lapse microscopy. (C) Box plots displaying the initial MS2-GFP expression levels, which is directly correlated to the mRNA level, in PS1Δ912bs-expressing cells that either resumed growth (+) or remained in a non-growing state (-). A Students t-test was performed to test for significance (p<0.005). (D) Schematic representation of the post-transfer sequence of patterns adopted by MS2-GFP-tagged PS1Δ912bs mRNA (colored red). (E) Histogram displaying the time it takes for 100 individual cells to stop nisin A-driven transcription of bcaP12bs mRNA upon transfer of induced liquid cultures to agarose pads with growth medium lacking nisin A, as determined from MS2-GFP distributions in cells using time-lapse microscopy. (F) MS2-GFP expression (right axis) monitored in L. lactis LG010 cells after standard induction, expressing nothing (empty vector control; grey), BcaP (black), or PS1Δ9 (red) and their averaged growth (blue line, left axis). The MS2-GFP fluorescence values are normalized for OD600.
Fig 3
Fig 3. Polar mRNA clusters are spatially unrelated to protein aggregation seeds.
(A) Single-cell bcaP-gfp12bs mRNA content plotted as a function of intracellular BcaP-GFP protein abundance. Red encircled dots: Cells with polar bcaP-gfp12bs clusters. (B) Single-cell PS1Δ9-gfp12bs mRNA content plotted as a function of intracellular PS1Δ9-GFP protein abundance. Red encircled dots: Cells with polar PS1Δ9-gfp12bs clusters. (C) Co-visualization of bcaP-gfp12bs or PS1Δ9-gfp12bs mRNA (FISH) with their protein products. Bottom panels: false-colored overlays of mRNA (red) and protein (cyan). Images were subjected to deconvolution to enhance the contrast. (D) Time course of fold changes (FC) of DnaK-GFP expression in L. lactis LG029, a strain in which dnaK was replaced with dnaK-gfp, after induction of expression of PS1Δ9 (red squares) or BcaP (black squares) compared to control cells (dashed grey line). (E) Co-visualization of DnaK-GFP and overexpressed PS1Δ912bs or bcaP12bs mRNA in L. lactis LG029. Right panels: False colored-overlays of DnaK-GFP (cyan) and mRNA (red). (F) DnaK-GFP levels in single L. lactis LG029 cells displayed as a function of levels of bcaP12bs mRNA (grey filled circles) or PS1Δ912bs mRNA (black dots). Black dots encircled in red: Cells with polar PS1Δ912bs clusters. Scale bar = 2 μm. Yellow lines indicate cell contours.
Fig 4
Fig 4. pNZ8048 plasmids predominantly localize in the chromosomal area, not with mRNA-dense polar clusters.
Plasmids tagged with parS/ParB-GFP were co-visualized with overexpressed bcaP12bs mRNA (A) or PS1Δ912bs mRNA (B) using FISH. Right panels show false-colored images in which mRNA and plasmids are represented in red and cyan, respectively. Images were subjected to deconvolution to enhance the contrast. Scale bar = 2 μm. Yellow lines indicate cell contours. (C) ParB-GFP in all of the captured cells (± 200 cells per experiment) were traced with the ImageJ PeakFinder plug-in and jointly projected into one half of a model cell as described earlier. The intracellular distribution of ParB-GFP foci under various gene expression scenarios (empty vector control (-), BcaP or PS1Δ9 expression) is represented as location maps to highlight the predominant sites of plasmid localization averaged over all cells. (D) Intensity profiles of overexpressed mRNA and co-visualized plasmids created from the location maps to illustrate differences in distribution of pLG-BcaP (black solid line), pLG-PS1Δ9 (red solid line), bcaP12bs (black dotted line), and PS1Δ912bs (red dotted line) along the X-axis of the model cells. Scale bars in microscopy images represent 2 μm.
Fig 5
Fig 5. Effect of polar clustering and ribosome binding on degradation and localization of overexpressed mRNAs.
(A) L. lactis LG010 cells with MS2-GFP-tagged bcaP12bs or PS1Δ912bs mRNA treated or not with Cm and Ery. (B) FISH images of L. lactis NZ9000 cells expressing bcaP12bs or PS1Δ912bs mRNAs with or without functional RBS, and visualized by ms2 probe hybridization. (C) The percentage of cells (n = 500) expressing bcaP12bs or PS1Δ912bs with (+) or without (-) RBS and containing mRNA clusters. Error bars = standard errors. (D) Location maps constructed from FISH images of 500 cells showing the predominant distribution of bcaP12bs or PS1Δ912bs with or without RBS. (E) Snap shots of time-lapse microscopy of L. lactis(rpsB::rpsB-eYFP) cells expressing bcaP12bs or PS1Δ912bs. (F) Boxplots of the ratio between the S2-eYFP protein spread along the long cell axis and total cell length obtained from 100 cells expressing BcaP or PS1Δ9, as well as representative pictures of the corresponding S2-eYFP distributions. ***: A Student’s t-test was performed to test for significance (p<0.005). (G) Time (hr) required for individual PS1Δ912bs-expressing cells (n = 100) to restore growth after transfer to agarose pads lacking nisin, as determined by time-lapse microscopy. (H) Examples of PS1Δ912bs and SUT112bs transcripts remaining in cells after 32 min treatment with rifampicin. (I) RnY-GFP localization in fixed L. lactis LG024a cells expressing nothing (-), bcaP12bs, or PS1Δ912bs. Strain LG024a constitutively expresses rnY-gfp ectopically from its own promoter. The fusion gene was introduced additional to rnY to not interfere with essential mRNA breakdown.
Fig 6
Fig 6. N-terminal domain of membrane proteins influences mRNA localization and protein production.
(A) Schematic representation of the transmembrane domains, as predicted by TMHMM, of BcaP (1) and PS1Δ9 (2) and chimeric proteins in which a portion of N-terminal domains of PS1Δ9 (PS1Δ9N) is replaced by those of BcaP (3) and vice versa (4). (B) mRNA localization in representative cells expressing bcaPN-PS1Δ912bs (3) or PS1Δ9N-bcaP12bs (4) transcripts. (C) The percentage of cells (n = 400) without polar mRNA of the proteins depicted in A. (D) Schematic representation of PS1Δ9 (red bars) fused via its N-terminal domain and a flexible linker containing a TEV protease site (blue dot) to the newly developed fusion partner BLS (for BcaP Leading Segment; grey bars). (E) Dotblots of cytoplasmic fractions (C) and membrane fractions (M) of L. lactis NZ9000 cells grown in GCDM* or GCDM* supplemented with 1.5% casitone, and expressing the proteins shown in A and D. (F) Quantification of dotblot signals. Averaged signals are displayed as percentages of the signals obtained for BcaP expression. (G) Representative image of cells expressing PS1Δ912bs or BLS-PS1Δ912bs mRNA as visualized by FISH. Numbers in B, C, E, and F refer to the construct numbers in A and D.
Fig 7
Fig 7. Increased uracil density in L. lactis genes encoding membrane proteins.
(A) The relative codon bias for all hydrophobic amino acids in L. lactis MG1363 (left bars) and E. coli K12 (right bars). The red bars indicate the codon(s) with the highest uracil content. (B) Boxplots show that the uracil density of transcripts encoding membrane proteins is increased in both species. A Student’s t-test was performed: the uracil density was significantly different (p < 0.0001; indicated by ****) between the two types of transcripts for both E. coli and L. lactis.

Similar articles

Cited by

References

    1. von Heijne G. The membrane protein universe: what’s out there and why bother? J Intern Med. 2007;261: 543–57. 10.1111/j.1365-2796.2007.01792.x - DOI - PubMed
    1. Zweers JC, Barák I, Becher D, Driessen AJ, Hecker M, Kontinen VP, et al. Towards the development of Bacillus subtilis as a cell factory for membrane proteins and protein complexes. Microb Cell Fact. 2008;7: 10 10.1186/1475-2859-7-10 - DOI - PMC - PubMed
    1. Schlegel S, Hjelm A, Baumgarten T, Vikström D, de Gier J-W. Bacterial-based membrane protein production. Biochim Biophys Acta. 2014;1843: 1739–49. 10.1016/j.bbamcr.2013.10.023 - DOI - PubMed
    1. Kunji ERS, Slotboom D-J, Poolman B. Lactococcus lactis as host for overproduction of functional membrane proteins. Biochim Biophys Acta. 2003;1610: 97–108. - PubMed
    1. Zweers JC, Wiegert T, van Dijl JM. Stress-responsive systems set specific limits to the overproduction of membrane proteins in Bacillus subtilis. Appl Environ Microbiol. 2009;75: 7356–64. 10.1128/AEM.01560-09 - DOI - PMC - PubMed

MeSH terms