. 2016 Dec 15;12(12):e1006488.
doi: 10.1371/journal.pgen.1006488. eCollection 2016 Dec.

Unique Function of the Bacterial Chromosome Segregation Machinery in Apically Growing Streptomyces - Targeting the Chromosome to New Hyphal Tubes and its Anchorage at the Tips

Affiliations

Unique Function of the Bacterial Chromosome Segregation Machinery in Apically Growing Streptomyces - Targeting the Chromosome to New Hyphal Tubes and its Anchorage at the Tips

Agnieszka Kois-Ostrowska et al. PLoS Genet. .

Abstract

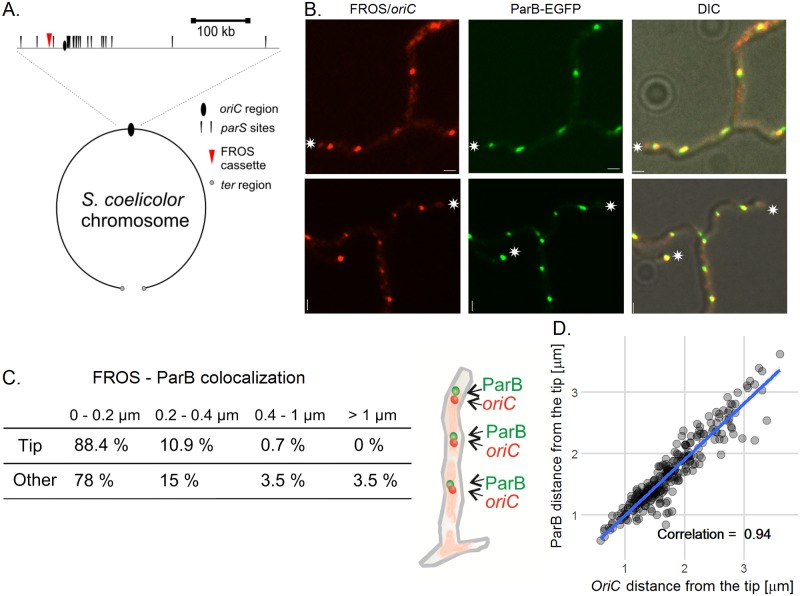
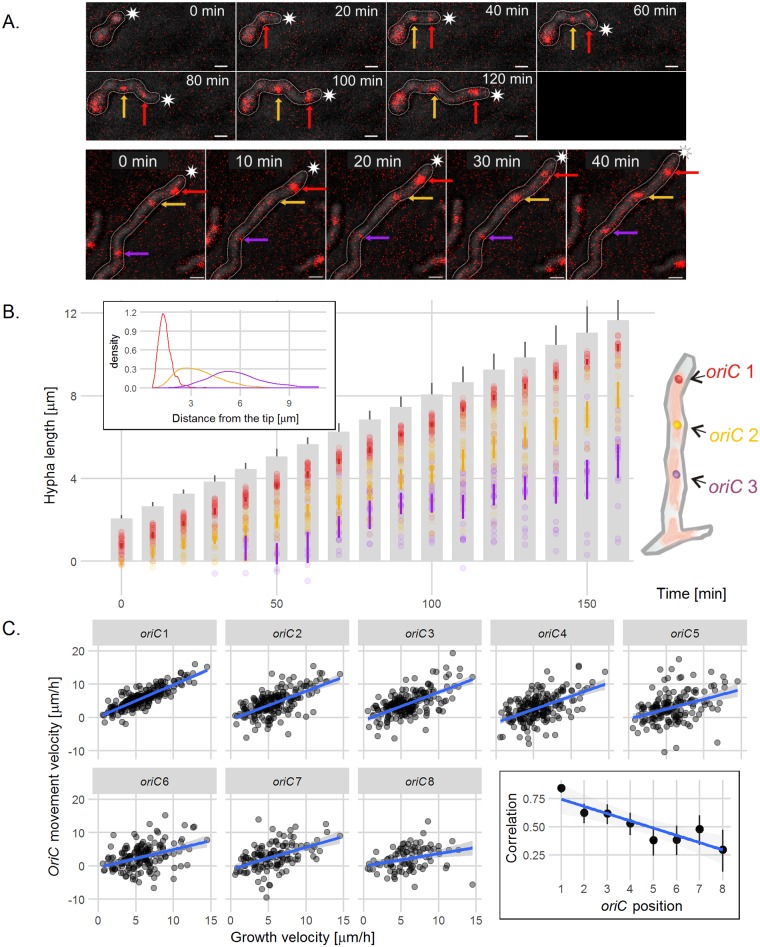
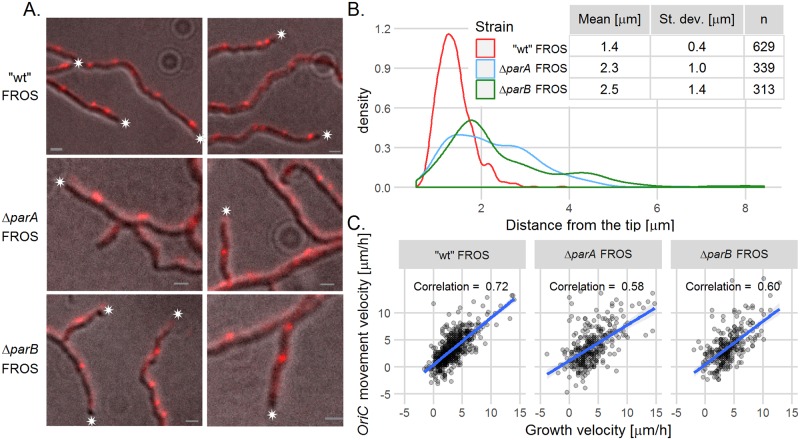
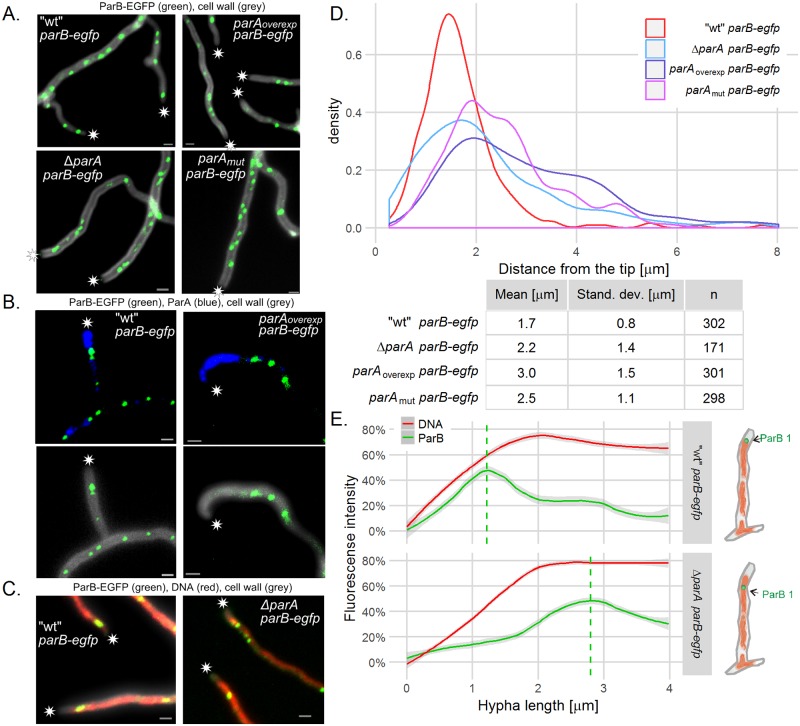
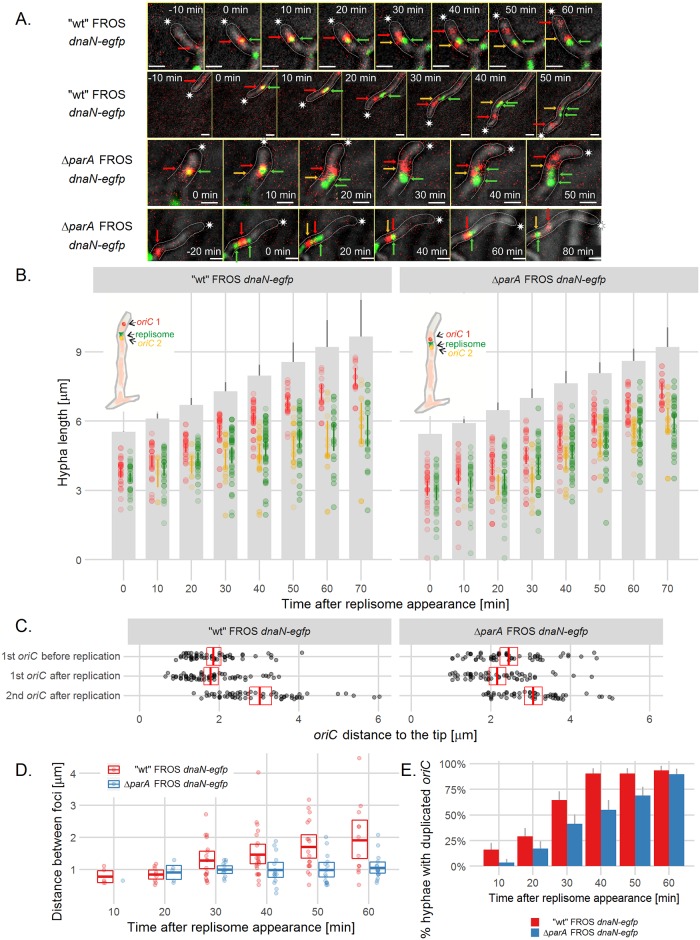
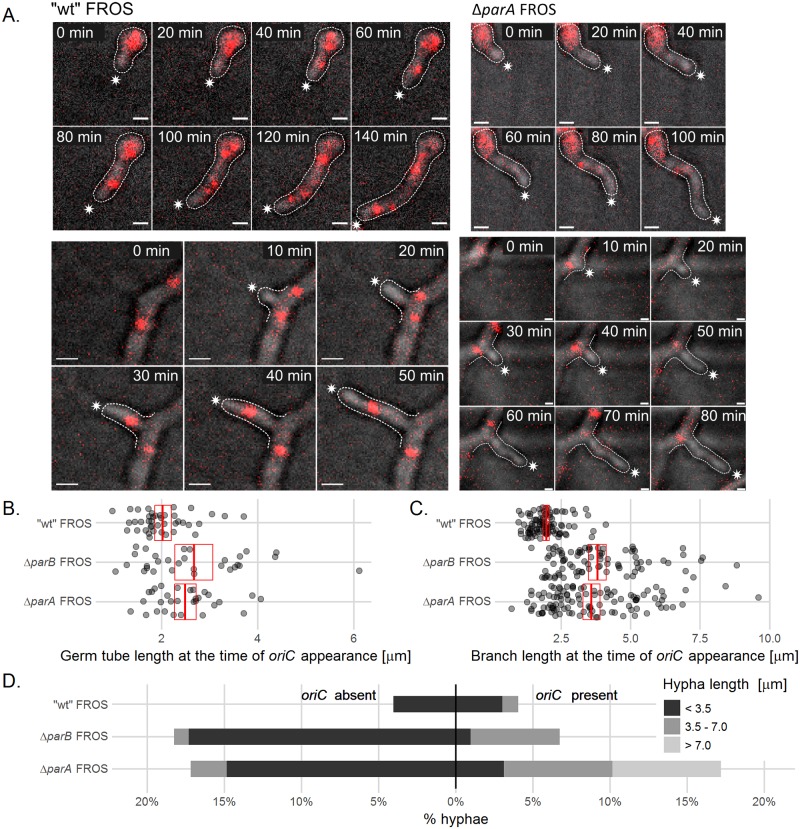
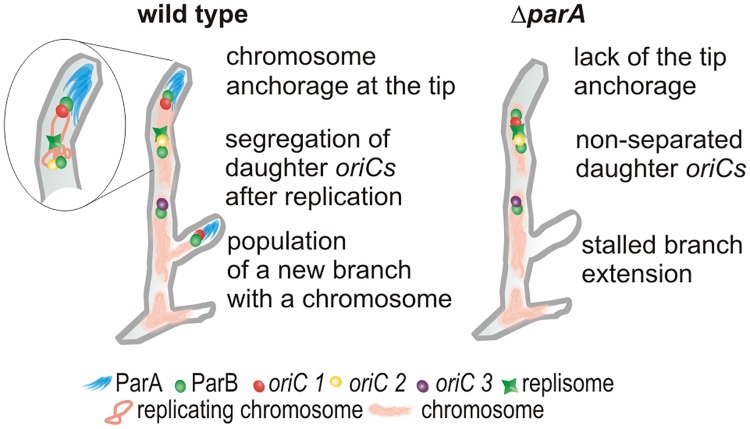
The coordination of chromosome segregation with cell growth is fundamental to the proliferation of any organism. In most unicellular bacteria, chromosome segregation is strictly coordinated with cell division and involves ParA that moves the ParB nucleoprotein complexes bi- or unidirectionally toward the cell pole(s). However, the chromosome organization in multiploid, apically extending and branching Streptomyces hyphae challenges the known mechanisms of bacterial chromosome segregation. The complex Streptomyces life cycle involves two stages: vegetative growth and sporulation. In the latter stage, multiple cell divisions accompanied by chromosome compaction and ParAB assisted segregation turn multigenomic hyphal cell into a chain of unigenomic spores. However, the requirement for active chromosome segregation is unclear in the absence of canonical cell division during vegetative growth except in the process of branch formation. The mechanism by which chromosomes are targeted to new hyphae in streptomycete vegetative growth has remained unknown until now. Here, we address the question of whether active chromosome segregation occurs at this stage. Applied for the first time in Streptomyces, labelling of the chromosomal replication initiation region (oriC) and time-lapse microscopy, revealed that in vegetative hyphae every copy of the chromosome is complexed with ParB, whereas ParA, through interaction with the apical protein complex (polarisome), tightly anchors only one chromosome at the hyphal tip. The anchor is maintained during replication, when ParA captures one of the daughter oriCs. During spore germination and branching, ParA targets one of the multiple chromosomal copies to the new hyphal tip, enabling efficient elongation of hyphal tube. Thus, our studies reveal a novel role for ParAB proteins during hyphal tip establishment and extension.


Conflict of interest statement

The authors have declared that no competing interests exist.

Figures

Fig 1
Fig 1. ParB-EGFP complexes co-localize with all oriCs in multigenomic S. coelicolor vegetative hyphae.
(A) Scheme of FROS cassette localization in the S. coelicolor chromosome. (B) Images of ParB-EGFP (green) and FROS (red) foci in vegetative hyphae of FROS parB-egfp strain (AK113). The hyphal tips are marked with an asterisk, scale bar—1 μm. (C) Co-localization of FROS and ParB-EGFP foci in AK113 strain along the vegetative hyphae and at the tips of hyphae; the percentage of the foci localizing within the given distance is indicated. (D) Correlation between the distance from ParB-EGFP to the tip of hyphae and distance from FROS signal to tip of FROS parB-egfp (AK113) strain hyphae. The scatterplot with a fitted linear model shows data from 16 hyphae measured at 10 minute time intervals. Data were analyzed using a mixed effects model which can compensate for an individual hypha effect and the standard linear model. Results of both models were similar, comparison of Log-likelihoods of both models showed that random effects of individual hyphae were not significant. Correlation was calculated using the Pearson method.
Fig 2
Fig 2. The tip-proximal chromosome follows the extending vegetative hyphae tip.
(A) Time-lapse snapshots of the FROS strain (DJ-NL102) germinating spore (top panel) and vegetative hypha (bottom panel). The images are the overlay of TetR-mCherry fluorescence (red) and DIC image (gray) (for separate images of TetR-mCherry fluorescence and DIC see S3D Fig). The arrows indicate: red—oriC1 (closest to the tip of the hypha), yellow—oriC2, purple—oriC3, asterisks indicate the tip of outlined hyphae, scale bar—1 μm. (B) Positions of the FROS complexes in the extending hyphae of FROS strain (DJ-NL102). Grey bars are representations of the extending hyphae with 95% confidence interval for hyphal length and semitransparent colored dots represent oriC positions (red–oriC 1, yellow–oriC 2, purple–oriC 3, as shown in the schematic drawing at the right), colored lines indicate 95% mean confidence intervals (analyzed for 41 hyphae). Inset: Distribution (shown as probability density function) of the distances between the hyphal tip and the oriC 1 (red), oriC 2 (yellow) and oriC 3 (purple). (C) Correlation of hyphal extension rate and FROS complex movement calculated for 8 subsequent oriCs from the tip. Scatterplots with fitted linear models show data from 20 hyphae measured at 10 minute time intervals, grey area indicates 95% confidence interval for the model. Minus sign means that the distance between the chromosome and the tip is increasing and a plus sign that it is decreasing. Data were analyzed using a mixed effects model, which can compensate for the effect of individual hyphae and a standard linear model. Results of both models were very similar, comparison of Log-likelihoods of both models showed that random effects of individual hyphae were not significant. Inset: the calculated correlation in relation to the oriC position in the hyphae with a fitted linear model. Correlations were calculated using Pearson method with 95% confidence intervals.
Fig 3
Fig 3. The constant distance between oriC and the hyphal tip is dependent on ParAB.
(A) Images of FROS in the “wild type” FROS strain (DJ-NL102), ΔparA FROS (AK115) and ΔparB FROS (AK114) strains. The images are the overlay of TetR-mCherry fluorescence (red) and DIC image (grey), asterisks indicate the tip of hyphae, scale bar—1 μm. (B) Distribution (shown as probability density function) of the distances between the hyphal tip and tip-proximal FROS signal in “wild type” FROS (DJ-NL102), ΔparA FROS (AK115) and ΔparB FROS (AK114) strains. (C) Correlation between hyphal extension rate and the tip-proximal oriC movement velocity in “wild type” FROS (DJ-NL102), ΔparA FROS (AK115) and ΔparB FROS (AK114) strains (analyzed for 41 of DJ-NL102, 31 AK115 and 30 AK114 hyphae). Scatterplots with fitted linear models, grey area indicates 95% confidence interval for the model.
Fig 4
Fig 4. Localization of ParB complex is dependent on ParA.
(A) Images of ParB-EGFP (green) complexes in the hyphae of”wild type” parB-egfp (J3310) ΔparA parB-egfp (J3318), parAoverexp parB-egfp (DJ532), parAmut parB-egfp (DJ598) strains, merged with cell wall staining (gray). (B) Co-localization of ParB-EGFP (green) with immunostained ParA (blue) in “wild type” parB-egfp (J3310) and parAoverexp parB-egfp (DJ532). Top panel shows the ParA immunofluorescence (blue) merged with ParB-EGFP fluorescence (green). The bottom panel shows ParB-EGFP fluorescence (green) merged cell wall staining (grey). (C) Localization of ParB-EGFP (green) within the nucleoid (DNA staining—red) in”wild type” parB-egfp (J3310) and in ΔparA parB-egfp (J3318). In panels A, B and C asterisks indicate the tip of hyphae and scale bars—1 μm. (D) The distribution (shown as probability density function) of the distances between the hyphal tip and the tip-proximal ParB-EGFP complex in „wild type” parB-egfp (J3310), ΔparA parB-egfp (J3318), parAoverexp parB-egfp (DJ532), parAmut parB-egfp (DJ598) (analyzed for 170–300 hyphae). (E) Fluorescence intensity of ParB-EGFP and DNA stain measured from the hyphal tip in “wild type” parB-egfp (J3310) and ΔparA parB-egfp (J3318) (15 and 21 hyphae analyzed). For each hypha, the fluorescence signal was normalized so that the maximum signal was 100%. Lines are models fitted using a Loess algorithm implemented in the R program, grey area indicates 95% confidence interval. Dashed line shows maximum ParB fluorescence intensity as calculated by the model.
Fig 5
Fig 5. oriC is captured at the tip soon after replication.
(A) Time-lapse snapshots of FROS (TetR-mCherry fluorescence, red) and DnaN-EGFP foci (green) in the extending hyphae of “wild type” FROS dnaN-egfp (AK122) (top panel) and ΔparA FROS dnaN-egfp (AK123) (bottom panel) strains. The fluorescence images are merged with the DIC images (grey) (for separate images of TetR-mCherry overlaid with DnaN-EGFP fluorescence and DIC see S8 Fig). Asterisks indicate the tip of the outlined hyphae, green arrows point to the replisome complex, red arrows point to the tip-proximal oriC, yellow arrows point to tip-distal oriC, scale bar—1 μm. (B) Position of the oriC and DnaN-EGFP complexes in relation to the tips of extending hyphae in “wild type” FROS dnaN-egfp (AK122) (left panel) and ΔparA FROS dnaN-egfp (AK123) (right panel) strains (analyzed for 32 AK122 hyphae and 29 AK123 hyphae). Grey bars are representations of the extending hyphae with 95% confidence interval for hyphae length and semitransparent colored dots represent oriC positions (red: tip-proximal oriC 1, yellow: tip-distal oriC 2, green: replisome, as shown on the schematic drawings), colored lines indicate 95% mean confidence intervals. (C) The distance between the tip and the tip-proximal oriC 10–20 minutes before and 10–20 minutes after oriC duplication in “wild type” FROS dnaN-egfp (AK122) and ΔparA FROS dnaN-egfp (AK123) strains. (D) Distance between duplicated oriCs at the indicated time after replisome appearance in “wild type” FROS dnaN-egfp (AK122) and ΔparA FROS dnaN-egfp (AK123) strains. In C and D panel crossbars show the mean with 95% confidence intervals. (E) Percentage of hyphae in which the duplicated oriCs could be detected at the indicated time after replisome appearance. Error bars show 95% confidence intervals.
Fig 6
Fig 6. ParA anchorage is required for chromosome migration to germ tubes and hyphal branches.
(A) Time-lapse snapshots of FROS complexes during germination (top panels) and branch formation (bottom panels) in “wild type” FROS (DJ-NL102) and ΔparA FROS (AK115) strains. The images are the overlay of TetR-mCherry (red) fluorescence and DIC image (for separate images of TetR-mCherry fluorescence and DIC image see S11 Fig). The asterisks indicate the tip of outlined hyphae, scale bar—1 μm. (B) Germ tube length at the time of the first oriC appearance in “wild type” FROS (DJ-NL102), ΔparA FROS (AK115) and ΔparB FROS (AK114) strains (analyzed for 41 DJ-NL102, 31 AK115 and 30 AK114 germ tubes). (C) Branch length at the time of the first oriC appearance in “wild type” FROS (DJ-NL102), ΔparA FROS (AK115) and ΔparB FROS (AK114) strains. 95 hyphae of DJ-NL102, 106 of AK115 and 85 of AK114 strain were analyzed. In B and C, red crossbars show means with 95% confidence intervals. (D) Percentage and length of stalled branches with and without the FROS signal in “wild type” FROS (DJ-NL102), ΔparA FROS (AK115) and ΔparB FROS (AK114) strains. Hyphae were classified as stalled if no re-initiation of growth could be observed until the end of the experiment or for at least one hour (whichever was longer). 99 hyphal branches were analyzed of the DJ-NL102, 128 of AK115 and 104 of AK114 strain.
Fig 7
Fig 7. Model of ParA anchorage of the oriC/ParB complex at the tips of extending hyphae.
Following chromosome replication, the tip-proximal of one of the two daughter oriCs is captured by the polarisome associated ParA which maintains its constant distance to the tip. The other daughter oriC remains associated with the replisome and is left behind by the extending tip. During branching the oriC/ParB complex proximal to newly established hyphal tip is captured by ParA and targeted into the branch.

Similar articles

Cited by

References

    1. Wang X, Montero Llopis P, Rudner DZ. Organization and segregation of bacterial chromosomes. Nature reviews Genetics. Nature Publishing Group; 2013;14: 191–203. - PMC - PubMed
    1. Badrinarayanan A, Le TBK, Laub MT. Bacterial Chromosome Organization and Segregation. Annu Rev Cell Dev Biol. 2015;31: 171–99. 10.1146/annurev-cellbio-100814-125211 - DOI - PMC - PubMed
    1. Adams DW, Wu LJ, Errington J. Cell cycle regulation by the bacterial nucleoid. Current opinion in microbiology. Elsevier Ltd; 2014;22C: 94–101. - PMC - PubMed
    1. Mierzejewska J, Jagura-Burdzy G. Prokaryotic ParA-ParB-parS system links bacterial chromosome segregation with the cell cycle. Plasmid. 2012. pp. 1–14. - PubMed
    1. Errington J, Murray H, Wu LJ. Diversity and redundancy in bacterial chromosome segregation mechanisms. Philosophical transactions of the Royal Society of London Series B, Biological sciences. 2005;360: 497–505. 10.1098/rstb.2004.1605 - DOI - PMC - PubMed

MeSH terms

LinkOut - more resources