. 2016 Dec 15;12(12):e1006483.
doi: 10.1371/journal.pgen.1006483. eCollection 2016 Dec.

Loss of RMI2 Increases Genome Instability and Causes a Bloom-Like Syndrome

Affiliations

Loss of RMI2 Increases Genome Instability and Causes a Bloom-Like Syndrome

Damien F Hudson et al. PLoS Genet. .

Abstract

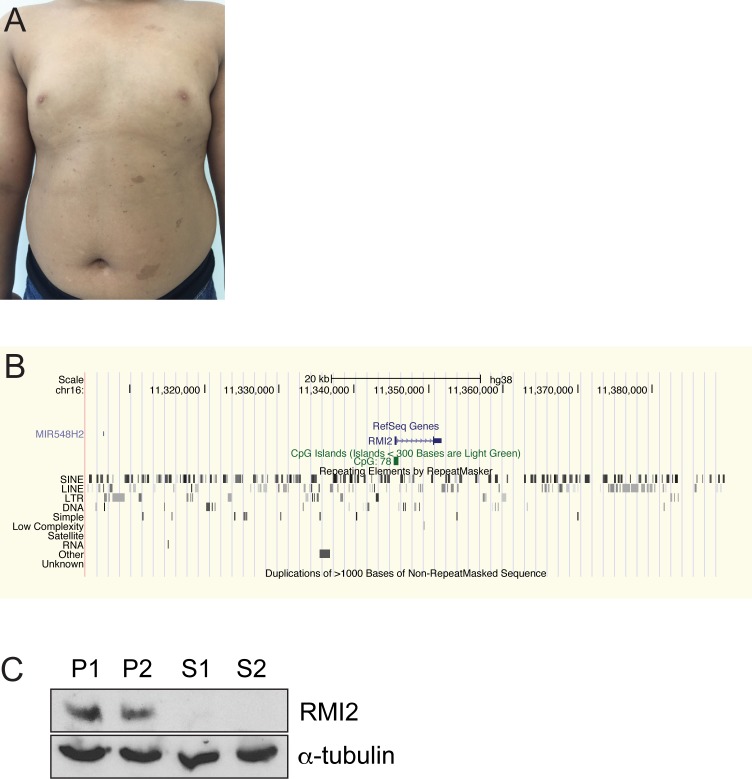
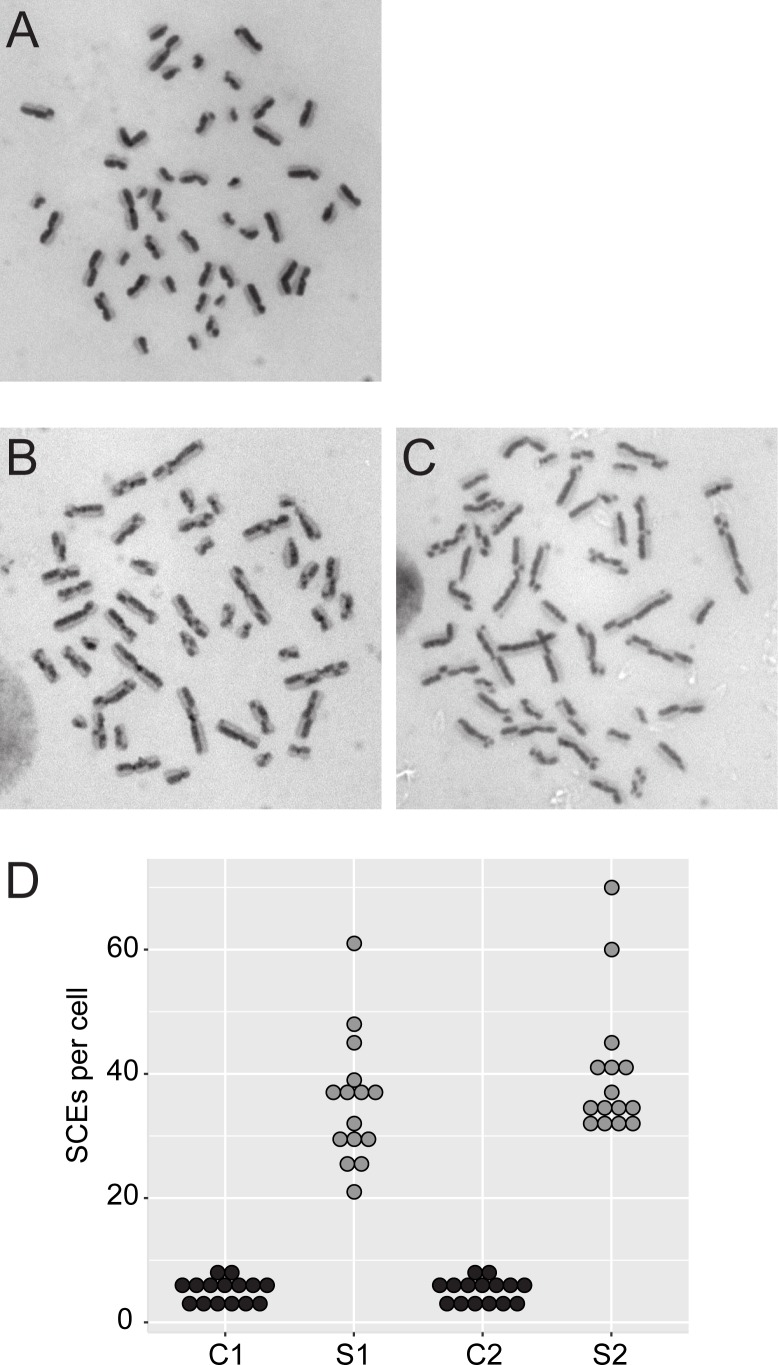
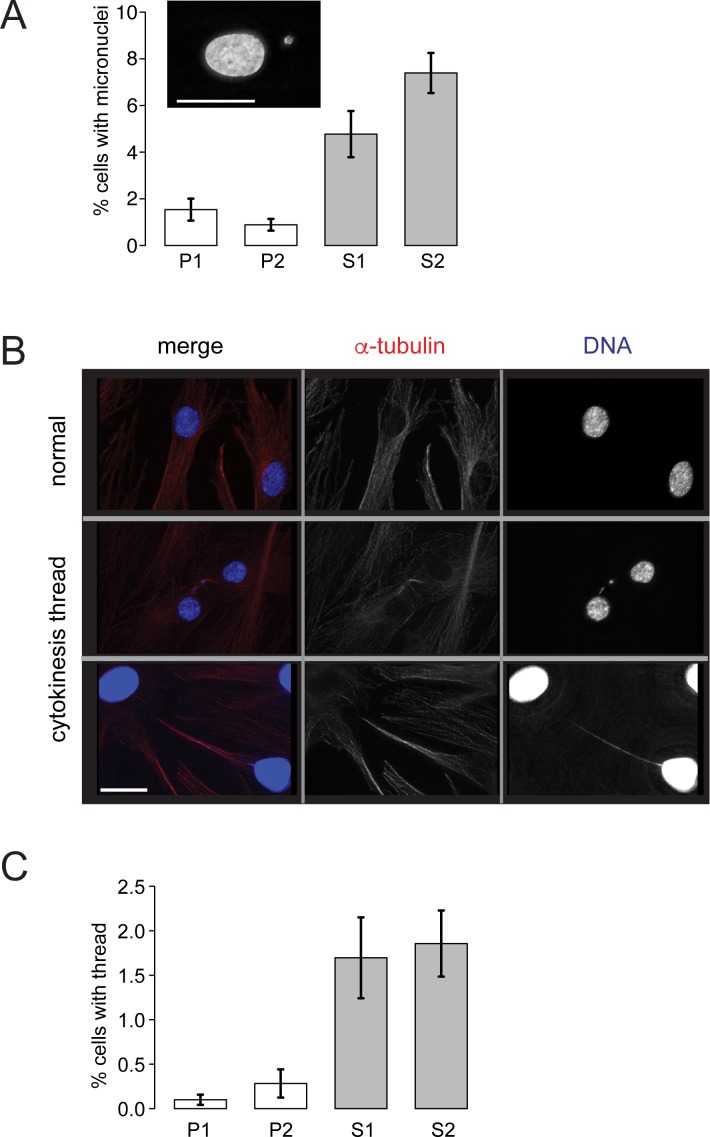
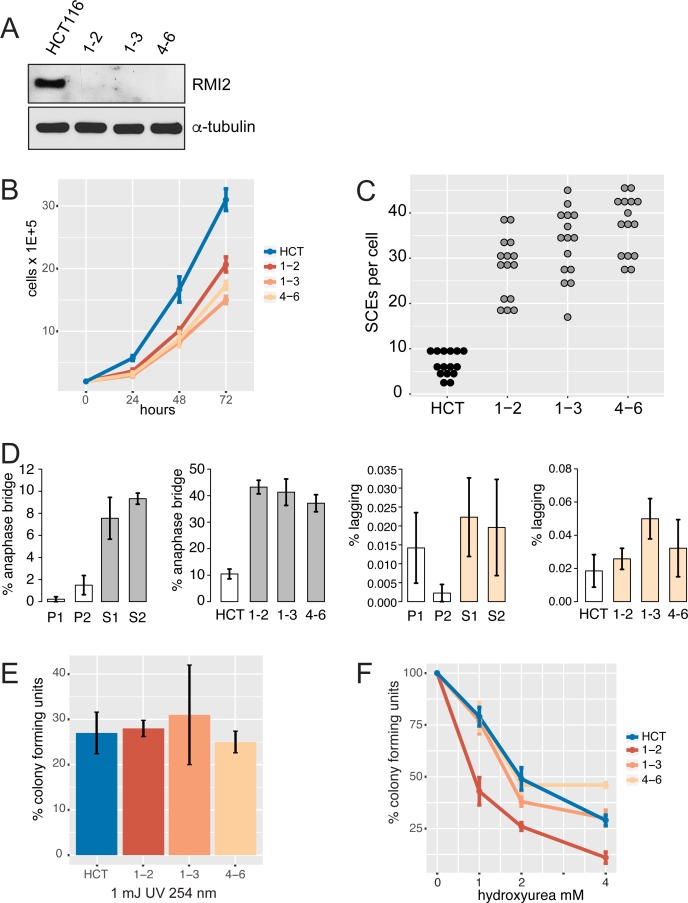
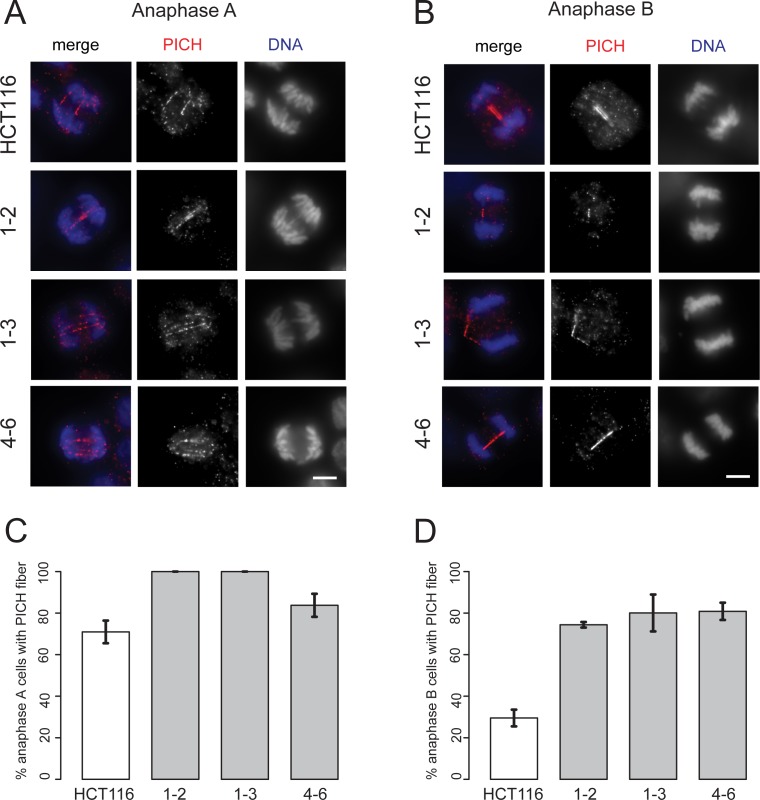
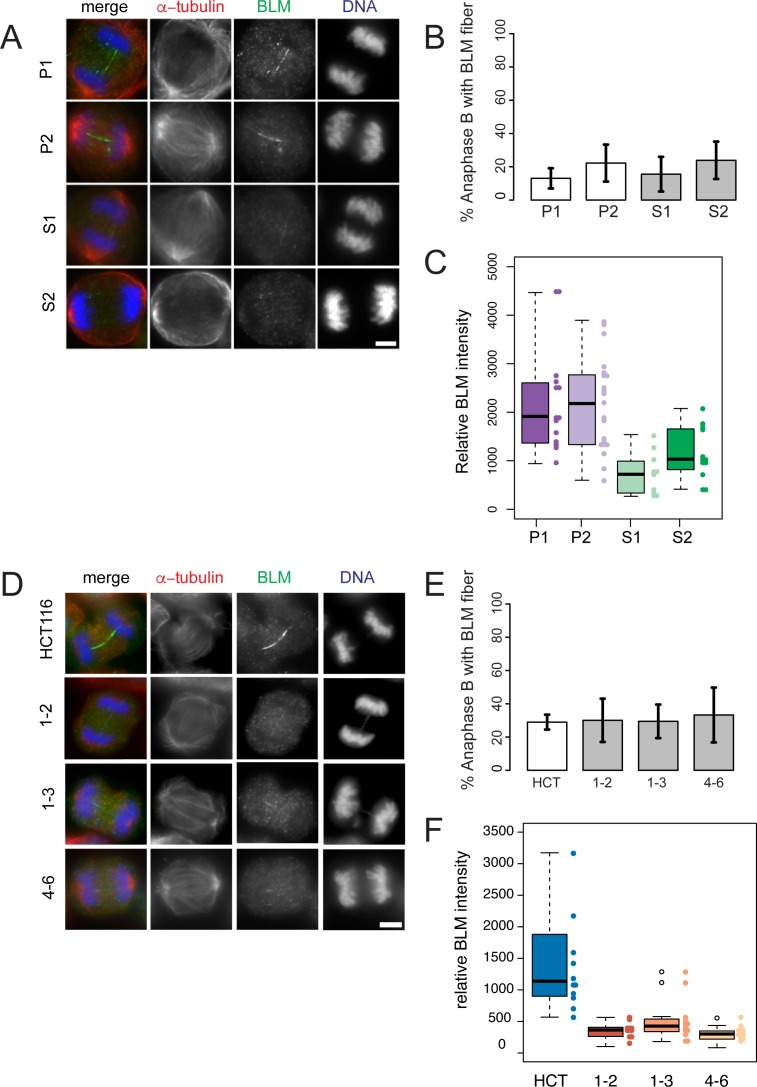
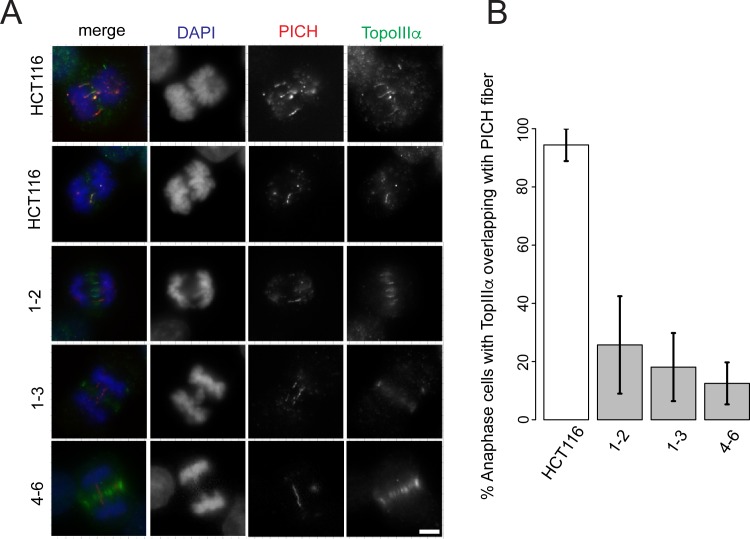
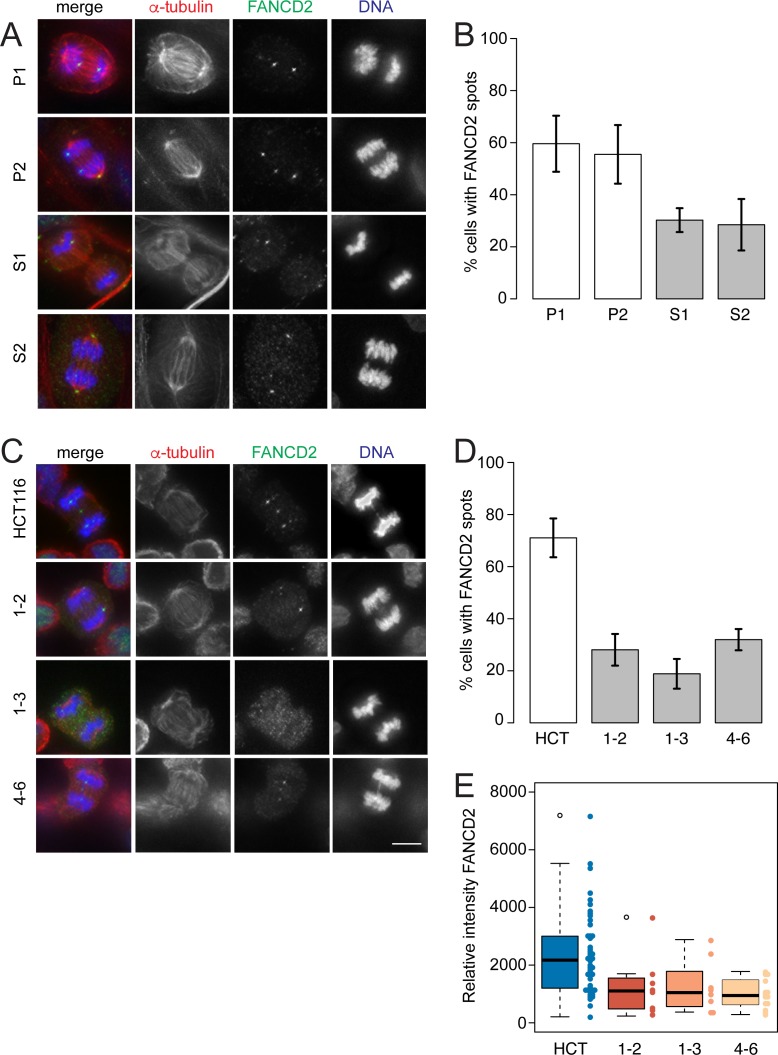
Bloom syndrome is a recessive human genetic disorder with features of genome instability, growth deficiency and predisposition to cancer. The only known causative gene is the BLM helicase that is a member of a protein complex along with topoisomerase III alpha, RMI1 and 2, which maintains replication fork stability and dissolves double Holliday junctions to prevent genome instability. Here we report the identification of a second gene, RMI2, that is deleted in affected siblings with Bloom-like features. Cells from homozygous individuals exhibit elevated rates of sister chromatid exchange, anaphase DNA bridges and micronuclei. Similar genome and chromosome instability phenotypes are observed in independently derived RMI2 knockout cells. In both patient and knockout cell lines reduced localisation of BLM to ultra fine DNA bridges and FANCD2 at foci linking bridges are observed. Overall, loss of RMI2 produces a partially active BLM complex with mild features of Bloom syndrome.


Conflict of interest statement

The authors have declared that no competing interests exist.

Figures

Fig 1
Fig 1. Bloom-like features in two siblings with an RMI2 gene deletion.
(A) Sibling S1 shows typical café-au-lait macules on torso that are a common feature of Bloom syndrome. (B) UCSC Genome Browser view of the homozygous deleted region that spans the entire RMI2 gene. (C) Immunoblot confirms complete loss of the RMI2 protein in each sib, S1 and S2. Heterozygous parents, P1 and P2, show the presence of RMI2. Anti-α-tubulin was used a protein loading control.
Fig 2
Fig 2. Hyper-recombination in RMI2-deleted individuals.
Strand-specific labelling of sister chromatids stain dark and light in control lymphocytes (A) and sib 1 and 2 (B) and (C), respectively. (D) Sister chromatid exchanges were counted from 15 cells per individual. C1 and 2 are sex and age-matched control cells.
Fig 3
Fig 3. RMI2 suppresses chromosome mis-segregation events.
Fibroblasts grown on coverslips were fixed and then stained with DAPI. (A) Scoring of fibroblast cells with micronuclei. At least 3000 cells were scored from each of P1, P2, S1, S2 cells in matched cell passage number from four independent experiments. Example of a cell with a micronucleus is shown in inset, scale bar 15 μm. (B) Representative cells showing DNA bridges connecting interphase cells. Top panel shows normal and the bottom two panels show affected interphase cells with interconnecting DNA threads. Note the bottom cell has had the DAPI/DNA (blue) signal enhanced to visualise the DNA thread. Cells were co-stained with anti-α-tubulin (red). Scale bar 5 μm. (C) Scoring of fibroblast cells with interphase interconnecting DNA threads. At least 3000 cells were scored from each of parental control (P1, P2) and RMI2 deficient siblings (S1, S2) in matched cell passage number from three independent experiments. Error bars represent standard error of the mean.
Fig 4
Fig 4. RMI2 cellular defects in knockout cell lines.
(A) Immunoblot of HCT-116 wild type and three independent RMI2 null clones (1–2, 1–3 and 4–6) confirms loss of RMI2 protein in gene knockout cells. Equivalent cell extract (40 μg) was loaded in each lane with anti-α-tubulin used as a loading control. (B) Cell proliferation analysis over three days performed in triplicate for each cell line. (C) Sister chromatid exchange analysis on parental and the three RMI2 null clones. Fifteen metaphase cells were analysed for each cell line. (D) Quantification of anaphase bridges and lagging chromosome from parental heterozygote, P1, P2, and homozygous siblings S1 and S2, and in RMI2 wild type and null HCT-116 cells. For fibroblasts (P1, P2, S1, S2) at least 200 anaphase/telophase cells were scored in total for each line from four independent experiments using matched cell passage number. For HCT-116 cells, at least 200 anaphase/telophase cells were scored for each of wild-type HCT-116, and RMI2 null clones 1–2, 1–3 and 4–6 from three independent experiments using matched cell passage number. Error bars represent standard error of the mean. (E) Colony forming and UV sensitivity assays on HCT-116 and null cell lines. The total number of colonies from three independent experiments are normalised against untreated cells. (F) Colony forming and hydroxyurea sensitivity assays on HCT-116 and null cell lines. Experiments were normalised as in the UV-challenge experiment. Error bars represent standard error of the mean.
Fig 5
Fig 5. Loss of RMI2 causes significant elevation in UFBs.
Representative images and RMI2 wild-type and null HCT-116 cells stained with anti-PICH (red) and DAPI for DNA (blue) for anaphase A (A) and anaphase B (B). Scale bar 5 μm. Quantification of PICH fiber detection in anaphase A cells in (C) and anaphase B (D) from wild-type HCT-116 control and RIM2 null cells (1–2, 1–3, 4–6). Data taken from three independent experiments, with 20 anaphase A and 20 anaphase B cells scored for each HCT-116 cell line (wild-type, 1–2, 1–3, 4–6) per experiment. Error bars represent standard error of the mean.
Fig 6
Fig 6. BLM fibers are weaker in anaphase B cells lacking RMI2.
Representative anaphase B images of parental heterozygous, P1 and P2, and homozygous siblings S1 and S2, fibroblasts (A) and RMI2 wild-type and null HCT-116 cells (D) stained with anti-BLM (green), anti-α-tubulin (red) and DAPI for DNA (blue). Scale bar 5 μm. For anaphase A analysis see S8 Fig. Quantification of BLM-staining fibers in anaphase B cells in (B) parent (P1, P2) and sibling (S1, S2), and (E) wild-type HCT-116 control and RIM2 null cells (1–2, 1–3, 4–6). Data taken from three independent experiments, with a minimum of 15 anaphase B cells scored for each fibroblast cell line (P1, P2, S1, S2) per experiment and also for each HCT-116 cell line (wild type, 1–2, 1–3, 4–6) per experiment. Error bars represent standard error of the mean. Quantification of BLM fiber intensity on fibroblast cell line (P1, P2, S1, S2) (C) and wild-type HCT-116 and RIM2 null anaphase cells (F). Data for C, F pooled from anaphase A and B cells from two independent experiments.
Fig 7
Fig 7. RMI2 is necessary for localization of TopoIIIα to anaphase UFBs.
Representative images of RMI2 wild-type and null HCT-116 cells (A) stained with anti-TopoIIIα (green), anti-PICH (red) and DAPI for DNA (blue). Scale bar 5 μm. (B) Quantification of anaphase B HCT-116 wild-type and RMI2 null cells detected with PICH and TopoIIIα. Numbers represent only the pool of anaphase B cells with PICH fibers and whether these demonstrated colocalization with TopoIIIα. The data was taken from three independent experiments, with a minimum of nine anaphase cells per experiment per cell line.
Fig 8
Fig 8. FANCD2 sister foci are reduced in RMI2 deficient cells.
Representative images of parental heterozygous, P1 and P2, and homozygous S1 and S2, fibroblasts (A) and RMI2 wild-type and null HCT-116 cells (C) stained with anti-FANCD2 (green), anti-α-tubulin (red) and DAPI for DNA (blue). Scale bar 5 μm. Note the FANCD2 signal in a DAPI negative area (presumably a UFB), connecting bulky bridged DNA in HCT-116 wild-type cells. Occasionally the FANCD2 antibody recognised centrosomes (see image P2, S2), which was discounted in all scoring. Quantification of anaphase/telophase cells detected with FANCD2 sister foci in (B) parent (P1, P2) and sibling (S1, S2) and (D) HCT-116 wild-type and RMI2 null cells. Data taken from three independent experiments, with 13–30 anaphases scored for each fibroblast cell line (P1, P2, S1, S2) per experiment and 30 anaphases scored for HCT-116 cells (wild-type, 1–2, 1–3, 4–6) per experiment. Error bars represent standard error of the mean. (E) Quantification of FANCD2 spot intensity on HCT-116 wild-type and RIM2 null cells in anaphase/telophase cells. Data pooled from two independent experiments.

References

    1. German J. Bloom syndrome: a mendelian prototype of somatic mutational disease. Medicine (Baltimore). 1993;72: 393–406. - PubMed
    1. Monnat RJ. Human RECQ helicases: roles in DNA metabolism, mutagenesis and cancer biology. Semin Cancer Biol. 2010;20: 329–339. 10.1016/j.semcancer.2010.10.002 - DOI - PMC - PubMed
    1. Chaganti RS, Schonberg S, German J. A manyfold increase in sister chromatid exchanges in Bloom’s syndrome lymphocytes. Proc Natl Acad Sci U S A. 1974;71: 4508–4512. - PMC - PubMed
    1. Ellis NA, Groden J, Ye TZ, Straughen J, Lennon DJ, Ciocci S, et al. The Bloom’s syndrome gene product is homologous to RecQ helicases. Cell. 1995;83: 655–666. - PubMed
    1. Johnson FB, Lombard DB, Neff NF, Mastrangelo MA, Dewolf W, Ellis NA, et al. Association of the Bloom syndrome protein with topoisomerase IIIalpha in somatic and meiotic cells. Cancer Res. 2000;60: 1162–1167. - PubMed

MeSH terms