. 2016 Dec 15;11(12):e0168203.
doi: 10.1371/journal.pone.0168203. eCollection 2016.

Recruitment Kinetics of Tropomyosin Tpm3.1 to Actin Filament Bundles in the Cytoskeleton Is Independent of Actin Filament Kinetics

Affiliations

Recruitment Kinetics of Tropomyosin Tpm3.1 to Actin Filament Bundles in the Cytoskeleton Is Independent of Actin Filament Kinetics

Mark A Appaduray et al. PLoS One. .

Abstract

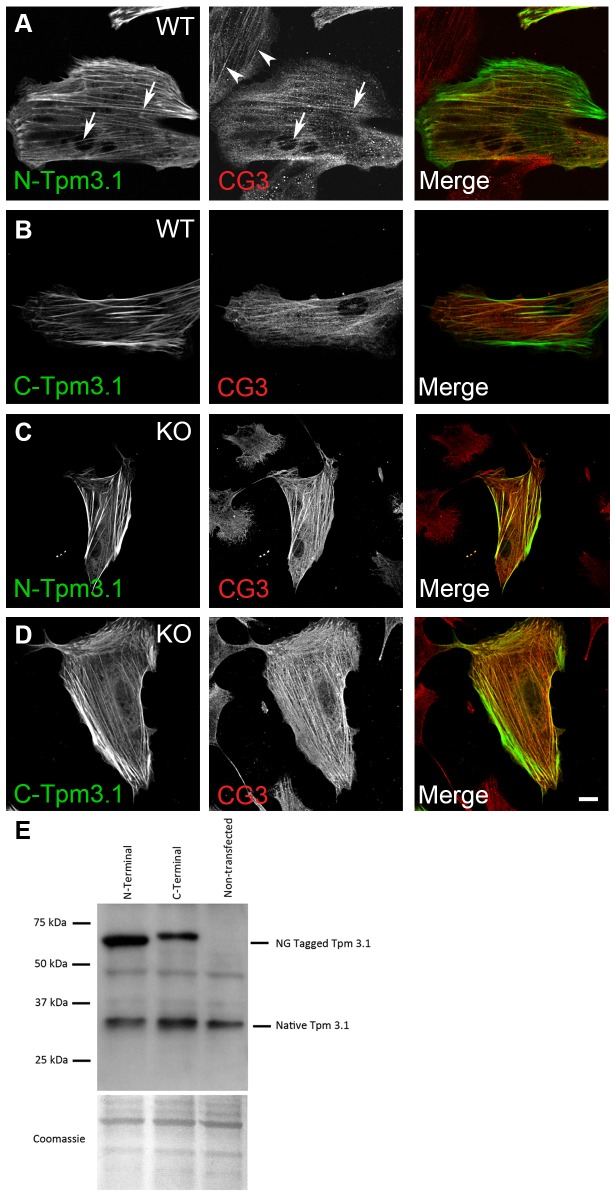
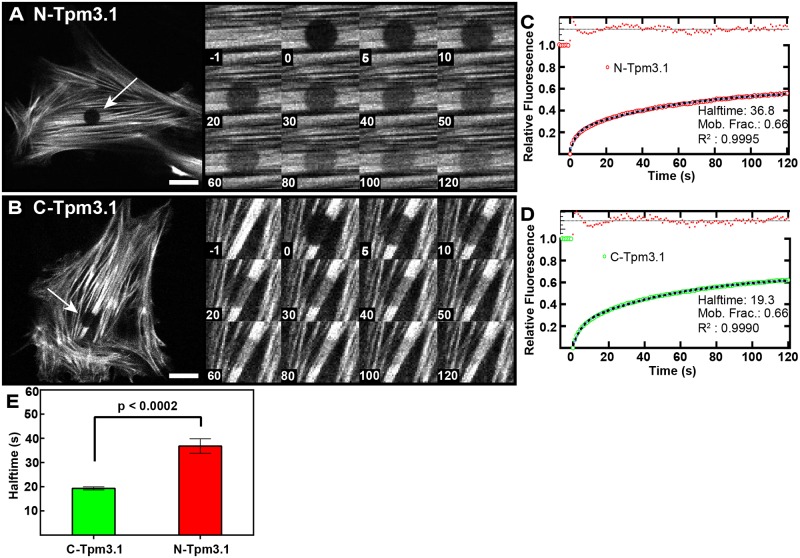
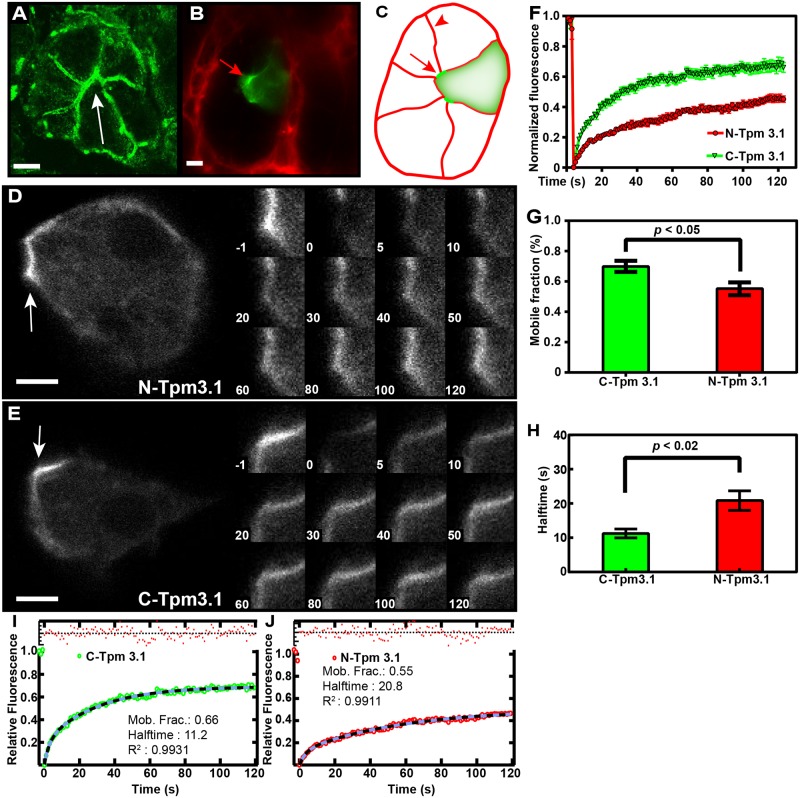
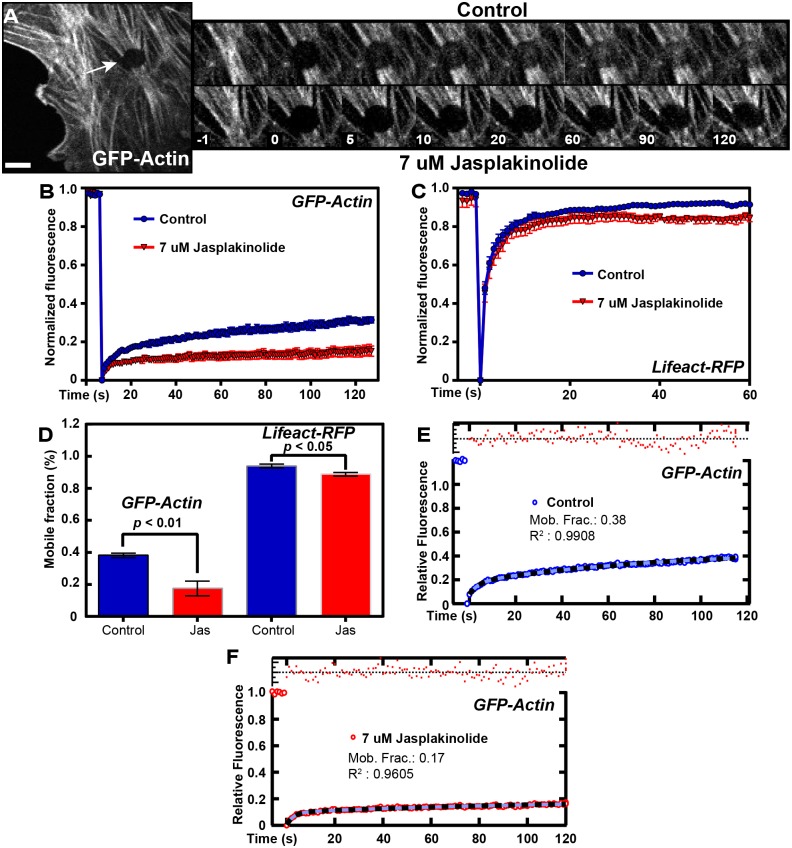
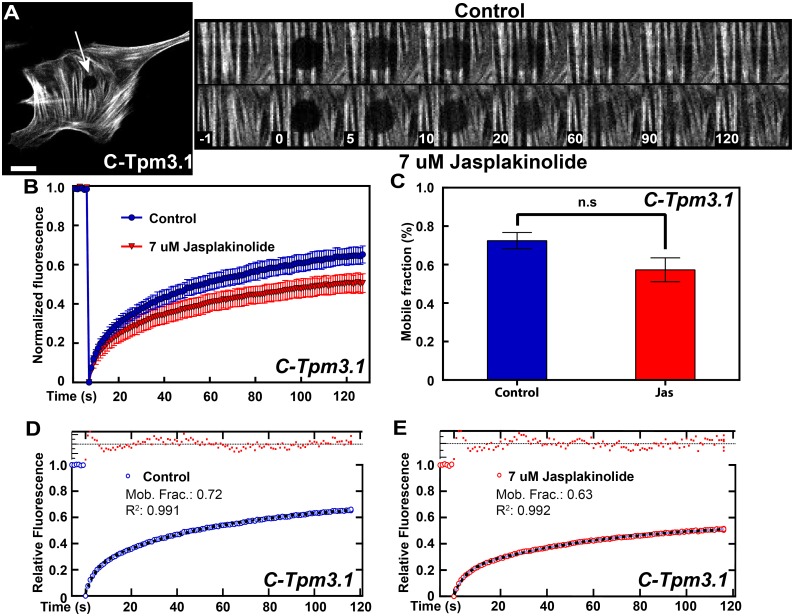
The actin cytoskeleton is a dynamic network of filaments that is involved in virtually every cellular process. Most actin filaments in metazoa exist as a co-polymer of actin and tropomyosin (Tpm) and the function of an actin filament is primarily defined by the specific Tpm isoform associated with it. However, there is little information on the interdependence of these co-polymers during filament assembly and disassembly. We addressed this by investigating the recovery kinetics of fluorescently tagged isoform Tpm3.1 into actin filament bundles using FRAP analysis in cell culture and in vivo in rats using intracellular intravital microscopy, in the presence or absence of the actin-targeting drug jasplakinolide. The mobile fraction of Tpm3.1 is between 50% and 70% depending on whether the tag is at the C- or N-terminus and whether the analysis is in vivo or in cultured cells. We find that the continuous dynamic exchange of Tpm3.1 is not significantly impacted by jasplakinolide, unlike tagged actin. We conclude that tagged Tpm3.1 may be able to undergo exchange in actin filament bundles largely independent of the assembly and turnover of actin.


Conflict of interest statement

PWG is a Director on the Board of Novogen, a company commercialising drugs that are directed against Tpm3.1. This does not alter our adherence to PLOS ONE policies on sharing data and materials.

Figures

Fig 1
Fig 1. N- and C-terminal tagged Tpm3.1 both localize to stress fibers in mouse embryo fibroblasts.
Tagged Tpm3.1 constructs were transfected into wild type and Tpm3.1/3.2 knockout mouse embryo fibroblasts (MEFs) and visualized by confocal microscopy (A and C) N-terminal tagged Tpm3.1 and (B and D) C-terminal Tpm3.1. Tpm3.1 was visualized using the CG3 antibody that recognises all isoforms from the TPM3 gene. (E) Western blot showing expression of the tagged Tpm3.1 constructs and endogenous Tpm 3.1 in primary wild type MEFs as detected by the CG3 antibody. Scale bar = 10 μm.
Fig 2
Fig 2. N- and C-terminal tagged Tpm3.1 constructs have similar mobile fractions but dissimilar recovery rates.
(A,B) Representative images of FRAP assay in MEFs transfected with either N- or C-Tpm3.1. FRAP zones (white arrows) were bleached and cells imaged at 1 fps for 2 min. (inset A,B). Enlarged images of FRAP zones over time (s). (C,D) FRAP curves of N- or C-Tpm3.1 transfected MEFs. (E) Half-times of N- and C-Tpm3.1 recovery (see also S1 Table). Data obtained from 6 experiments, 3–15 cells per experiment. Error bars are +/- SEM. Scale bars = 10 μm.
Fig 3
Fig 3. Intracellular intravital imaging of the kinetics of N- and C-terminal tagged Tpm3.1 constructs transfected into rat salivary gland acinar cells.
(A) Confocal image of an acinus from rat submandibular salivary gland section stained with anti-Tpm3.1 (2G10) antibody. Tpm3.1 is enriched on the apical plasma membranes that form the canaliculi of acinar cells (white arrow). (B) Confocal image of a C-Tpm3.1 transfected cell (arrow) in a single acinus of a rat salivary gland in situ. Extracellular space outside the acinus was stained with 10kDa dextran Alexa 647 conjugate. (C) Illustration of the transfected acinar cell in (B), arrow shows apical membrane/canaliculi, arrowhead shows basolateral membrane. (D,E) Intravital microscopy and FRAP analysis of N- and C-Tpm3.1 constructs in live transfected rats. Numbers indicate time in sec. White arrows indicate FRAP zones on the canaliculi of rat acinar cells. (F) FRAP curves for N- and C-Tpm3.1. (G) Mobile fraction of N- and C-Tpm3.1. (H) Half-times for N- and C-Tpm3.1. (I, J) Curve fits for N- and C-Tpm3.1. 11–16 cells assayed from at least 3 animals per construct (see also S2 Table). Error bars are +/- SEM. Scale bars = 5 μm.
Fig 4
Fig 4. The majority of actin in stress fibers is stable.
(A) Representative image and FRAP sequence of MEFs transfected with GFP-beta-actin. FRAP zone indicated by white arrow. Top panel: FRAP sequence of untreated control cells. Bottom panel: FRAP sequence after treatment with 7 μM jasplakinolide. (B) FRAP curves for GFP-actin in control and jasplakinolide treated condition. (C) FRAP curves for Lifeact-RFP in control and jasplakinolide treated condition. (D) Mobile fractions of control and drug treated GFP-actin and Lifeact-RFP (see also S3 and S4 Tables). (E) Curve fits for GFP-Actin control. (F) Curve fit for GFP-Actin treated with jasplakinolide. Data obtained from 3 separate experiments, 2–8 cells per experiment. Error bars are +/- SEM. Scale bars = 5 μm.
Fig 5
Fig 5. Tpm3.1 maintains constant and rapid cycling on stress fibers in the presence of jasplakinolide.
(A) Representative image and FRAP sequence of MEFs transfected with C-Tpm3.1. FRAP zone indicated by white arrow. Top panel: FRAP sequence of untreated control cells. Bottom panel: FRAP sequence after treatment with 7 μM jasplakinolide. (B) FRAP curves of C-Tpm3.1 in control and drug-treated conditions. (C) Mobile fraction of control and drug-treated condition (see also S5 Table). (D,E) Curve fits for C-Tpm3.1 in control (D) and drug-treated condition (E). Data obtained from 3 separate experiments, 3–8 cells per experiment. Error bars are +/- SEM. Scale bars = 10 μm.

References

    1. Gunning P, O'Neill G, Hardeman E. Tropomyosin-based regulation of the actin cytoskeleton in time and space. Physiological reviews. 2008;88(1):1–35. Epub 2008/01/16. 10.1152/physrev.00001.2007 - DOI - PubMed
    1. von der Ecken J, Muller M, Lehman W, Manstein DJ, Penczek PA, Raunser S. Structure of the F-actin-tropomyosin complex. Nature. 2015;519(7541):114–7. Epub 2014/12/04. 10.1038/nature14033 - DOI - PMC - PubMed
    1. Gunning PW, Hardeman EC, Lappalainen P, Mulvihill DP. Tropomyosin—master regulator of actin filament function in the cytoskeleton. Journal of cell science. 2015;128(16):2965–74. Epub 2015/08/05. 10.1242/jcs.172502 - DOI - PubMed
    1. Gunning PW, Schevzov G, Kee AJ, Hardeman EC. Tropomyosin isoforms: divining rods for actin cytoskeleton function. Trends in cell biology. 2005;15(6):333–41. Epub 2005/06/15. 10.1016/j.tcb.2005.04.007 - DOI - PubMed
    1. Johnson M, East DA, Mulvihill DP. Formins determine the functional properties of actin filaments in yeast. Current biology: CB. 2014;24(13):1525–30. Epub 2014/06/24. 10.1016/j.cub.2014.05.034 - DOI - PubMed