. 2016 Dec 15;12(12):e1006072.
doi: 10.1371/journal.ppat.1006072. eCollection 2016 Dec.

Peptide Processing Is Critical for T-Cell Memory Inflation and May Be Optimized to Improve Immune Protection by CMV-Based Vaccine Vectors

Affiliations

Peptide Processing Is Critical for T-Cell Memory Inflation and May Be Optimized to Improve Immune Protection by CMV-Based Vaccine Vectors

Iryna Dekhtiarenko et al. PLoS Pathog. .

Abstract

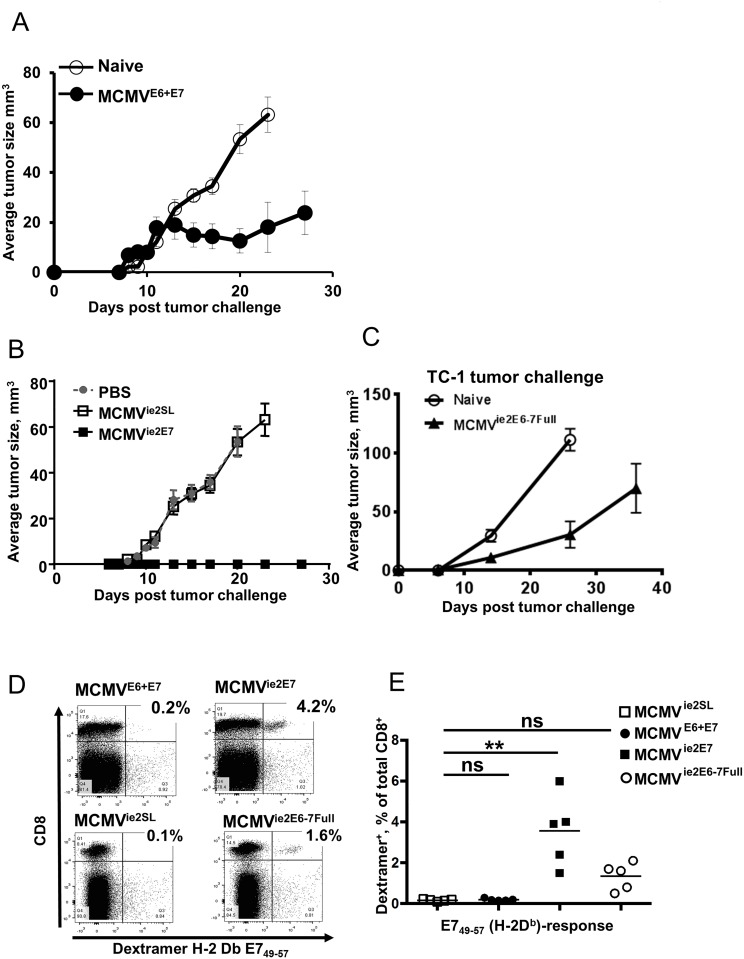
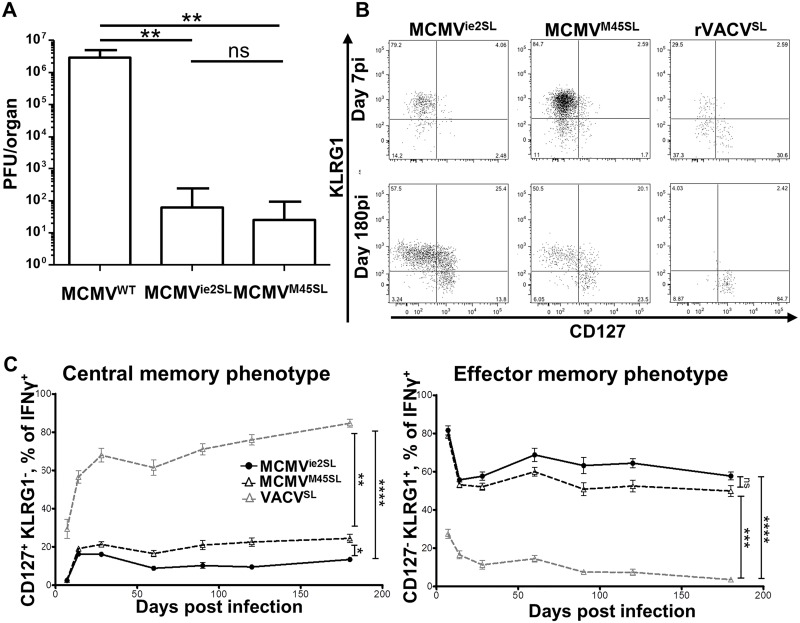
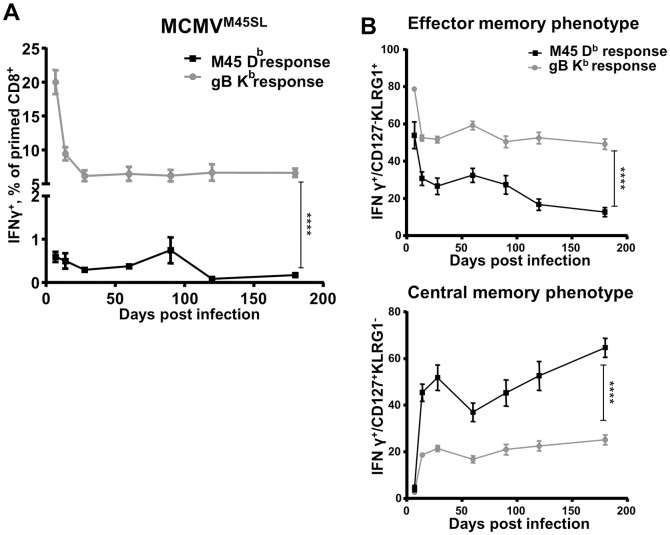
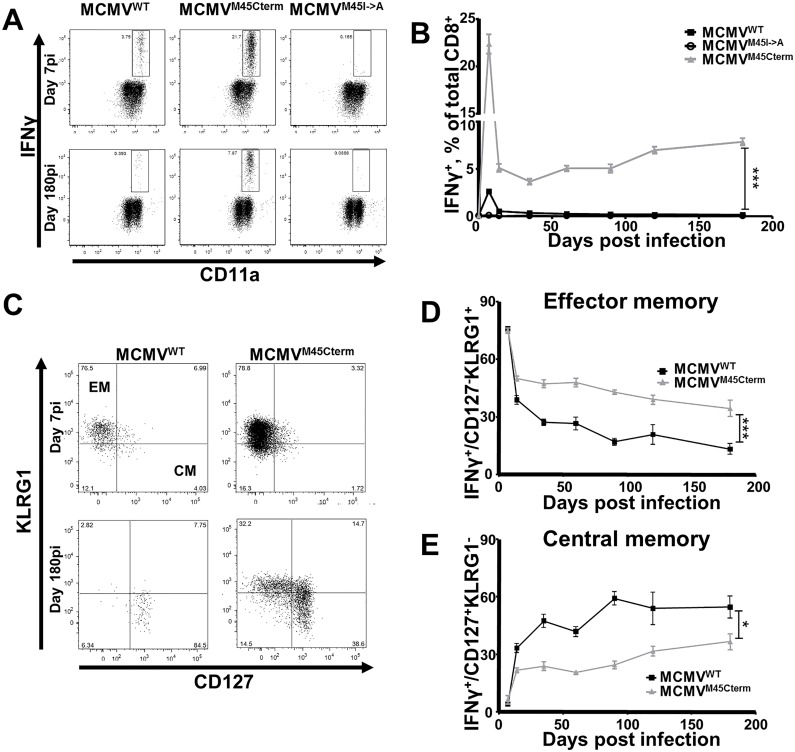
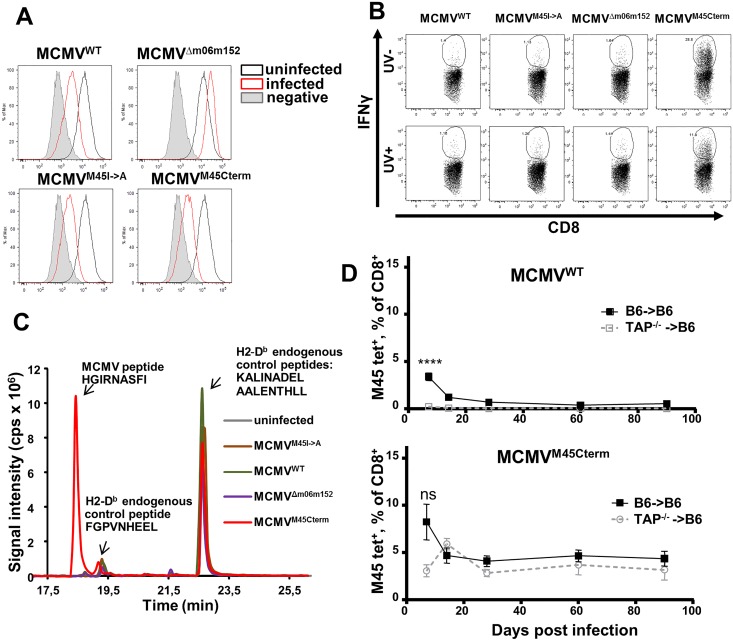
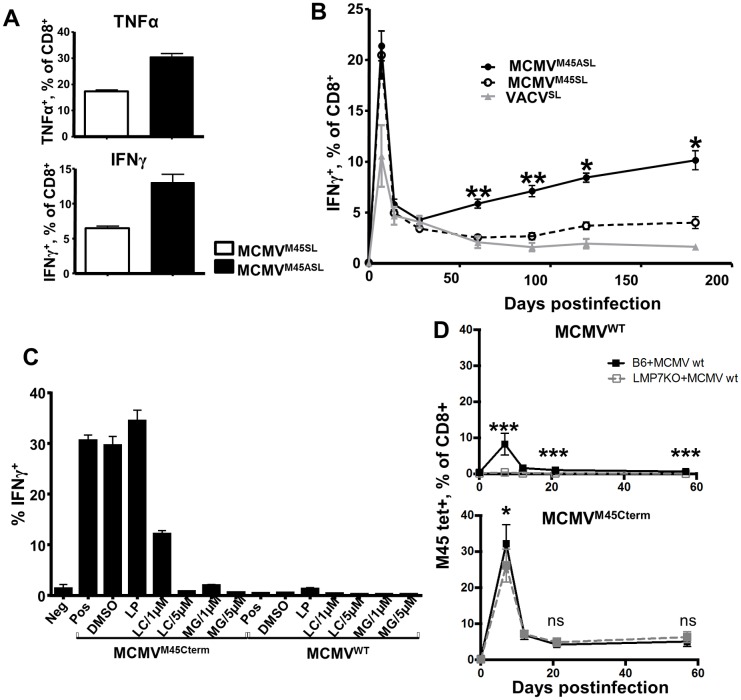
Cytomegalovirus (CMV) elicits long-term T-cell immunity of unparalleled strength, which has allowed the development of highly protective CMV-based vaccine vectors. Counterintuitively, experimental vaccines encoding a single MHC-I restricted epitope offered better immune protection than those expressing entire proteins, including the same epitope. To clarify this conundrum, we generated recombinant murine CMVs (MCMVs) encoding well-characterized MHC-I epitopes at different positions within viral genes and observed strong immune responses and protection against viruses and tumor growth when the epitopes were expressed at the protein C-terminus. We used the M45-encoded conventional epitope HGIRNASFI to dissect this phenomenon at the molecular level. A recombinant MCMV expressing HGIRNASFI on the C-terminus of M45, in contrast to wild-type MCMV, enabled peptide processing by the constitutive proteasome, direct antigen presentation, and an inflation of antigen-specific effector memory cells. Consequently, our results indicate that constitutive proteasome processing of antigenic epitopes in latently infected cells is required for robust inflationary responses. This insight allows utilizing the epitope positioning in the design of CMV-based vectors as a novel strategy for enhancing their efficacy.


Conflict of interest statement

The authors declare the following competing financial interest: Oregon Health and Science University (OHSU) and KF have a significant financial interest in TomegaVax Inc., a company that may have a commercial interest in the results of this research and technology. LCS was a paid consultant of Tomegavax in 2015. This potential individual and institutional conflict of interest has been reviewed and managed by OHSU. RBR and CM have been employed by TomegaVax, Inc., a commercial company. The authors declare that there are no further financial interests.

Figures

Fig 1
Fig 1. Immune protection by C-terminal epitope localization in a CMV vaccine vector.
(A-C) Mice were prime/boosted at 4 weeks intervals with recombinant MCMVs or control virus and challenged with 2.5x10⁴ TC-1 cells/mouse at least 10 weeks after priming. Tumor size measured by caliper (mean +/- SEM is shown). (A) Immunization was performed with 106 PFU of MCMVE6+E7 (n = 9) and tumor growth compared to unvaccinated (naïve) controls (n = 10) (B) Mice were immunized with 105 PFU of MCMVie2E7, and compared to MCMVie2SL or PBS control (n = 10 in each group) (C) Mice were prime/boosted with 105 PFU of MCMVieE6-7Full (n = 9) and compared to unvaccinated controls (n = 12) (D) Representative flow cytometry plots of dextramer-stained blood lymphocytes from mice infected with 105 PFU of MCMVE6+E7, MCMVie2E7, MCMVie2E6-7Full or MCMVie2SL and analyzed by D(b) E749-57 dextramer staining for the presence of E7-specific CD8 T cells at 21 weeks post-priming. (E) Group values from dextramer staining as in panel D are shown (each symbol is a mouse; horizontal line shows the median). Significance was assessed by Kruskal—Wallis test followed by Dunn’s post hoc analysis for indicated columns. **p < 0.01, ns—not significant.
Fig 2
Fig 2. Peptide C-terminal localization results in better protection and induction of effector memory CD8 T-cell response.
(A) 129Sv female mice were i.p. infected with 2x10⁵ PFU MCMVWT, MCMVie2SL or MCMVM45SL (n = 10 in each group) and 8 months later challenged with 106 PFU of VACVSL. Seven days post challenge, ovaries were titrated for infectious vaccinia by plaque assay. Histograms show group means, error bars are standard deviations. Significance was assessed by Kruskal—Wallis test followed by Dunn’s post hoc analysis for indicated columns. **p < 0.01, ns—not significant. (B-C) 129/Sv mice were infected intraperitoneally (i.p.) with 2x10⁵ PFU of MCMVie2SL, MCMVM45SL or 106 PFU of VACVSL. Blood leukocytes were stimulated with the SSIEFARL peptide at 7, 14, 28, 60, 90, 120, 180 dpi. Cells were surface-stained for CD3, CD4, CD8, CD11a, CD44, KLRG1, CD127 and intracellularly for IFNγ expression and analyzed by flow cytometry. (B) Representative dot plots of KLRG1 and CD127 expression in IFNγ producing cells upon 6h SSIEFARL in vitro re-stimulation on days 7 and 180 p.i‥ (C) Left graph—epitope specific cells with the CM phenotype (CD127+KLRG1-). Right graph—epitope specific cells with the EM phenotype (CD127-KLRG1+). The experiment was performed three times independently, at 5 mice per group in each experiment, and grouped averages +/- SEM from all three experiments are shown. Significance on day 180 p.i. was assessed by Kruskal—Wallis test followed by Dunn’s post hoc analysis. *p<0.05, **p < 0.01, ***p < 0.001, ****p < 0.0001, ns—not significant.
Fig 3
Fig 3. Gene expression context does not define the quality of CD8 responses to MHC-I restricted epitopes of MCMV.
129/Sv mice were infected intraperitoneally (i.p.) with 2x10⁵ PFU of MCMVM45SL. Blood leukocytes were stimulated with the SSIEFARL or the HGIRNASFI peptide at 7, 14, 28, 60, 90, 120, 180 dpi. Cells were surface-stained for CD3, CD4, CD8, CD11a, CD44, KLRG1, CD127 and intracellularly for IFNγ expression and analyzed by flow cytometry. (A) Cells responding to the SSIEFARL (gB Kb response) or the HGIRNASFI (M45Db response) peptide. (B) Upper graph—epitope specific cells with the EM phenotype (CD127-KLRG1+). Lower graph—epitope specific cells with the CM phenotype (CD127+KLRG1-). The experiment was performed three times independently, at 5 mice per group in each experiment, and grouped averages +/- SEM from all three experiments are shown. Significance on day 180 p.i. was assessed by a Mann—Whitney U test. ****p < 0.0001.
Fig 4
Fig 4. Epitope localization defines the quality of CD8 T-cell responses.
(A) Representative dot plots of intracellular IFNγ expression at 7 and 180 dpi upon HGIRNASFI peptide stimulation. (B) Grouped means +/- SEM of cells responding to the HGIRNASFI peptide at 7, 14, 28, 60, 90, 120, 180 dpi. (C) Representative dot plots of the surface expression of CD127 and KLRG1 on HGIRNASFI specific CD8 T cells at 7 and 180 dpi with MCMVWT or MCMVM45Cterm. The staining was used to define the CM (CD127+KLRG1-) and the EM (CD127-KLRG1+) subsets. (D, E) Grouped means +/- SEM of the percentage of EM (D) or CM (E) cells in the HGIRNASFI-responding subset at indicated time points p.i‥ The experiment was performed twice, at 5 mice per group in each experiment, and pooled results are shown. Significance on day 180 p.i. was assessed by a Mann—Whitney U test. *p<0.05, ***p < 0.001.
Fig 5
Fig 5. C-terminal localization of the HGIRNASFI peptide allows its presentation on the surface of infected cells.
(A) Cell surface expression of MHC class I molecule (Db). LSECs (C57BL/6) were infected with the indicated viruses at MOI of 5 with centrifugal enhancement as described. Db expression was measured by flow cytometry at 16h p.i‥ Fluorescence histograms for a representative experiment are shown. (B) LSECs were infected with the indicated viruses or incubated with a corresponding dose of UV inactivated virus (UV dose– 150J) at an MOI of 0.2 with centrifugal enhancement and co-cultured with HGIRNASFI-specific CTLs at an E:T ratio 3:1. Co-culture was performed for 15h, upon which the T cells were collected and stained for intracellular IFNγ. Where indicated, virus was inactivated by UV light. Two independent experiments were performed, with 4 or 5 wells per experimental condition. Representative dot plots are shown. (C) Relative intensity of signals measured by targeted nanoLC-MS3 from Db-immunoprecipitates of cells infected for 24 hours with indicated viruses at an MOI of 2 with centrifugal enhancement. Two high abundant endogenous control peptides (KALINADEL and AALENTHLL) and a low abundant (FGPVNHEEL) endogenous control peptide were present in all IP samples, indicating valid sample processing in all cases. The MCMV target peptide HGIRNASFI was detected only in the cells infected with the MCMVM45Cterm recombinant. (D) Grouped means +/- SEM of blood CD8 T-cells stained by HGIRNASFI-Db tetramers in bone-marrow chimeric mice, where C57BL/6 mice received TAP-/- or C57BL/6 bone marrow at 3 months before infection with 106 PFU/mouse of MCMVWT (top panel) or MCMVM45Cterm (bottom panel). The experiment was performed three times at 5 mice per group and pooled results are shown. Significance on day 7 p.i. was assessed by a Mann—Whitney U test. ****p < 0.0001, ns—not significant.
Fig 6
Fig 6. Constitutive proteasomal processing is critical for the induction of inflationary CD8 T-cell responses.
(A) IC-21 cells were infected with indicated viruses at an MOI of 0.2 with centrifugal enhancement. Splenocytes obtained from gBT-I.1 mice were used as effector cells at an E:T ratio of 3:1. Splenocytes were not restimulated upon isolation from the mice and used untouched for the assay. Co-culture was performed overnight (15h). Columns represent the mean percentage of IFNγ+ or TNFα+ cells from triplicate experiments, and error bars show the SEM. (B) 129/Sv mice were infected intraperitoneally (i.p.) with 2x10⁵ PFU of indicated MCMV recombinants and 106 PFU of VACVSL. Blood of mice was analysed for the fraction of CD8 T cells responding to in vitro re-stimulation with the SSIEFARL peptide for 6 hours, followed by intracellular staining for IFNγ. Grouped means +/- SEM of cells responding to the SSIEFARL peptide at 7, 14, 28, 60, 90, 120, 180 dpi are shown. The experiment was performed two times independently, at 5 mice per group in each experiment, and grouped averages from two experiments are shown. Difference in responses between groups infected with either MCMVM45SL or MCMVM45ASL was identified. Significance was assessed by Kruskal-Wallis test followed by Dunns post-analysis for MCMVM45SL and MCMVM45ASL infected mice (*p<0.05, **p<0.01). (C) Treatment with proteasomal inhibitors (but not protease inhibitors) impairs target cell recognition by HGIRNASFI-specific CTL. Target cells (LSECs) were pretreated for 5h with indicated inhibitors, washed twice with PBS and infected with MCMVWT or MCMVM45Cterm at an MOI 0.2 with centrifugal enhancement. Co-culture with HGIRNASFI-specific CTLs was performed at an E:T ratio 3:1 for 15h, upon which the T cells were collected and stained for intracellular IFNγ. The y-axis shows percentages of CTL responding by IFNγ to co-culture with target cells (mean +/- SEM from three experiments is shown). Labels below the x-axis show the deployed inhibitor and its concentration in μM; LC—lactacystin, MG—MG132, LP—leupeptin; Pos–positive control, target cells infected with indicated viruses without pretreatment with inhibitors; DMSO—infection in presence of the diluent for inhibitors Neg–negative control, untreated cells. (D) LMP7-/- and C57BL/6 adult mice were infected i.v. with 105 PFU of MCMVWT (top panel) or MCMVM45Cterm (bottom panel). The percentage of blood CD8 T cells stained by HGIRNASFI-Db tetramers was measured at the indicated time points. The data show the mean values +/- SD from of pooled results from 2 independent experiments (in total 8 mice per each group) Significance on indicated time points was assessed by a Mann—Whitney U test. *p < 0.05. ***p < 0.0001, ns—not significant.

References

    1. Sylwester AW, Mitchell BL, Edgar JB, Taormina C, Pelte C, Ruchti F, et al. Broadly targeted human cytomegalovirus-specific CD4+ and CD8+ T cells dominate the memory compartments of exposed subjects. J Exp Med. 2005;202(5):673–85. 10.1084/jem.20050882 - DOI - PMC - PubMed
    1. O'Hara GA, Welten SP, Klenerman P, Arens R. Memory T cell inflation: understanding cause and effect. Trends in immunology. 2012;33(2):84–90. 10.1016/j.it.2011.11.005 - DOI - PubMed
    1. Klenerman P, Oxenius A. T cell responses to cytomegalovirus. Nature reviews Immunology. 2016. - PubMed
    1. Komatsu H, Sierro S, A VC, Klenerman P. Population analysis of antiviral T cell responses using MHC class I-peptide tetramers. Clinical and experimental immunology. 2003;134(1):9–12. 10.1046/j.1365-2249.2003.02266.x - DOI - PMC - PubMed
    1. Cicin-Sain L, Sylwester AW, Hagen SI, Siess DC, Currier N, Legasse AW, et al. Cytomegalovirus-specific T cell immunity is maintained in immunosenescent rhesus macaques. Journal of immunology. 2011;187(4):1722–32. - PMC - PubMed

MeSH terms