Review
. 2017 Mar;26(3):414-435.
doi: 10.1002/pro.3095. Epub 2017 Feb 23.

The accommodation index measures the perturbation associated with insertions and deletions in coiled-coils: Application to understand signaling in histidine kinases

Affiliations
Review

The accommodation index measures the perturbation associated with insertions and deletions in coiled-coils: Application to understand signaling in histidine kinases

Nathan W Schmidt et al. Protein Sci. 2017 Mar.

Abstract

Coiled-coils are essential components of many protein complexes. First discovered in structural proteins such as keratins, they have since been found to figure largely in the assembly and dynamics required for diverse functions, including membrane fusion, signal transduction and motors. Coiled-coils have a characteristic repeating seven-residue geometric and sequence motif, which is sometimes interrupted by the insertion of one or more residues. Such insertions are often highly conserved and critical to interdomain communication in signaling proteins such as bacterial histidine kinases. Here we develop the "accommodation index" as a parameter that allows automatic detection and classification of insertions based on the three dimensional structure of a protein. This method allows precise identification of the type of insertion and the "accommodation length" over which the insertion is structurally accommodated. A simple theory is presented that predicts the structural perturbations of 1, 3, 4 residue insertions as a function of the length over which the insertion is accommodated. Analysis of experimental structures is in good agreement with theory, and shows that short accommodation lengths give rise to greater perturbation of helix packing angles, changes in local helical phase, and increased structural asymmetry relative to long accommodation lengths. Cytoplasmic domains of histidine kinases in different signaling states display large changes in their accommodation lengths, which can now be seen to underlie diverse structural transitions including symmetry/asymmetry and local variations in helical phase that accompany signal transduction.

Keywords: coiled-coil; heptad repeat; histidine kinase; protein design; protein structure analysis; theory.


Figures

Figure 1
Figure 1
Histidine kinases with direct HAMP‐S—helix‐DHp connections contain a conserved single residue insertion. A. Average hydrophobicity at each residue position along the backbone consisting of the second helix from the HAMP and the first helix from the DHp. In both domains the a and d positions (labeled above) of the heptad repeats are clearly visible. The position with an asterisk indicates a residue position on the DHp that is important for response regulator recognition and binding.67 B. The corresponding sequence logo for the backbone showing the conserved positions. C. Structure of the HAMP‐S‐helix‐DHp region from the histidine kinase A291F AF1503‐EnvZ. The backbone is colored in rainbow, and the conserved histidine is shown as a space‐filled model in grey.
Figure 2
Figure 2
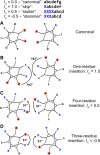
The most common types of residue insertions in coiled‐coil sequences. A. Canonical coiled‐coil heptad sequence displayed on the heptad wheel. B. A one‐residue insertion produces a 103° clockwise rotation of the residue positions following the insertion relative to their expected positions if no insertion had occurred. Realigning the a and d core residue positions requires a net −103° helical phase change within the coiled‐coil structure (arrow) relative to the canonical structure. Four‐residue insertions, C, and three‐residue insertions, D, produce 51° clockwise and 51° counterclockwise rotations of the following residue positions, respectively. These insertions are accommodated by opposite, net equivalent changes in helical phase within the coiled‐coil structure.
Figure 3
Figure 3
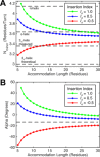
Minorhelical pitch, N minor, and superhelical pitch angle, α, for different residue insertions in coiled‐coils over a range of accommodation lengths. A. Theoretical N minor calculated using Eq. (4) for one‐residue insertions (I A = 1.0, green), three‐residue insertions (I A = −0.5, red), and four‐residue insertions (I A = 0.5, blue). Horizontal dashes lines show N minor for α−, π‐, and 310‐ helices for comparison. B. Theoretical α for coiled‐coils with insertions in accommodation regions of different lengths. Values are calculated using Eqs. (1)–(4) with superhelical radius, R 0 = 4.9 Å, rise per residue, d = 1.50 Å, and α‐helical pitch, N α = 3.60 residues/turn. The Alpha for a regular coiled‐coil (dashed line) uses N minor = 3.5 residues/turn.
Figure 4
Figure 4
Accommodation index plots identify insertions in coiled‐coil structures and their corresponding accommodation regions. Coiled‐coils with I A = 0.0, (A), I A = 1.0, (B), I A = 0.5, (C), and I A = −0.5, (D), insertion indexes. The accommodation region is each structure is colored red, while the canonical region is blue. E–F. The AI profiles calculated from the structures above. The graphs show the AI profile data points measured from each chain in the coiled‐coil structure (lines with circle markers), as well as the corresponding fits of each AI profile (lines only).
Figure 5
Figure 5
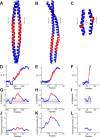
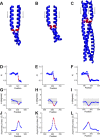
I A = 1.0 coiled‐coils. Crystal structures of (A), the coiled‐coil surrounding the second skip in myosin‐7 (PDB ID: 4xa3), (B), the coiled‐coil domain from the Sec2p protein (PDB ID: 2eqb), and (C), a coiled‐coil in symetherin (PDB ID: 3qhc). Accommodation index plots for (D), myosin‐7, (E), Sec2p, and (F), symetherin. The plots are shown for both chains in the structure (lines with circle markers), and the corresponding fits of the accommodation index plots (lines only). (G–I) are plots of α determined by structural fits of the same region to the Crick equations, for myosin‐7, Sec2p, and symetherin, respectively, and (J–L) show their asymmetry index plots. Residue position corresponds to the first position in the seven‐residue window. Grey region in the α plots show the distribution of values from 243 two‐chain canonical coiled‐coils (median ± twice the population standard deviation). The areas where the accommodation index plot changes are indicated by blue to red color changes in the structure and plots.
Figure 6
Figure 6
I A = 0.5 coiled‐coils. Crystal structures of (A), the coiled‐coil domain from Huntigtin‐Interacting Protein (HIP1) (PDB ID: 2qa7), (B), keratin 5 and keratin 14 intermediate filament protein heterocomplex (PDB ID: 3tnu), (C), the coiled‐coil domain of Nuclear Distribution Protein Nude‐like 1 (Nudel) (PDB ID: 2v71). (D–F), Their accommodation index plots. Data are plotted for both chains in the structure (lines with circle markers), along with their fits (lines only). (G–I), are plots of α from the structural fits to the Crick equations for HIP1, the keratin heterocomplex, and Nudel, respectively, and (J–L) show their asymmetry plots. Plot format is identical to Figure 5.
Figure 7
Figure 7
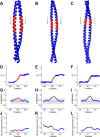
I A = −0.5 coiled‐coils. Crystal structures of (A), and (B), coiled‐coils from Drosophila PAN3 pseudokinase (PDB ID: 4bwk and 4bwp), and (C), a trimeric autotransporter adhesion (TAA) fragment from Actinobacillus (PDB ID: 5app). (D–F), are their corresponding accommodation index plots. (G–I), are plots of α from structural fits over the same region with the Crick equations for the PAN3 pseudokinases, and TAA fragment, respectively, and (J–L) show their asymmetry plots. Plot format is identical to Figure 5.
Figure 8
Figure 8
Comparison of the model with coiled‐coil structures. (A) The average value of N minor from the accommodation region in coiled‐coils with I A = 1.0 (green), 0.5 (blue), and −0.5 (red) insertion indexes versus the measured accommodation lengths, L A. Data from coiled‐coil structures are plotted as circles. The lines represent the theoretical value of N minor for coiled‐coils with given I A and L A, as determined by Eq. (4). (B) Bar graphs of the average accommodation length, L A, within the accommodation region for two‐chain (left) and three‐chain (right) coiled‐coils with I A = 0.5, 1.0, and −0.5. (C) The average superhelical pitch angle within the accommodation region for two‐ and three‐chain coiled‐coils. Average α from two‐chain and three‐chain canonical coiled‐coils, I A = 0.0, are plotted for comparison. (D) Average coiled‐coil asymmetry index ratio for two‐chain and three‐chain coiled‐coils with I A = 0.5, 1.0, −0.5. The ratio is the quotient of the maximum RMSD value in the accommodation region and the average RMSD value outside of the accommodation region; a ratio of 1 (black line) indicates equal bundle asymmetry within and outside of the accommodation region.
Figure 9
Figure 9
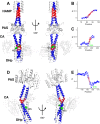
Coiled‐coils linking domains in histidine kinases have conserved insertions. (A) VicK histidine kinase with HAMP‐link1‐PAS‐link2‐DHp domain arrangement (PDB ID: 4i5s). (B) The accommodation index plot for the short coiled‐coil HAMP‐link1, indicating an I A = 0.5 insertion. (C) The accommodation index plot for the link2‐DHp coiled‐coil. An I A = 0.5 insertion is also observed. (D) Structure of the YF1 fusion histidine kinase (PDB ID: 4gcz). (E) The accommodation index plot for the coiled‐coil connecting the PAS and DHp in YF1 identifies an I A = −0.5 insertion. Both chains are plotted (lines with circle markers) as well as their fits (lines only) in the AI profiles, and the vertical arrows show the location of the catalytic histidine. The dimerization backbones in the HK structures are colored to match their plots, and the histidine is shown in green as a space‐filling model. HK structures are shown in two different orientations to display differences in their coiled‐coil backbones.
Figure 10
Figure 10
CpxA histidine kinase structures have I A = 1.0 and different accommodation lengths. (A) Structure of the cytoplasmic region of CpxA in a Michaelis complex (PDB ID: 4biv). (B) The AI profiles for the two backbone chains of CpxA histidine kinase structure shown in A. Both chains are plotted (lines with circle markers) as well as their fits (lines only). (C) CpxA structure of the ADP‐bound resting state structure (PDB ID: 4biu chains c + d). (D) The corresponding AI profiles and fits. The arrow in both plots identifies the histidine at position 248. The dimerization backbone in the HK structures are colored to match their plots, and the histidine is shown in green as a space‐filling model. HK structures are shown in two different orientations to highlight structural differences in their coiled‐coil backbones.
Figure 11
Figure 11
Variable accommodation lengths enable conformational switching in CpxA. (A) Kinase state structure of CpxA in a Michaelis complex shown from the side (left) and top (right) views. (B) ADP‐bound resting state structure of CpxA. Helices in the HAMP, S‐helix, and DHp are shown as cylinders, as is the “gripper helix” in the CA domain. The helical backbone extending from the top of the HAMP to the base of the DHp is colored to distinguish the region accommodating the I A = 1.0 insertion (red) from areas with regular coiled‐coil geometry (blue).
Figure 12
Figure 12
Distinct AF1503‐EnvZ fusion histidine kinase structures have different accommodation lengths. (A) Structure of the WT AF1503‐EnvZ histidine kinase (PDB ID: 3zrx). (B) Accommodation index plots for the kinase active WT AF1503‐EnvZ histidine kinase showing the measured AI profiles (lines with circle markers) and fits (lines only) for both coiled‐coil backbones in the structure. (C) Structure of the inactive A291F AF1503‐EnvZ histidine kinase (PDB ID: 3zrv), and (D) its AI profile. The arrow in the plots identifies the histidine at position 342. The dimerization backbone in the HK structures are colored to match their plots, and the histidine is shown in green as a space‐filling model. The HK structures are shown in two different orientations to display differences in their coiled‐coil backbones, which are striking.
Figure 13
Figure 13
Variable accommodation lengths have multiple effects on HK structures. (A) Structures of the kinase inactive AF1503‐EnvZ histidine kinase (left) and kinase active WT AF1503‐EnvZ histidine kinase (right), along with core residues in different positions along their helical backbones (center). The different accommodation lengths in phosphatase and kinase active structures produce differences in superhelical radius, R 0, helical phase, ϕ 1, and vertical displacement, Z offset, along the helical backbone, which are most pronounced within the accommodation region (pink boxes), as compared with places outside the accommodation region, including within the HAMP (yellow boxes) and DHp (peach boxes). (B) The difference in minor helical phase between the kinase active WT AF1503‐EnvZ HK and the kinase inactive A291F mutant HK.

Similar articles

Cited by

References

    1. Lupas A (1996) Coiled‐coils: new structures and new functions. Trends Biochem Sci 21:375–382. - PubMed
    1. Liu J, Rost B (2001) Comparing function and structure between entire proteomes. Protein Sci 10:1970–1979. - PMC - PubMed
    1. Cohen C, Parry DAD (1990) a‐Helical coiled‐coils and bundles: how to design an a‐helical protein. Proteins 7:1–15. - PubMed
    1. Weissenhorn W, Dessen A, Calder LJ, Harrison SC, Skehel JJ, Wiley DC (1999) Structural basis for membrane fusion by enveloped viruses. Mol Membr Biol 16:3. - PubMed
    1. Dutch RE, Jardetzky TS, Lamb RA (2000) Virus membrane fusion proteins: biological machines that undergo a metamorphosis. Biosci Rep 20:597–612. - PubMed

Publication types

MeSH terms