Declining Prevalence of Hearing Loss in US Adults Aged 20 to 69 Years
- PMID: 27978564
- PMCID: PMC5576493
- DOI: 10.1001/jamaoto.2016.3527
Declining Prevalence of Hearing Loss in US Adults Aged 20 to 69 Years
Abstract
Importance: As the US population ages, effective health care planning requires understanding the changes in prevalence of hearing loss.
Objective: To determine if age- and sex-specific prevalence of adult hearing loss has changed during the past decade.
Design, setting, and participants: We analyzed audiometric data from adults aged 20 to 69 years from the 2011-2012 cycle of the US National Health and Nutrition Examination Survey, a cross-sectional, nationally representative interview and examination survey of the civilian, noninstitutionalized population, and compared them with data from the 1999-2004 cycles. Logistic regression was used to examine unadjusted, age- and sex-adjusted, and multivariable-adjusted associations with demographic, noise exposure, and cardiovascular risk factors. Data analysis was performed from April 28 to June 3, 2016.
Interventions: Audiometry and questionnaires.
Main outcomes and measures: Speech-frequency hearing impairment (HI) defined by pure-tone average of thresholds at 4 frequencies (0.5, 1, 2, and 4 kHz) greater than 25 decibels hearing level (HL), and high-frequency HI defined by pure-tone average of thresholds at 3 frequencies (3, 4, and 6 kHz) greater than 25 decibels HL.
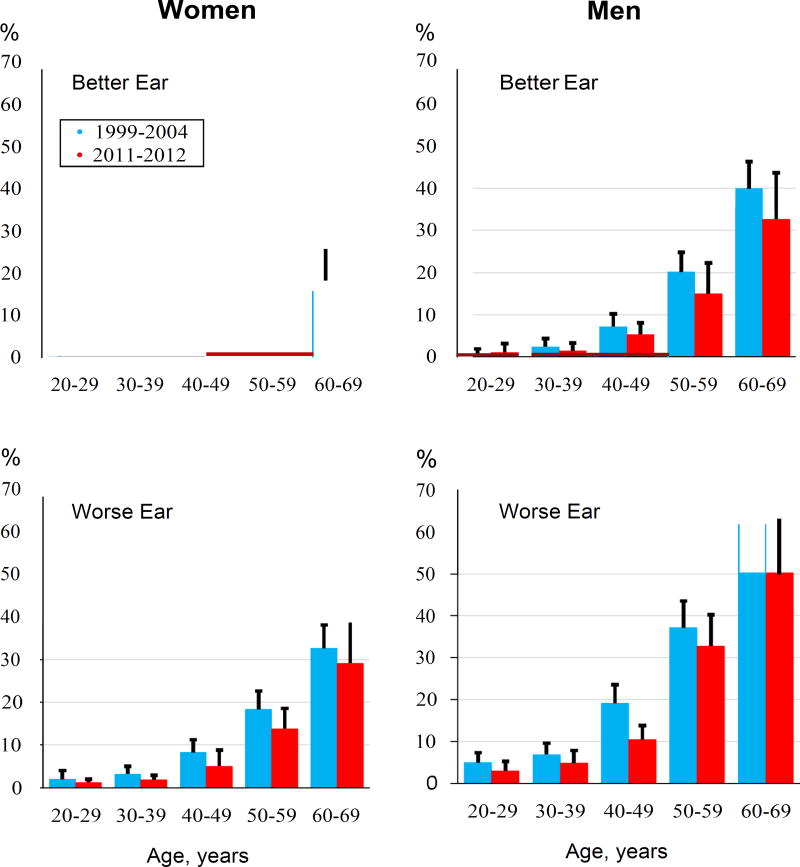
Results: Based on 3831 participants with complete threshold measurements (1953 men and 1878 women; mean [SD] age, 43.6 [14.4] years), the 2011-2012 nationally weighted adult prevalence of unilateral and bilateral speech-frequency HI was 14.1% (27.7 million) compared with 15.9% (28.0 million) for the 1999-2004 cycles; after adjustment for age and sex, the difference was significant (odds ratio [OR], 0.70; 95% CI, 0.56-0.86). Men had nearly twice the prevalence of speech-frequency HI (18.6% [17.8 million]) as women (9.6% [9.7 million]). For individuals aged 60 to 69 years, speech-frequency HI prevalence was 39.3% (95% CI, 30.7%-48.7%). In adjusted multivariable analyses for bilateral speech-frequency HI, age was the major risk factor (60-69 years: OR, 39.5; 95% CI, 10.5-149.4); however, male sex (OR, 1.8; 95% CI, 1.1-3.0), non-Hispanic white (OR, 2.3; 95% CI, 1.3-3.9) and non-Hispanic Asian race/ethnicity (OR, 2.1; 95% CI, 1.1-4.2), lower educational level (less than high school: OR, 4.2; 95% CI, 2.1-8.5), and heavy use of firearms (≥1000 rounds fired: OR, 1.8; 95% CI, 1.1-3.0) were also significant risk factors. Additional associations for high-frequency HI were Mexican-American (OR, 2.0; 95% CI, 1.3-3.1) and other Hispanic race/ethnicity (OR, 2.4; 95% CI, 1.4-4.0) and the combination of loud and very loud noise exposure occupationally and outside of work (OR, 2.4; 95% CI, 1.4-4.2).
Conclusions and relevance: Adult hearing loss is common and associated with age, other demographic factors (sex, race/ethnicity, and educational level), and noise exposure. Age- and sex-specific prevalence of HI continues to decline. Despite the benefit of delayed onset of HI, hearing health care needs will increase as the US population grows and ages.
Conflict of interest statement
Figures
Comment in
-
The Reduction in the Age-Adjusted Prevalence of Hearing Impairment in the United States-Reply.JAMA Otolaryngol Head Neck Surg. 2017 Sep 1;143(9):957-958. doi: 10.1001/jamaoto.2017.0687. JAMA Otolaryngol Head Neck Surg. 2017. PMID: 28617915 No abstract available.
-
The Reduction in the Age-Adjusted Prevalence of Hearing Impairment in the United States: An Unexpected Dividend of Phasing Out Leaded Gasoline?JAMA Otolaryngol Head Neck Surg. 2017 Sep 1;143(9):956-957. doi: 10.1001/jamaoto.2017.0684. JAMA Otolaryngol Head Neck Surg. 2017. PMID: 28617924 No abstract available.
References
-
- Hoffman HJ, Dobie RA, Ko C-W, Themann CL, Murphy WJ. Americans hear as well or better today compared with 40 years ago: Hearing threshold levels in the unscreened adult population of the United States, 1959–1962 and 1999–2004. Ear Hear. 2010;31:725–734. - PubMed
-
- Curtin LR, Mohadjer LK, Dohrmann SM, et al. The National Health and Nutrition Examination Survey: Sample Design, 1999–2006. Vol. 155. Hyattsville, MD: U.S. Department of Health and Human Services, Centers for Disease Control and Prevention, National Center for Health Statistics; May, 2012. pp. 1–39. DHHS Publication No. (PHS) 2012–1355, Series 2. - PubMed
-
- Centers for Disease Control and Prevention (CDC), National Center for Health Statistics (NCHS) National Health and Nutrition Examination Survey: NHANES 2011–2012 Overview. [Accessed May 23, 2016]; http://www.cdc.gov/nchs/nhanes/nhanes2011-2012/overview_g.htm.
-
- American National Standards Institute (ANSI) ANSI S3.1–1991. New York, NY: ANSI; 1991. Maximum permissible ambient noise levels for audiometric test rooms.
-
- American National Standards Institute (ANSI) ANSI S3.1–1999. New York, NY: ANSI; 1999. Maximum permissible ambient noise levels for audiometric test rooms.
Publication types
MeSH terms
Grants and funding
LinkOut - more resources
Full Text Sources
Other Literature Sources
Research Materials
Miscellaneous