. 2017 Jan:207:115-122.
doi: 10.1016/j.jss.2016.08.074. Epub 2016 Aug 31.

A method for evaluating the murine pulmonary vasculature using micro-computed tomography

Affiliations

A method for evaluating the murine pulmonary vasculature using micro-computed tomography

Michael R Phillips et al. J Surg Res. 2017 Jan.

Abstract

Background: Significant mortality and morbidity are associated with alterations in the pulmonary vasculature. While techniques have been described for quantitative morphometry of whole-lung arterial trees in larger animals, no methods have been described in mice. We report a method for the quantitative assessment of murine pulmonary arterial vasculature using high-resolution computed tomography scanning.

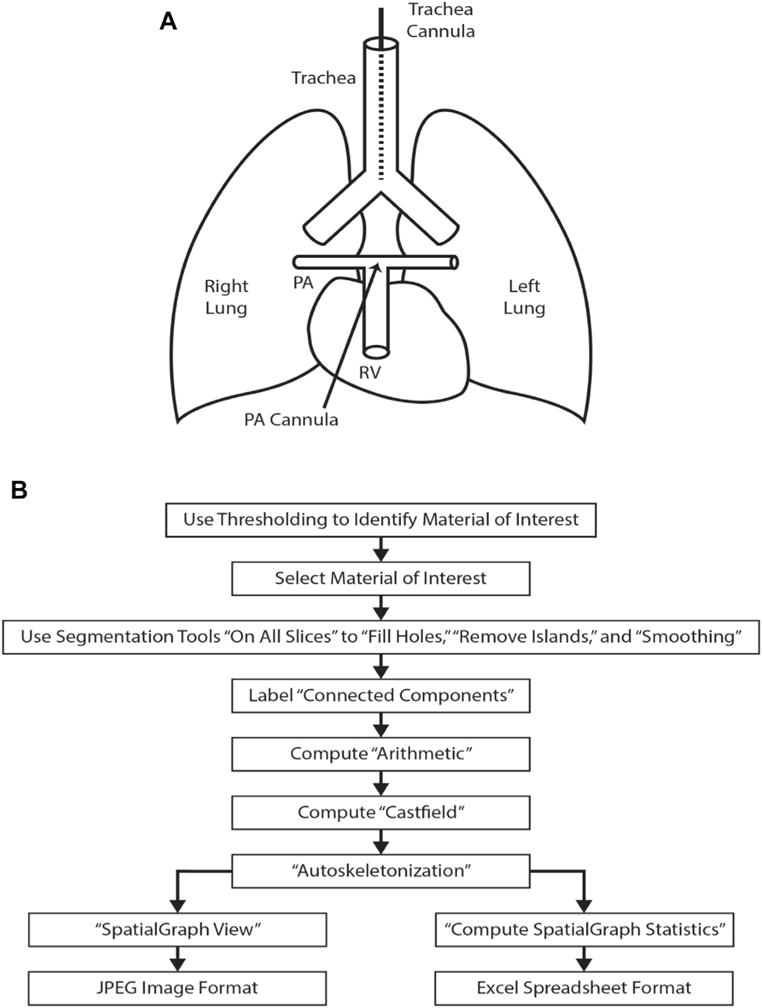
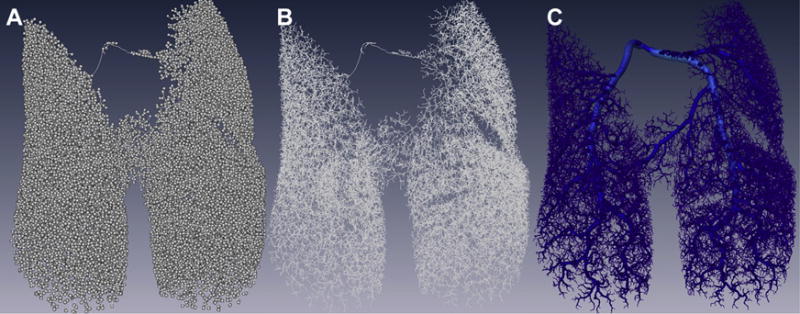
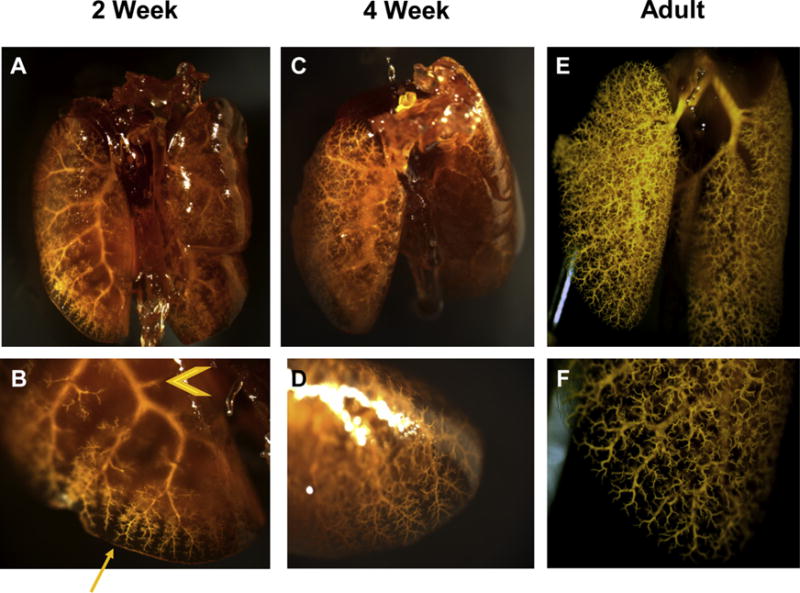
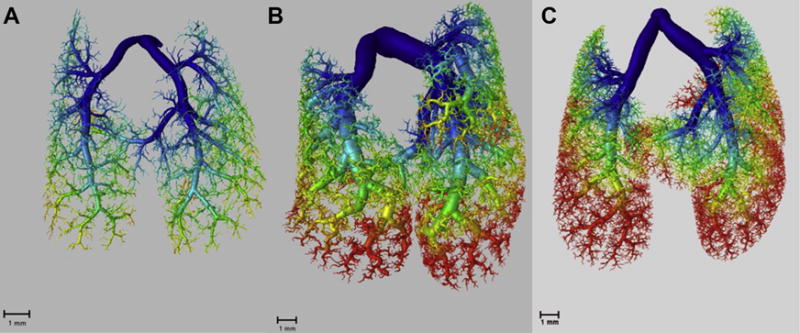
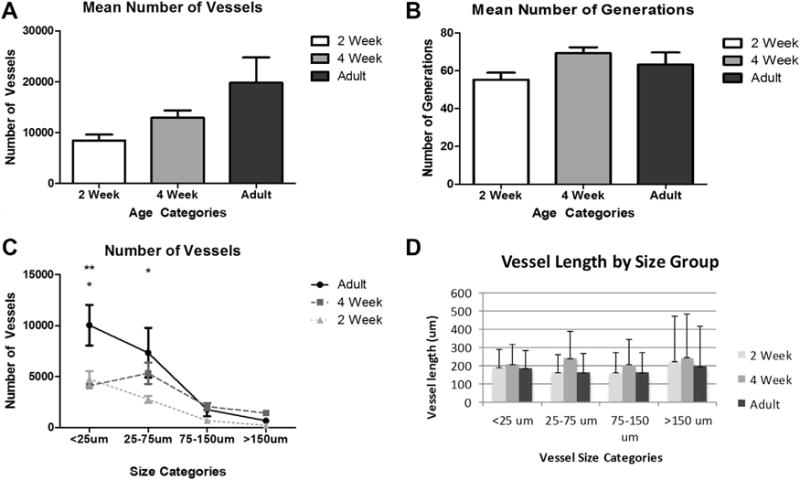
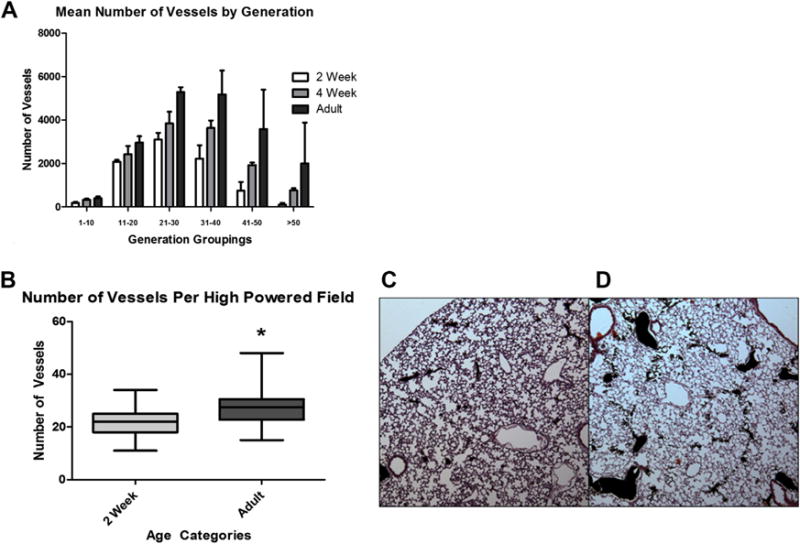
Methods: Mice were harvested at 2 weeks, 4 weeks, and 3 months of age. The pulmonary artery vascular tree was pressure perfused to maximal dilation with a radio-opaque casting material with viscosity and pressure set to prevent capillary transit and venous filling. The lungs were fixed and scanned on a specimen computed tomography scanner at 8-μm resolution, and the vessels were segmented. Vessels were grouped into categories based on lumen diameter and branch generation.

Results: Robust high-resolution segmentation was achieved, permitting detailed quantitation of pulmonary vascular morphometrics. As expected, postnatal lung development was associated with progressive increase in small-vessel number and arterial branching complexity.

Conclusions: These methods for quantitative analysis of the pulmonary vasculature in postnatal and adult mice provide a useful tool for the evaluation of mouse models of disease that affect the pulmonary vasculature.

Keywords: Computed tomography; Lung development; Pulmonary circulation.


Conflict of interest statement

Disclosure

The authors have not financial or personal relationships to disclose that may create a conflict or bias in conducting the study or interpreting data.

Figures

Fig. 1
Fig. 1
(A) The diagram of the cannulation process for pulmonary arterial perfusion and pulmonary airway perfusion. After removal of the anterior chest wall, using a dissection microscope, the pulmonary artery (PA) is cannulated with a polyethylene (PE) tubing through a small incision in the right ventricle (RV). A tie secures the catheter in the PA and prevents leakage. A tracheotomy is performed to cannulate the trachea with PE tubing above the level of the carina. A tie secures the cannula within the trachea. (B) Flowchart of the “work flow” for processing the acquired images, 3D reconstruction, and analysis of the images.
Fig. 2
Fig. 2
Images created using Amira during the workflow process to create the reconstructed image of the pulmonary vasculature. Represented are three images from the same cast of the pulmonary vasculature. (A) Node visualization–each branch point in the vascular tree is represented by a ball. (B) Skeleton–the skeletonized view shows a line that represents the centerline of each vessel. (C) Reconstructed lung–the image depicts the final reconstruction of the lung cast. (Color version of figure is available online.)
Fig. 3
Fig. 3
Mouse lungs that have been perfused through the pulmonary vasculature with Microfil and cleared. Each lung is representative of their respective age group. Age groups: 2 weeks (A, B); 4 weeks (C, D); adult (E, F). Images were acquired by dissecting microscope. Whole lung: 9× magnificationd(A, C, E) lung periphery: 30× magnificationd(B, D, F). The lungs grossly demonstrate an increase in complexity and number of vessels in the pulmonary arterial tree across development. “Side branches” of major pulmonary arteries appear in greater abundance in the periphery (arrow) of 2-week mice then the proximal (arrowhead) pulmonary vasculature (2B). Side branches have filled and sprouted from proximal pulmonary vessels by 4 weeks (2D). (Color version of figure is available online.)
Fig. 4
Fig. 4
Reconstructed of images of the mouse pulmonary vasculature at (A) 2 weeks of age, (B) 4 weeks of age, and (C) 3 months of age. The generation of a vessel is represented by a color gradient from blue (low) to red (high). Qualitatively, there is increased density and complexity in the pulmonary vasculature as age increases. (Color version of figure is available online.)
Fig. 5
Fig. 5
(A) The graph shows the mean number of vessels by age group. The number of vessels increased with age. Comparisons between groups were not statistically significant (P = 0.37). (B) The graph shows the mean number of generations by age group. The mean number peaks at 4 weeks and slightly decreases in adulthood. Comparisons between age groups did not demonstrate statistically significant differences. (P = 0.37). (C) The graph shows the mean vessel counts by diameter of the vessels divided into size categories for each age group. Statistically significant differences are present between adult and 2-week mice for the <25 mm and 25-75 mm size categories and between the adult and 4-week mice for the <25 mm size category. No statistically significant differences are present between 4-week and 2-week mice. (*P < 0.05 adult versus 2 weeks; **P < 0.01 Adult versus 4 weeks). (D) The graph shows the vessel length as it relates to the established vessel size categories. The highest vessel lengths in each size category are at the 4-week time point. Comparisons between groups failed to demonstrate differences.
Fig. 6
Fig. 6
(A) The graph shows the mean number of vessels at each age. The means of each age were compared to one another within the generation grouping. While the mean vessel number increases in accordance with the age cohort, none of the differences were found to be statistically significant. There is a peak in the number of vessels for each age cohort in the 21-30 rank grouping. (B) The graph demonstrates a statistically significant difference with a greater number of vessels per high-powered field in adult mice in comparison to 2-week mice. (*P < 0.0001; whiskers on box plot represent the maximum and minimum vessels per high-powered field). (C and D) Hematoxylin and eosin-stained micrographs from C–2 week and D–adult mice at 100× magnification. Filled arteries are black. (Color version of figure is available online.)

References

    1. Dhillon R. The management of neonatal pulmonary hypertension. Arch Dis Child Fetal Neonatal Ed. 2012;97:F223–F228. - PubMed
    1. Kool H, Mous D, Tibboel D, de Klein A, Rottier RJ. Pulmonary vascular development goes awry in congenital lung abnormalities. Birth Defects Res C Embryo Today. 2014;102:343–358. - PubMed
    1. Krishnan U, Rosenzweig EB. Pulmonary hypertension in chronic lung disease of infancy. Curr Opin Pediatr. 2015;27:177–183. - PubMed
    1. Voelkel NF, Douglas IS, Nicolls M. Angiogenesis in chronic lung disease. Chest. 2007;131:874–879. - PMC - PubMed
    1. Kitagawa M, Hislop A, Boyden EA, Reid L. Lung hypoplasia in congenital diaphragmatic hernia. A quantitative study of airway, artery, and alveolar development. Br J Surg. 1971;58:342–346. - PubMed

Publication types