

Case Reports
doi: 10.3324/haematol.2016.155838.
Epub 2016 Dec 15.
Human RAD52 - a novel player in DNA repair in cancer and immunodeficiency
Affiliations
- PMID: 27979922
- PMCID: PMC5286958
- DOI: 10.3324/haematol.2016.155838
Item in Clipboard
Case Reports
Human RAD52 - a novel player in DNA repair in cancer and immunodeficiency
Haematologica.
2017 Feb.
No abstract available
Figures
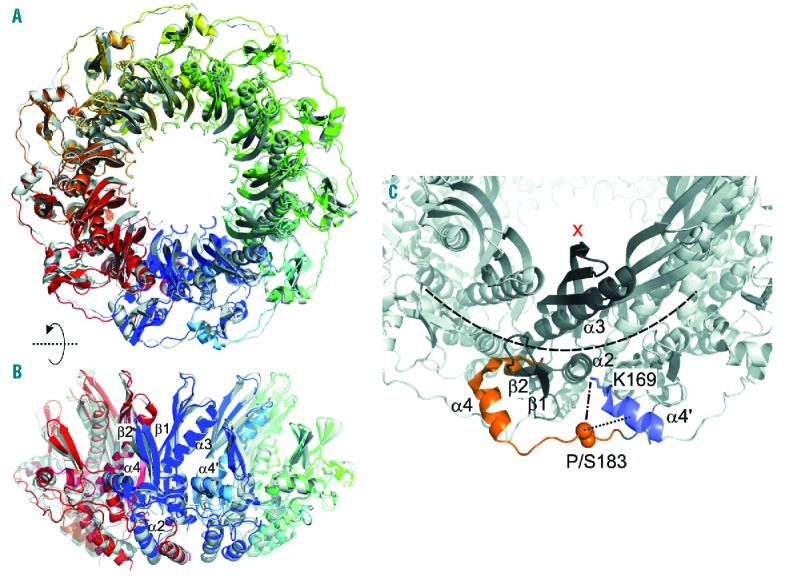
Overall structural similarity of wild-type and mutant RAD52. (A) Overlay of average structures of wild-type RAD52 (colored by a gradient from blue to red) and the S183 mutant (white). The average structures were obtained from MD simulations of 80 ns length; the proteins are depicted in cartoon representation. The average structures differ by a Cα atom root-mean-square deviation (rmsd) of 1.0 Å (B) As in panel (A), but rotated by 90° (C) Local influence of the P183S mutation on dynamics and structure. Cutaway of the RAD52 11-mer (white), with one protomer colored in dark grey. The orange region depicts helix α4, the preceding region of 310 helices, and part of the loop between α4 and α5 where the largest changes in root mean square fluctuation (rmsf) are observed between wild-type and mutant RAD52. The backbone atoms of residue 183 are depicted as spheres. Helix α4’ of the neighboring protomer is colored blue. The distance measured between the Cα atom of residue 183 and the center of α4’ is shown as a dotted black line. The side chain of K169 is shown in stick representation. The distance measured between atom Cγ of P183 or Oγ of S183 and Nz of K169, respectively, is indicated by a dotted-dashed line. The orientation of the side chain of K169 was determined with respect to the center of the 11-mer (red cross). The dashed arc indicates the position of ssDNA according to suggestions.
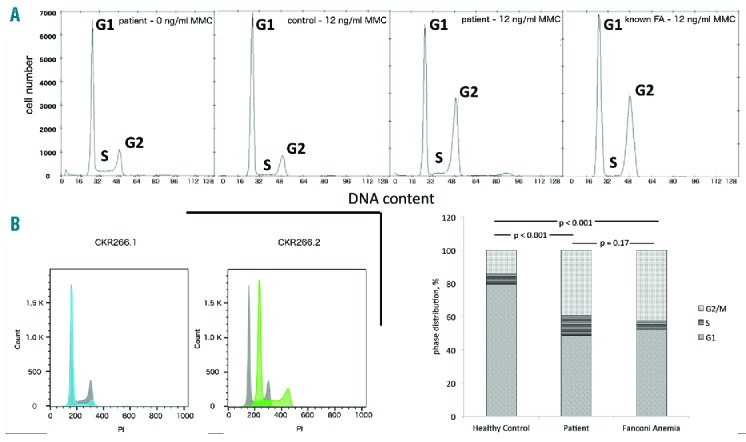
Disturbance of DNA repair in patient samples. (A) Mitomycin C (MMC) sensitivity assay - patient fibroblasts (without MMC, left chart) were exposed to MMC (12 ng/ml) and cultured for 48h. Staining with 4′,6-diamidino-2-phenylindole (DAPI) shows an increased number of G2 phase cells, indicating that cells are in a cycle arrest after induced damage by MMC, a known DNA intercalating agent (second right chart). A G2 increase is not seen in healthy controls (second left chart), but detected in a similar quantity in an internal control with fibroblasts from a MMC sensitive patient control (right chart). Cell cycle distribution among mentioned samples – a χ2 test shows a significant difference between healthy control and patient sample and MMC sensitive patient control, while there is no difference between patient sample and MMC sensitive patient control (bottom right chart) (B) Flow cytometric DNA content measurement of two different LCLs generated from patient’s bone marrow stained with PI following ethanol fixation. Both cell lines were cultured and processed under the same standard conditions from the same specimen. Left: Patient LCL#1 cells (blue) show a slightly increased DNA amount than normal control LCLs (grey). Right: Patient LCL#2 cells (green) show aneuploidy (polyploidy in another experiment), compared to healthy human samples. PI: propidium iodide; FA: fanconi anemia; MMC: mitomycin C.
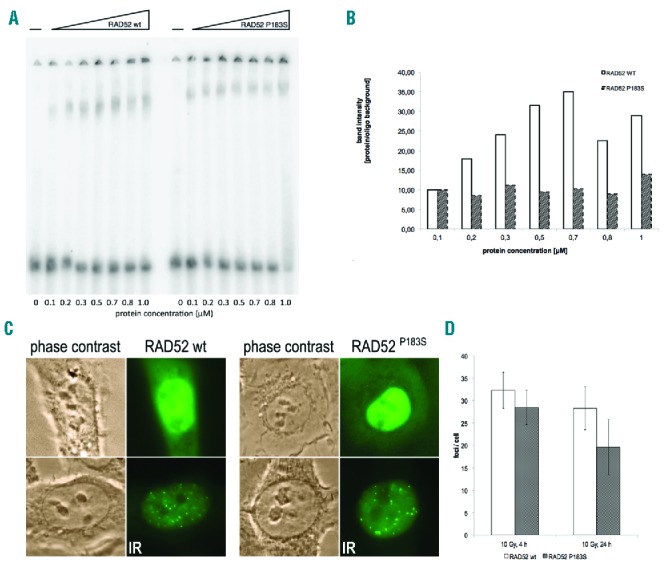
Functional impairment of RAD52P183S. (A) Electrophoretic mobility shift assay (EMSA) of wild-type (WT) and mutant synthetic RAD52 protein (0,1–1 mM) complexes which were formed with a 50bp ssDNA. The purified mutant protein forms faster migrating complexes compared to WT, despite (B) densitometric analyses of EMSA bands for WT and mutant RAD52/ssDNA complexes revealing a lower amount of complex formation irrespective of applied protein concentration in the mutant. Data are representative of three independent experiments. (C) Representative examples of HT-1080 cells stably expressing GFP-RAD52 or GFP-RAD52P183S after irradiation with 10 Gy and a further 24 hours of culture. Phase contrast and fluorescence microscopy. (D) Foci counting per cell in both cell lines after 10 Gy and 4h or 24h of subsequent culture. Irradiation with 1 Gy did not show any difference (data not shown).
References
-
- Woodbine L, Gennery AR, Jeggo PA. The clinical impact of deficiency in DNA non-homologous end-joining. DNA Repair. 2014;16:84–96. - PubMed
-
- San Filippo J, Sung P, Klein H. Mechanism of eukaryotic homologous recombination. Annu Rev Biochem. 2008;77:229–257. - PubMed
-
- Hussain S, Wilson JB, Medhurst AL, et al. Direct interaction of FANCD2 with BRCA2 in DNA damage response pathways. Hum Mol Genet. 2004;13(12):1241–1248. - PubMed
Publication types
MeSH terms
Substances
LinkOut - more resources
Full Text Sources
Other Literature Sources
Medical
Research Materials
