. 2017 Jan 3;114(1):E95-E104.
doi: 10.1073/pnas.1618157114. Epub 2016 Dec 15.

The brain parenchyma has a type I interferon response that can limit virus spread

Affiliations

The brain parenchyma has a type I interferon response that can limit virus spread

Eugene Drokhlyansky et al. Proc Natl Acad Sci U S A. .

Abstract

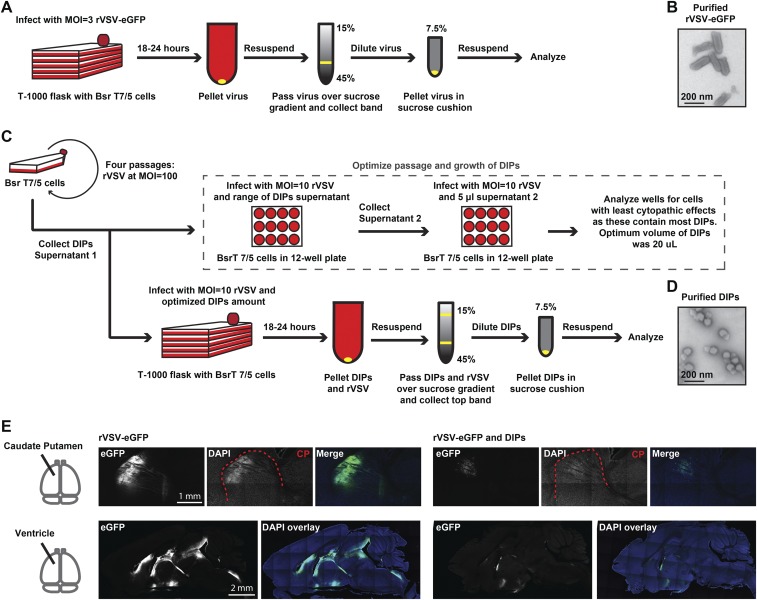
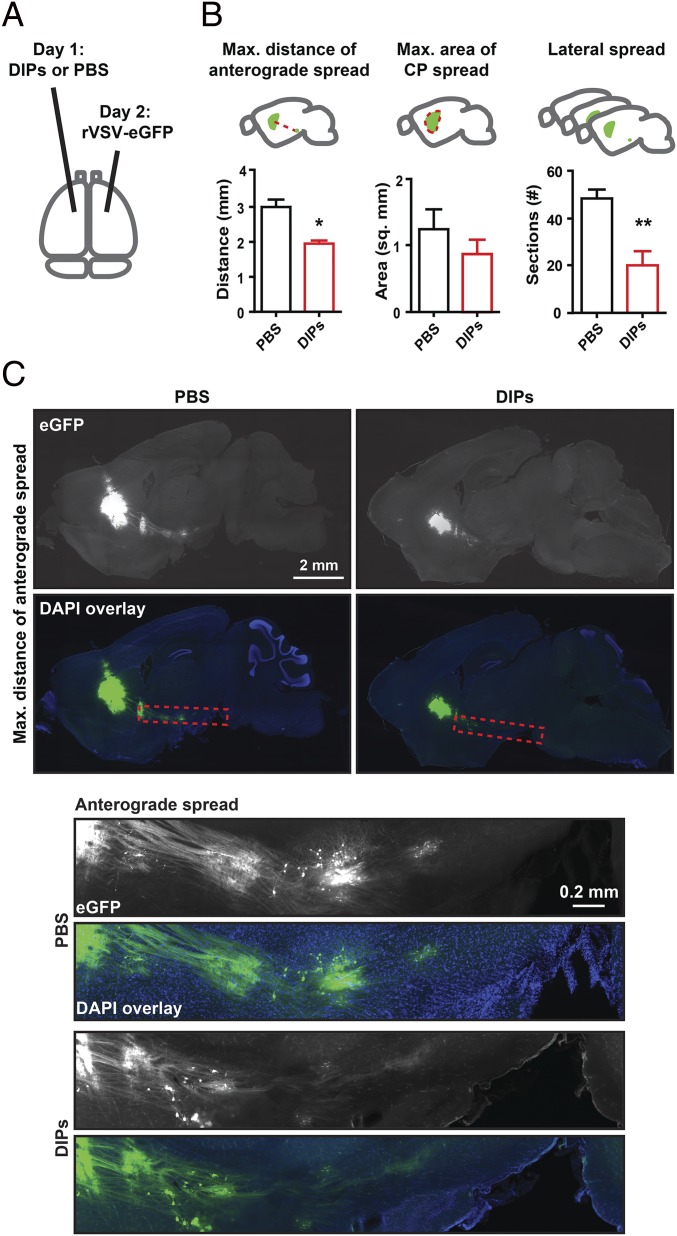
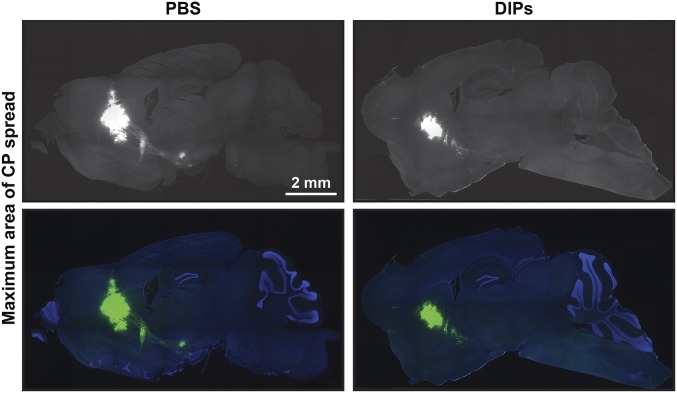
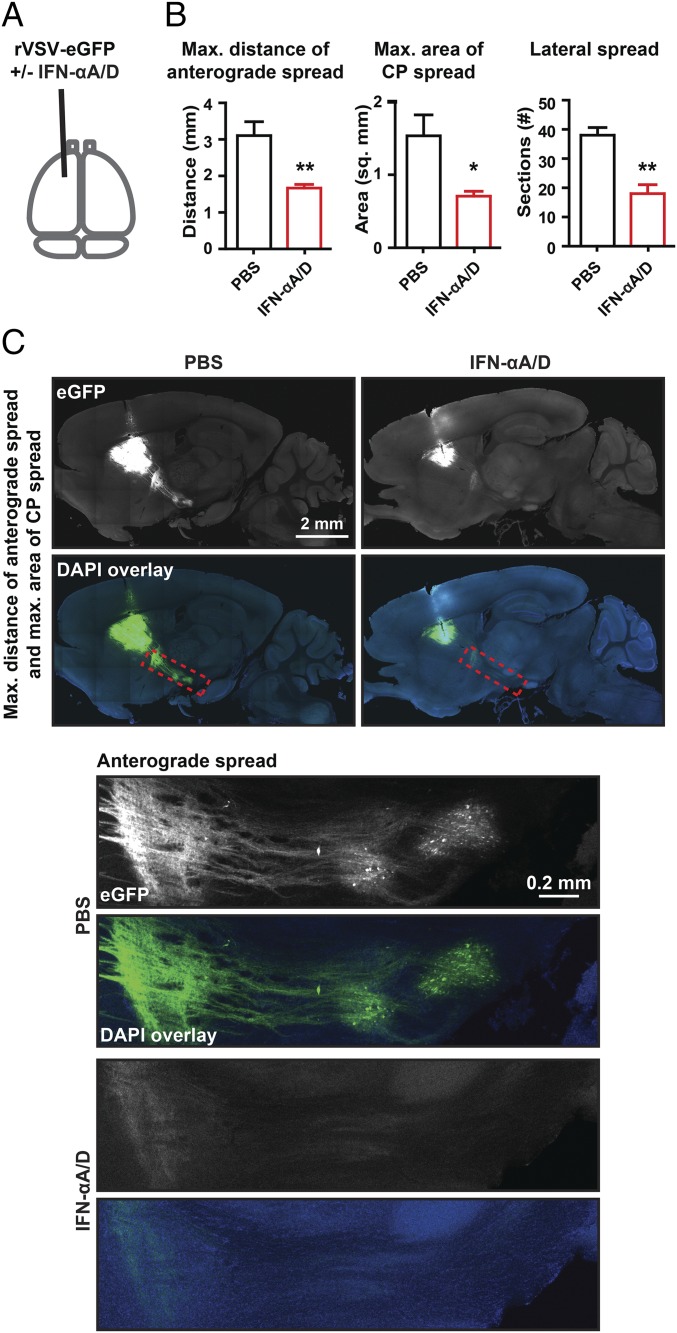
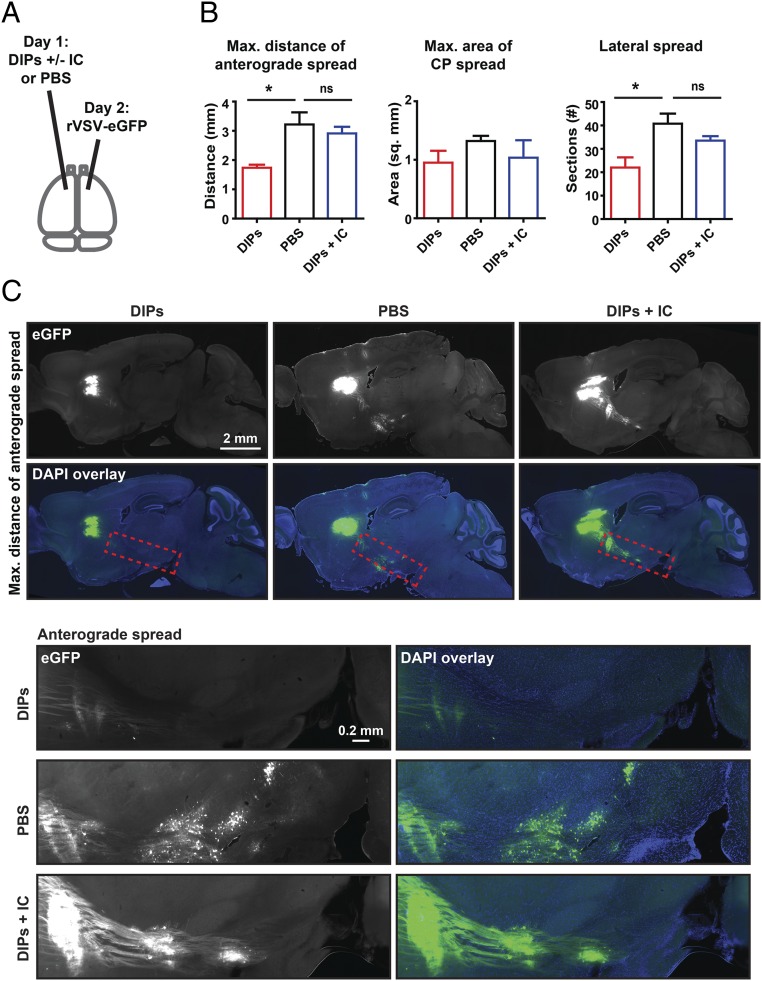
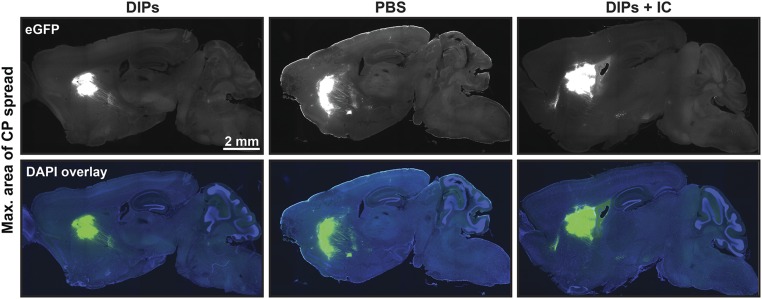
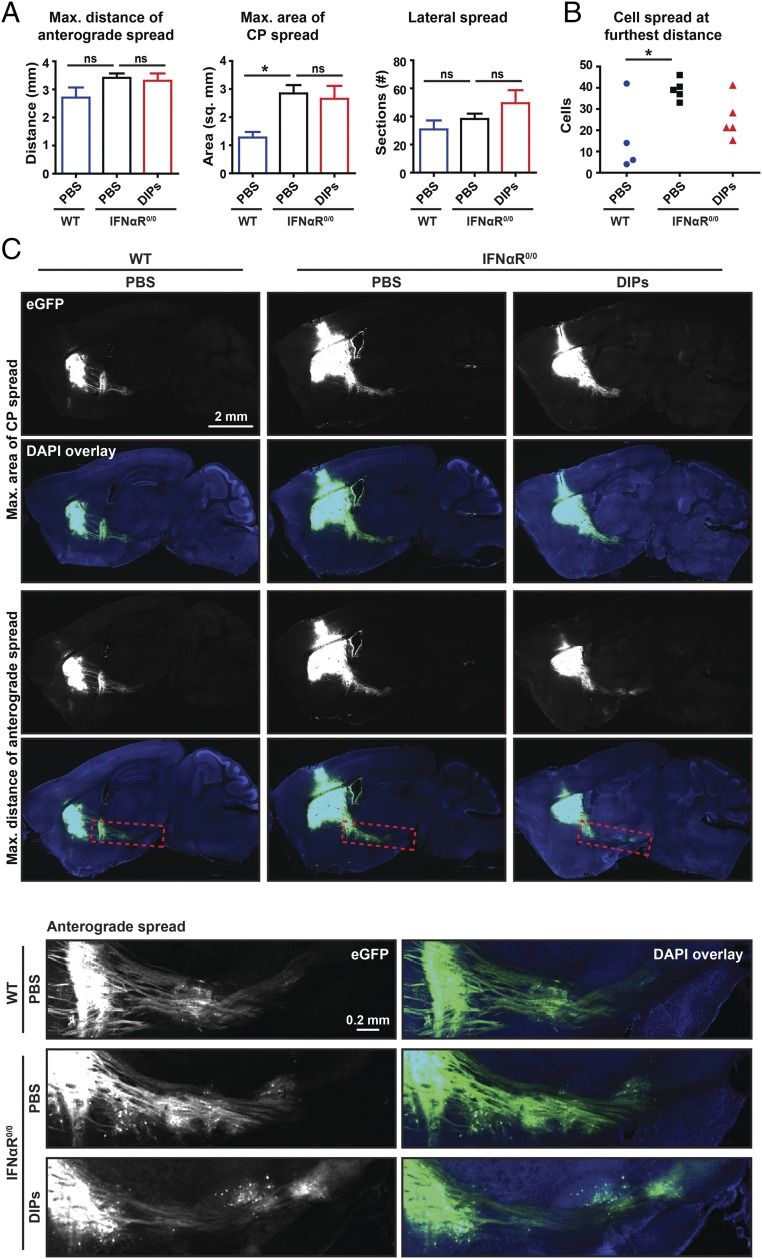
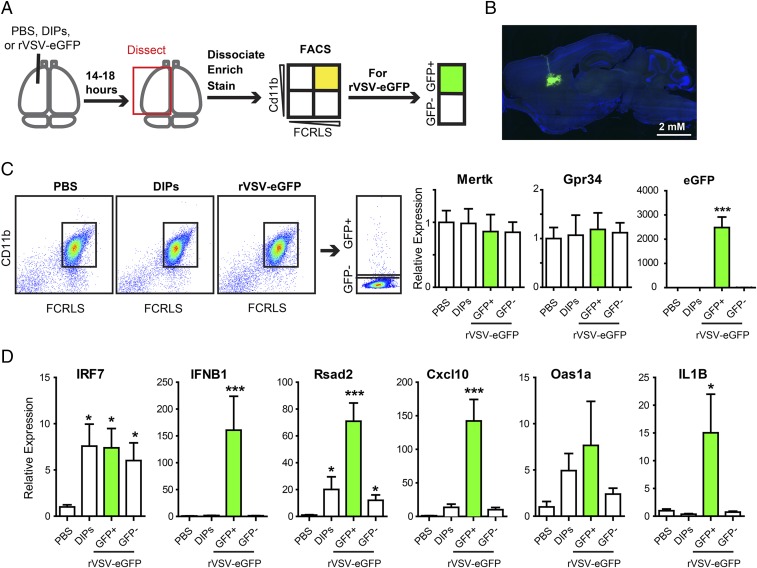
The brain has a tightly regulated environment that protects neurons and limits inflammation, designated "immune privilege." However, there is not an absolute lack of an immune response. We tested the ability of the brain to initiate an innate immune response to a virus, which was directly injected into the brain parenchyma, and to determine whether this response could limit viral spread. We injected vesicular stomatitis virus (VSV), a transsynaptic tracer, or naturally occurring VSV-derived defective interfering particles (DIPs), into the caudate-putamen (CP) and scored for an innate immune response and inhibition of virus spread. We found that the brain parenchyma has a functional type I interferon (IFN) response that can limit VSV spread at both the inoculation site and among synaptically connected neurons. Furthermore, we characterized the response of microglia to VSV infection and found that infected microglia produced type I IFN and uninfected microglia induced an innate immune response following virus injection.

Keywords: VSV; brain; innate immunity; interferon; vesicular stomatitis virus.


Conflict of interest statement

The authors declare no conflict of interest.

Figures

Fig. S1.
Fig. S1.
Effect of DIP coinjection on rVSV-eGFP infection and replication. (A) Schematic for gradient purification of rVSV-eGFP. (B) Negative-stain EM of gradient-purified rVSV-eGFP. (C) Schematic for production and purification of DIPs. (D) Negative-stain EM of gradient-purified DIPs. (E) Direct inhibition of rVSV-eGFP infection and spread in CP and ventricles; DIP stock or PBS was mixed 1:1 with 4 × 10⁷ pfu/mL rVSV-eGFP, and 100 nL volume was injected. Infection was allowed to proceed for 3 d, at which point tissue was collected and sagittal sections were made and DAPI-stained.
Fig. 1.
Fig. 1.
Effect of contralateral injection of DIPs on rVSV-eGFP spread. (A) Timing and infection sites for injection of DIPs and rVSV-eGFP into the CP are indicated. Effect of contralateral injection of DIPs on rVSV-eGFP spread was tested. DIPs and rVSV-eGFP stocks were diluted, and 100 nL (170 ng) of DIPs or PBS was injected on day 1 and 100 nL (2,000 pfu) of rVSV-eGFP was injected on day 2. Sagittal sections were made at 3 dpi. (B) Metrics for analysis are illustrated (Top). Graphs display means ± SEM for each metric and condition. n PBS = 5 and n DIPs = 4. Unpaired two-tailed Student’s t test, *P ≤ 0.05, **P ≤ 0.01. (C) Representative images of sagittal sections with the MDAS and Insets of anterograde spread from these sections are presented. Inset locations are indicated by dotted red line on sagittal sections.
Fig. S2.
Fig. S2.
MACS for rVSV-eGFP following contralateral injections of DIPs and PBS. Shown are corresponding MACS sections to animals presented in Fig. 1.
Fig. 2.
Fig. 2.
Effect of type I IFN coinjection on rVSV-eGFP spread. (A) Timing and infection site for injection of rVSV-eGFP with or without IFNα-A/D into the CP are indicated. rVSV-eGFP stocks were diluted in either PBS or PBS with a final concentration of 8 × 10⁵ U/mL of IFNα-A/D. A volume of 100 nL (2,000 pfu) of each was injected into the CP, and infection was allowed to proceed for 3 d. (B) Graphs display mean ± SEM for each metric and condition. n PBS = 3 and n IFNα-A/D = 4. Unpaired two-tailed Student’s t test, *P ≤ 0.05, **P ≤ 0.01. (C) Representative images of sagittal sections with the MDAS and MACS shown and Insets of anterograde spread from these sections are presented. Inset locations are indicated by dotted red line on sagittal sections.
Fig. 3.
Fig. 3.
Effect of inhibitor cocktail (IC) on DIP restriction of rVSV-eGFP spread. (A) Timing and infection sites for injection of DIPs, inhibitor cocktail (IC; BX795, CP-690550, and INCB018424), PBS, and rVSV-eGFP into the CP are indicated. Effect of IC on DIPs’ restriction of rVSV-eGFP spread was tested. A volume of 100 nL of either PBS, DIPs (170 ng), or DIPs with IC (0.13 mM for BX795, 0.27 mM for CP-690550, and 0.27 mM for INCB018424) was injected on day 1. Then, 100 nL of rVSV-eGFP (2,000 pfu) was injected on day 2. Tissue was examined at 3 dpi with rVSV-eGFP. (B) Graphs display means ± SEM for each metric and condition. n DIPs = 3, n PBS = 4, and n DIPs+IC = 4. ANOVA with Dunnett’s multiple comparison post test; *P ≤ 0.05; ns, not statistically significant. (C) Representative images of sagittal sections with the MDAS and Insets of anterograde spread from these sections are presented. Inset locations are indicated by the dotted red line on sagittal sections.
Fig. S3.
Fig. S3.
MACS for injections of DIPs with or without the inhibitor cocktail (IC), followed by rVSV-eGFP. Shown are corresponding MACS sections to animals presented in Fig. 3.
Fig. 4.
Fig. 4.
Effect of contralateral DIP injections on rVSV-eGFP spread in IFNαR0/0 mice. (A) The effect of contralateral DIPs on rVSV-eGFP spread in IFNαR0/0 mice was assessed. A volume of 100 nL of either DIPs (170 ng) or PBS was injected on day 1, and 100 nL of rVSV-eGFP (2,000 pfu) was injected on day 2. Infection was allowed to proceed for 3 d. Graphs display mean ± SEM for each metric and condition. n WT with PBS = 4, n IFNαR0/0 with PBS = 5, and n IFNαR0/0 with DIPs = 5. ANOVA with Dunnett’s multiple comparison post test, *P ≤ 0.05. (B) As the MACS was different between WT and IFNαR0/0 mice, the number of anterograde cells infected at the furthest distance on the section with the MDAS was assessed. Two-tailed Student’s t test, *P ≤ 0.05). (C) Representative images of sagittal sections with the MACS and MDAS and Insets of anterograde spread from these sections are presented. Inset locations are indicated by the dotted red line on sagittal sections.
Fig. 5.
Fig. 5.
Microglia response to DIP and rVSV-eGFP infection. (A) Schematic of CP injection and microglia isolation, which was followed by qPCR. (B) Representative CP infection by 100 nL containing 105 pfu rVSV-eGFP at 18 hpi. (C, Left) Representative FACS plots for FCRLS+Cd11b+ microglia following PBS, DIP, or rVSV-eGFP injection and for eGFP+ microglia following rVSV-eGFP injection. (C, Right) Relative expression of microglia-enriched genes, Mertk and Gpr34, and virus-encoded eGFP. Kruskal–Wallis test with Dunn’s multiple comparison post test, ***P ≤ 0.001. (D) Relative expression of innate immune genes. Kruskal–Wallis test with Dunn’s multiple comparison post test, *P ≤ 0.05, ***P ≤ 0.001.

References

    1. Galea I, Bechmann I, Perry VH. What is immune privilege (not)? Trends Immunol. 2007;28(1):12–18. - PubMed
    1. Murphy JB, Sturm E. Conditions determining the transplantability of tissues in the brain. J Exp Med. 1923;38(2):183–197. - PMC - PubMed
    1. Stevenson PG, Hawke S, Sloan DJ, Bangham CR. The immunogenicity of intracerebral virus infection depends on anatomical site. J Virol. 1997;71(1):145–151. - PMC - PubMed
    1. Andersson PB, Perry VH, Gordon S. The acute inflammatory response to lipopolysaccharide in CNS parenchyma differs from that in other body tissues. Neuroscience. 1992;48(1):169–186. - PubMed
    1. Bechmann I, Galea I, Perry VH. What is the blood-brain barrier (not)? Trends Immunol. 2007;28(1):5–11. - PubMed

Publication types

Substances

LinkOut - more resources