. 2017 Feb 28;45(4):1633-1648.
doi: 10.1093/nar/gkw1237.

Homozygous and hemizygous CNV detection from exome sequencing data in a Mendelian disease cohort

Affiliations

Homozygous and hemizygous CNV detection from exome sequencing data in a Mendelian disease cohort

Tomasz Gambin et al. Nucleic Acids Res. .

Abstract

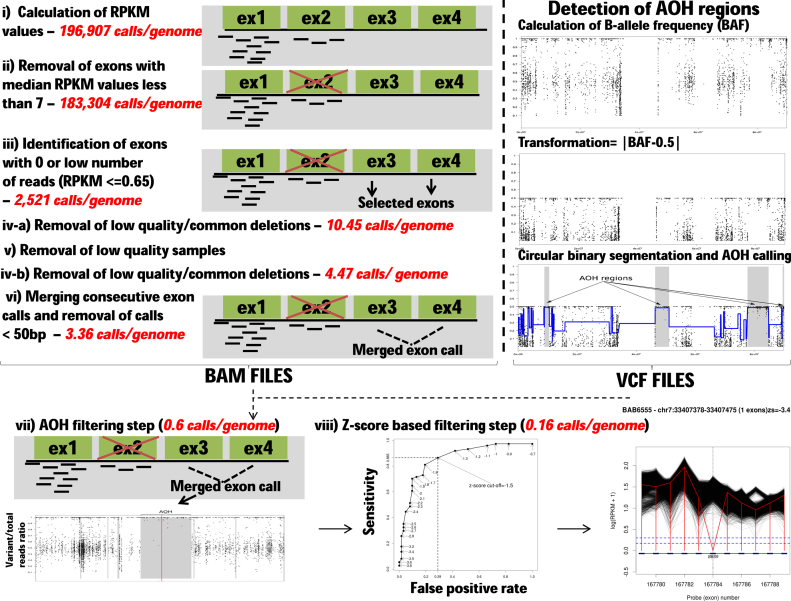
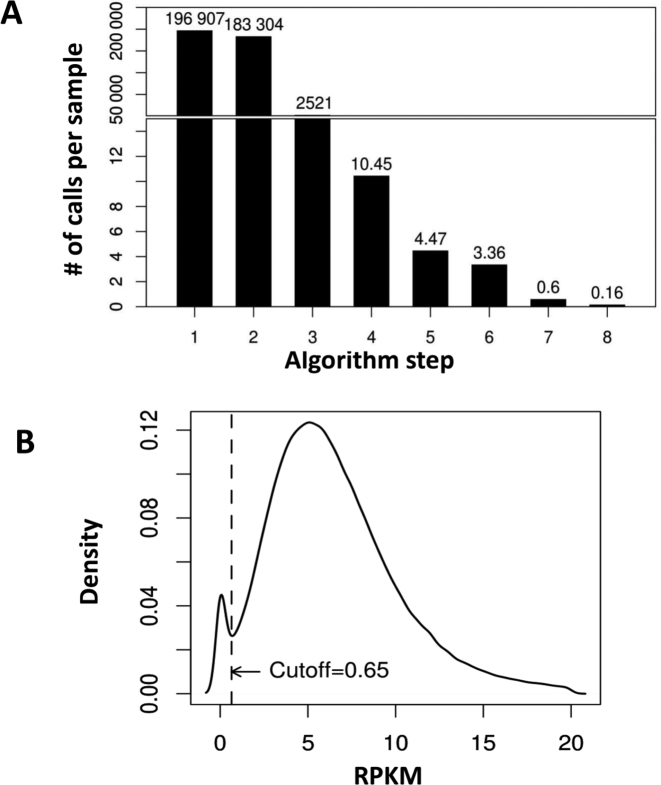
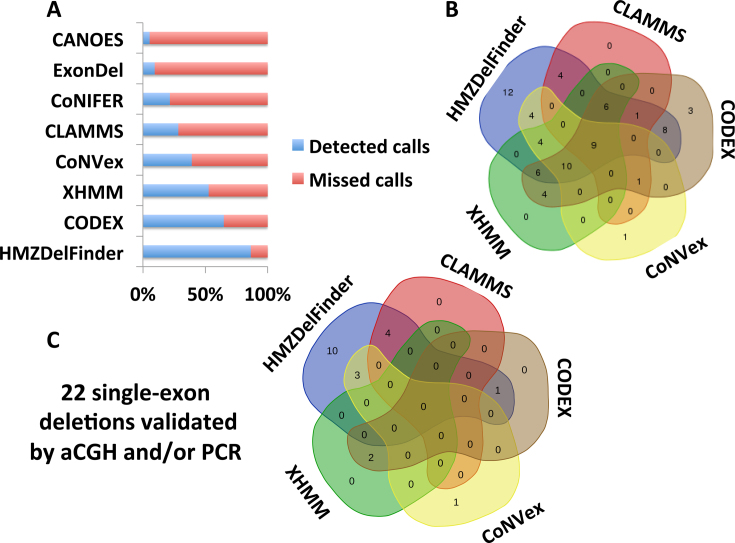
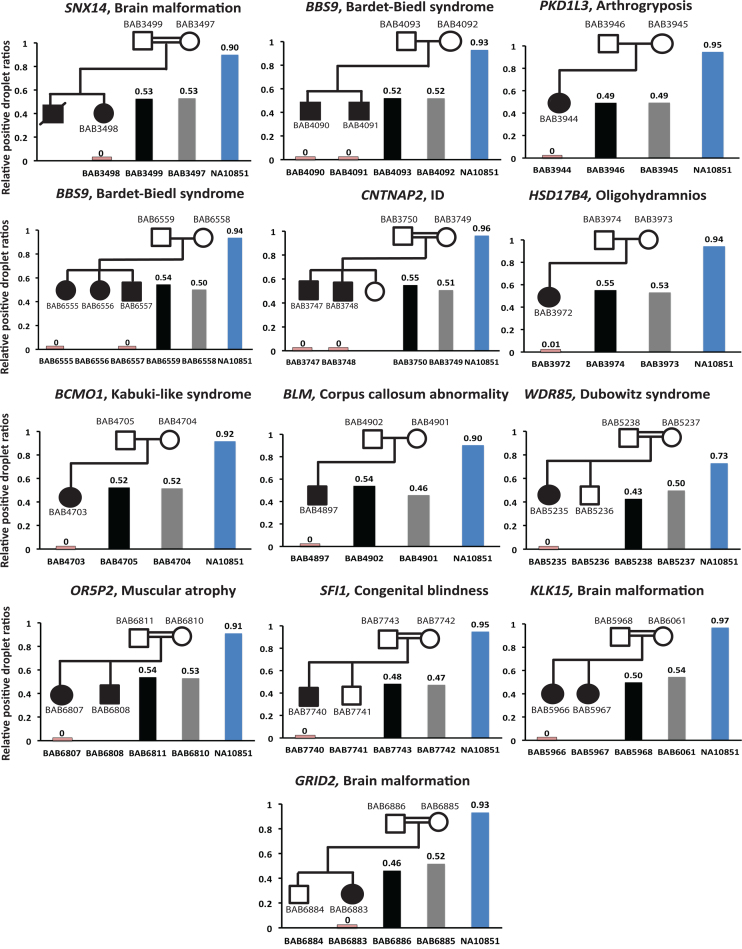
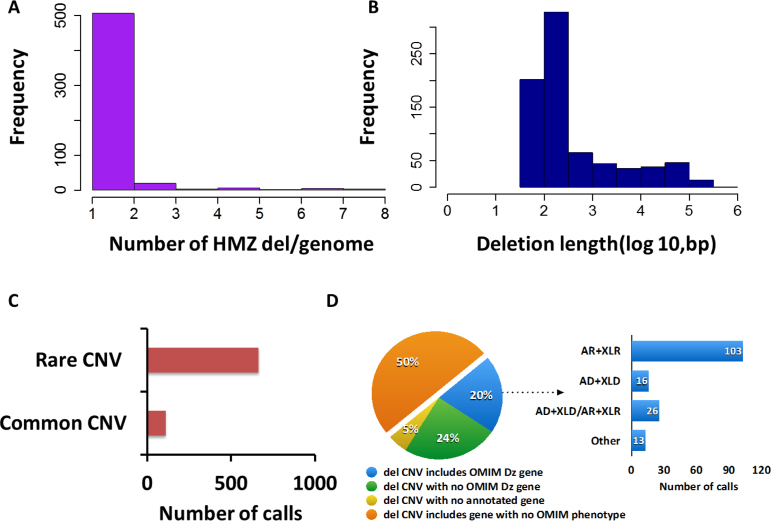
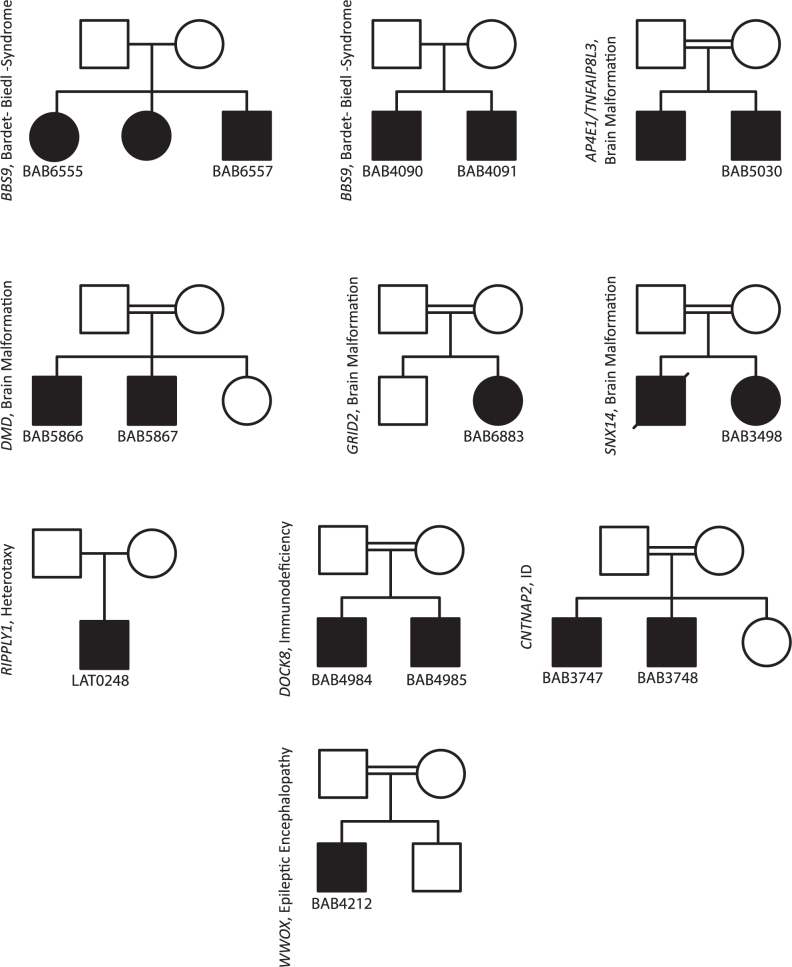
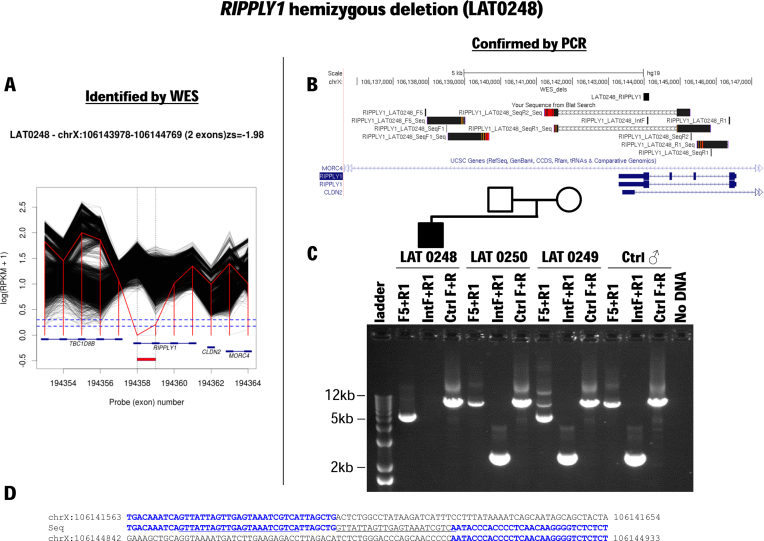
We developed an algorithm, HMZDelFinder, that uses whole exome sequencing (WES) data to identify rare and intragenic homozygous and hemizygous (HMZ) deletions that may represent complete loss-of-function of the indicated gene. HMZDelFinder was applied to 4866 samples in the Baylor-Hopkins Center for Mendelian Genomics (BHCMG) cohort and detected 773 HMZ deletion calls (567 homozygous or 206 hemizygous) with an estimated sensitivity of 86.5% (82% for single-exonic and 88% for multi-exonic calls) and precision of 78% (53% single-exonic and 96% for multi-exonic calls). Out of 773 HMZDelFinder-detected deletion calls, 82 were subjected to array comparative genomic hybridization (aCGH) and/or breakpoint PCR and 64 were confirmed. These include 18 single-exon deletions out of which 8 were exclusively detected by HMZDelFinder and not by any of seven other CNV detection tools examined. Further investigation of the 64 validated deletion calls revealed at least 15 pathogenic HMZ deletions. Of those, 7 accounted for 17-50% of pathogenic CNVs in different disease cohorts where 7.1-11% of the molecular diagnosis solved rate was attributed to CNVs. In summary, we present an algorithm to detect rare, intragenic, single-exon deletion CNVs using WES data; this tool can be useful for disease gene discovery efforts and clinical WES analyses.


Figures

Figure 1.
Figure 1.
HMZDelFinder algorithm workflow. Different filtering steps were used for data processing of BAM files shown on the left. The number of calls after each filtering step are displayed in red and italicized. The specific BAM and VCF processing steps in the algorithm are: (i) Normalized read depth (RPKM) values are calculated for each exon captured with HGSC VCRome or the HGSC CORE designs. (ii) Low quality exons with their median RPKM values <7 are further removed from the analysis. (iii) Exons with low read numbers are identified (RPKM ≤ 0.65). The threshold was set to 0.65 based on the density distribution of 0.5% quantile of RPKM values for each exon. (iv) Common deletions are subtracted from the list of potential calls if the frequency of a particular homozygous and hemizygous (HMZ) deletion ≥0.5% in the whole cohort. (v) Samples with the highest number of deletions are removed from the analysis and step (iv) is repeated without these low quality samples. (vi) The consecutive exon deletion calls are merged if they are at most 10 exons apart from each other. (vii) In AOH filtering step, absence of heterozygosity (AOH) is calculated from VCF files and a representative AOH plot is displayed in the lower track (above right). In that plot, the y-axis shows the B-allele frequency (i.e. variant/total reads ratio) extracted from exome data VCF files. This B-allele frequency information is then processed using circular binary segmentation (CBS) implemented in the DNAcopy R Bioconductor package. The resulting segments (gray in color) in the AOH plot denote AOH regions identified by the above algorithm. As expected, the AOH regions consist of the variants (points) that have variant/total reads ratio around 1. After the identification of AOH regions from exome sequencing data, the deletion calls are removed if they do not reside in any AOH region larger than 1 kb. (viii) The final HMZ copy number variant (CNV) deletion calls are prioritized based on their average z-RPKM values. In the deletion plots, the loci that contain the deleted exons and its neighboring exons are shown. Y-axis displays the RPKM values on a log scale. The dashed vertical black line indicates the deleted exon. The red vertical line connects RPKM values at the deleted exon and neighboring exons in the sample. Each black line demonstrates the RPKM information for all of the other samples in the Baylor–Hopkins Center for Mendelian Genomics (BHCMG) cohort. The lower blue dashed line exhibits the threshold RPKM value used in the study. The details of the call (i.e. sample name, position, number of exons deleted and z-score) are provided at the top of each plot. The generated deletion plots are manually inspected further to eliminate potential false positive calls.
Figure 2.
Figure 2.
HMZDelFinder algorithm yield and RPKM threshold value selection. (A) Bar graph documenting number of HMZ deletion calls after each filtering step. (B) Distribution of 0.5% quantiles of RPKM values across all the BHCMG samples is calculated for each exon from the capture target. The first mode of the distribution likely includes poorly covered and commonly deleted exons in our cohort. We selected an RPKM threshold between these two modes (at RPKM = 0.65) to initially annotate all of these exons as potentially deleted (step 3). In step 4, common deletions are subtracted from the list of deletion calls if the frequency of a particular HMZ deletion ≥0.5% in the whole cohort.
Figure 3.
Figure 3.
Comparative analysis of HMZDelFinder and seven other CNV calling algorithms for empirically verified deletion CNVs. (A) Horizontal barplot shows the fractions of calls detected by HMZDelFinder, CODEX, XHMM, CoNVex, CLAMMS, CoNIFER, ExonDel and CANOES out of 74 confirmed HMZ deletions by array comparative genomic hybridization (aCGH) and/or polymerase chain reaction (PCR). (B) The Venn diagram depicts the number of calls detected by the top five performing algorithms (HMZDelFinder, CODEX, XHMM, CoNVex and CLAMMS) out of the 74 validated deletions by aCGH and/or PCR. (C) Out of the 22 experimentally validated single-exon deletions, the Venn diagram shows the number of calls detected by top five performing algorithms (HMZDelFinder, CODEX, XHMM, CoNVex and CLAMMS). Of note, HMZDelFinder detected 18/22 single-exon deletions.
Figure 4.
Figure 4.
Examining inheritance of homozygous deletions experimentally by ddPCR. The segregation of HMZDelFinder-detected deletion calls is confirmed by digital droplet PCR (ddPCR) in 16 individuals in 13 families. Each family is presented with its pedigree structure using standardized symbols (squares = males; circles = females; filled symbols show affected individuals). The gene and the proband's phenotype are depicted above each pedigree. Each bar graph shows the relative positive droplet ratios (target gene compared to control gene) in each available family member (blue vertical bar = ddPCR counts in control DNA; grey = counts in mother; black = father; pink = counts observed in affected child with homozygous deletion). The affected individuals with the deletion calls detected by HMZDelFinder are experimentally verified to have homozygous deletion CNV (the relative positive droplet ratios ≈ 0) and the parents are confirmed to be heterozygous carriers (relative positive droplet ratios ≈ 0.5).
Figure 5.
Figure 5.
Summary statistics of 773 deletion calls detected by HMZDelFinder. (A) The distribution of HMZ deletion calls per genome. The average number of deletion calls per genome is calculated as 0.16. X axis displays the number of deletion calls per genome. Y-axis exhibits the number of samples that have the corresponding number of deletion calls. (B) The length distribution of HMZ deletion calls per genome. The median length of deletion calls is calculated as 179 bp. X-axis displays the length of deletion calls on a log scale. Y-axis exhibits the number of deletion calls that have the corresponding size. (C) Common CNVs are retrieved from an array data containing 42 million oligos, 1000 Genomes Project (1000GP) pilot phase data, Deciphering Developmental Disorders (DDD) data (MAF ≥ 1%). Then, they are intersected with 773 deletion calls. The percentage of the deletion calls involved in common CNVs is displayed as a column plot. The plot shows that 85.9% of the detected HMZ deletion calls do not reside in common CNVs (MAF ≥ 1%). (D) (Left) The 773 deletion calls are examined based on their involvement of any disease-associated gene in OMIM. The pie chart conveys the information that 20% of these calls include at least one-disease associated gene in OMIM. (Right) Out of those deletions that involve at least one-disease associated gene, 65.1% of them encompass a gene with a recessive inheritance pattern as shown in the barplot (AR: Autosomal recessive, XLR: X-linked recessive, AD: Autosomal dominant, XLD: X-linked dominant).
Figure 6.
Figure 6.
Pedigree structures of 10 families with 15 confirmed HMZ deletions initially identified by HMZDelFinder. All of the 15 known disease gene deletions are subjected to aCGH or deletion CNV breakpoint junction PCR for orthogonal confirmations of the bioinformatically identified deletion calls. The presence and zygosity of 15/15 known disease gene deletions are confirmed by at least one orthogonal experimental validation platform. The gene and cohort names are indicated next to the pedigrees. In a subset of the families that carry BBS9, DOCK8, DMD and CNTNAP2, the gene deletions are confirmed in an another affected family member in addition to the probands.
Figure 7.
Figure 7.
Hemizygous partial deletion RIPPLY1, a novel candidate heterotaxy gene, in a male patient with heterotaxy. (A) Whole exome sequencing (WES) read count data (RPKM) are plotted for subject LAT0248 (red line) and all other BHCMG subjects (black lines) in the region of chromosome X containing RIPPLY1. Near-zero RPKM values suggest a hemizygous deletion of the final exon of RIPPLY1 and possibly also the penultimate exon. (B) The minimum CNV size estimated from RPKM data (‘WES_dels’) is shown along with breakpoint sequence data (‘Your Sequence from Blat Search’) and the RIPPLY1 gene structure. (C) PCR with primers spanning the deletion breakpoint confirms the deletion and demonstrates that it was inherited from the proband's mother. (D) Breakpoint sequencing demonstrates that the final two exons of RIPPLY1 are deleted and offers clues concerning the mutational mechanism generating this CNV. Note the 22 bp insertion that matches near-upstream sequence (underline).

References

    1. Lupski J.R. Structural variation mutagenesis of the human genome: impact on disease and evolution. Environ. Mol. Mutagen. 2015; 56:419–436. - PMC - PubMed
    1. Zhang F., Gu W., Hurles M.E., Lupski J.R.. Copy number variation in human health, disease and evolution. Annu. Rev. Genomics Hum. Genet. 2009; 10:451–481. - PMC - PubMed
    1. Stankiewicz P., Lupski J.R.. Structural variation in the human genome and its role in disease. Annu. Rev. Med. 2010; 61:437–455. - PubMed
    1. Alkuraya F.S. Natural human knockouts and the era of genotype to phenotype. Genome Med. 2015; 7:48. - PMC - PubMed
    1. Lupski J.R., Belmont J.W., Boerwinkle E., Gibbs R.A.. Clan genomics and the complex architecture of human disease. Cell. 2011; 147:32–43. - PMC - PubMed

Publication types