. 2016 Dec 5:9:93-102.
doi: 10.4137/NMI.S32907. eCollection 2016.

A Mouse Model of Diet-Induced Obesity Resembling Most Features of Human Metabolic Syndrome

Affiliations

A Mouse Model of Diet-Induced Obesity Resembling Most Features of Human Metabolic Syndrome

Maria C Della Vedova et al. Nutr Metab Insights. .

Abstract

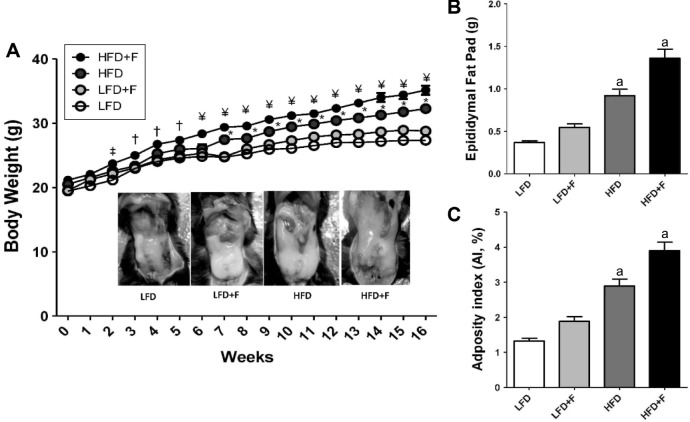
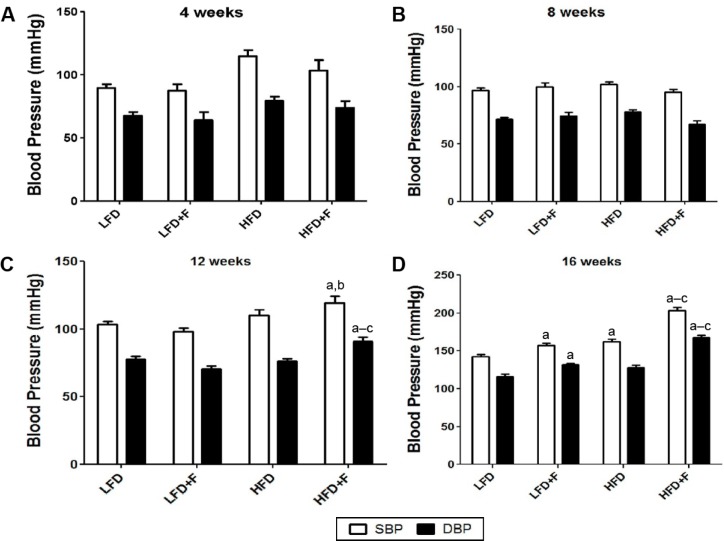
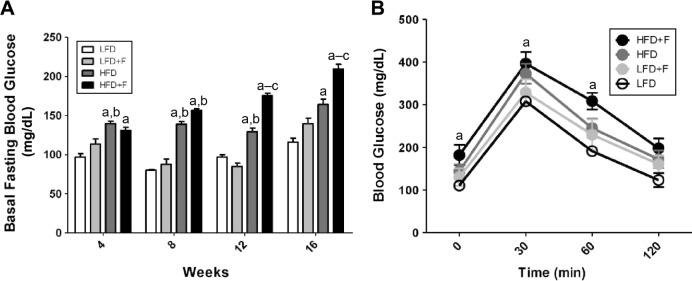
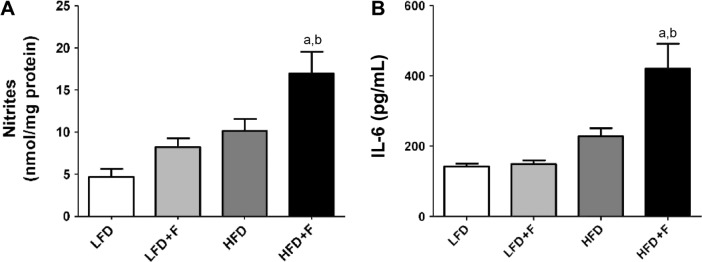
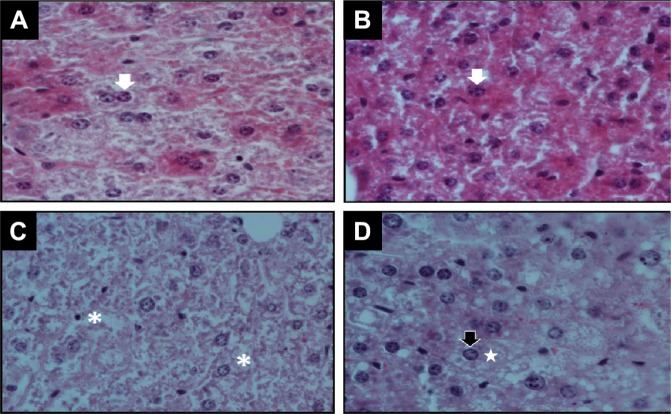
Increased chicken-derived fat and fructose consumption in the human diet is paralleled by an increasing prevalence of obesity and metabolic syndrome (MS). Herein, we aimed at developing and characterizing a mouse model of diet-induced obesity (DIO) resembling most of the key features of the human MS. To accomplish this, we fed male C57BL/6J mice for 4, 8, 12, and 16 weeks with either a low-fat diet (LFD) or a high-chicken-fat diet (HFD) and tap water with or without 10% fructose (F). This experimental design resulted in the following four experimental groups: LFD, LFD + F, HFD, and HFD + F. Over the feeding period, and on a weekly basis, the HFD + F group had more caloric intake and gained more weight than the other experimental groups. Compared to the other groups, and at the end of the feeding period, the HFD + F group had a higher adipogenic index, total cholesterol, low-density lipoprotein cholesterol, fasting basal glycemia, insulin resistance, hypertension, and atherogenic index and showed steatohepatitis and systemic oxidative stress/inflammation. A mouse model of DIO that will allow us to study the effect of MS in different organs and systems has been developed and characterized.

Keywords: adiposity; diet-induced obesity; inflammation; metabolic syndrome; mouse model; redox change.


Conflict of interest statement

Authors disclose no potential conflicts of interest.

Figures

Figure 1
Figure 1
HFD + F diet induces central adiposity in mice. (A) Body weight gain curve in C57BL/6J mice fed for 4, 8, 12, and 16 weeks an LFD and HFD with (LFD + F and HFD + F) or without fructose in the drinking water. P < 0.05, ¥P < 0.01, and P < 0.001 compared HFD + F with LFD. *Indicates differences (P < 0.05) between HFD and LFD. Insert, epididymal fat depot in a representative mouse from each group after 16 weeks of dieting.(B) Weight of epididymal fat depot after 16 weeks of feeding. (C) Adiposity index (AI%): [(epididymal fat/body weight) × 100]. Results are shown as representative images or mean values ± standard error of the mean (n = 6). aP < 0.05 compared to LFD.
Figure 2
Figure 2
HFD + F diet feeding elevates SBP in C57BL/6J mice. Mice were fed LFD—low-fat diet; LFD + F—low-fat diet with fructose in drinking water; HFD—high-fat diet; HFD + F—high-fat diet with fructose in drinking water for 4 (A), 8 (B), 12 (C), and 16 (D) weeks. At the end of the feeding period, SBP and DBP were measured as indicated in the “Materials and methods” section. The values are reported as mean ± standard error of the mean (n = 6). a–cP < 0.05 compared to LFD, LFD + F, and HFD + F, respectively.
Figure 3
Figure 3
HFD + F induces insulin resistance in mice. (A) The basal fasting glycemia was determined after 4, 8, 12, and 16 weeks of feeding. a–cP < 0.05 compared to LFD, LFD + F, and HFD + F, respectively. (B) GTT was performed at 16 weeks of feeding for each experimental group of animals. aIndicates differences (P < 0.05) compared with the LFD group. The values are shown as mean ± standard error of the mean, n = 6.
Figure 4
Figure 4
Markers of systemic inflammation in serum. (A) Serum nitrites are shown as nmol/mg proteins. (B) Serum IL-6 was determined by a quantitative ELISA as indicated in the “Materials and methods” section. Results are shown as mean values ± standard error of the mean. a,bP < 0.05 compared to LFD and LFD + F, respectively. Repeated measures analysis of variance followed by the Bonferroni test was used.
Figure 5
Figure 5
Histopathological changes in the liver. Representative photograph of H&E staining (600×) of liver sections from each group of animals: (A) LFD, (B) LFD + F, (C) HFD, and (D) HFD + F after 16 weeks of feeding. Normal bi- or monogranulated nucleus (white arrows) inside an eosinophilic cytoplasm of hepatocytes was observed in LFD (A) and LFD + F (B). Instead, loosened (white asterisk in C, HFD) or vacuolated cytoplasm (white stars in D, HFD + F) associated with a nuclear displacement (black arrow) is observed in the liver of animals fed with HFD + F.

References

    1. Odermatt A. The Western-style diet: a major risk factor for impaired kidney function and chronic kidney disease. Am J Physiol Renal Physiol. 2011;301(5):F919–F931. - PubMed
    1. Hernandez Rodriguez M, Gallego Sastre A. Tratado de Nutrición. Vol. 1. Madrid, Spain: Ediciones Diaz de Santos, S.A.; 1999. pp. 3–39. Chapter 1.
    1. Ludwig DS. Dietary glycemic index and obesity. J Nutr. 2000;130(2S suppl):280S–283S. - PubMed
    1. Elliott SS, Keim NL, Stern JS, Teff K, Havel PJ. Fructose, weight gain, and the insulin resistance syndrome. Am J Clin Nutr. 2002;76(5):911–922. - PubMed
    1. Tran LT, Yuen VG, McNeill JH. The fructose-fed rat: a review on the mechanisms of fructose-induced insulin resistance and hypertension. Mol Cell Biochem. 2009;332(1–2):145–159. - PubMed