

Integrating multiple genomic data: sparse representation based biomarker selection for blood pressure
- PMID: 27980650
- PMCID: PMC5133507
- DOI: 10.1186/s12919-016-0044-7
Integrating multiple genomic data: sparse representation based biomarker selection for blood pressure
Abstract
Background: Although many genes have been implicated as hypertension candidates, to date, few studies have integrated different types of genomic data for the purpose of biomarker selection.
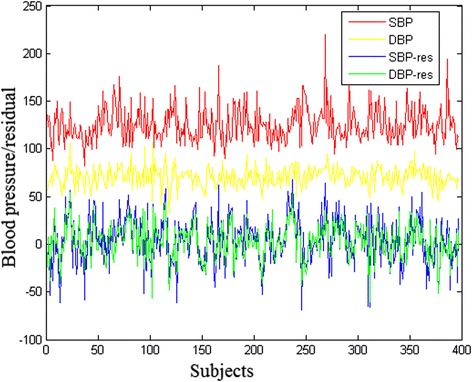
Methods: Applying a newly proposed sparse representation based variable selection (SRVS) method to the Genetic Analysis Workshop19 data, we analyzed a combined data set consisting of 11522 gene expressions and 354893 single-nucleotide polymorphisms (SNPs) from 397 subjects (case/control: 151/246), with the aim to identify potential biomarkers for blood pressure using both gene expression measures and SNP data.
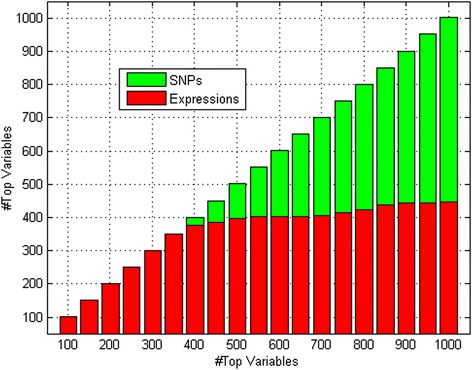
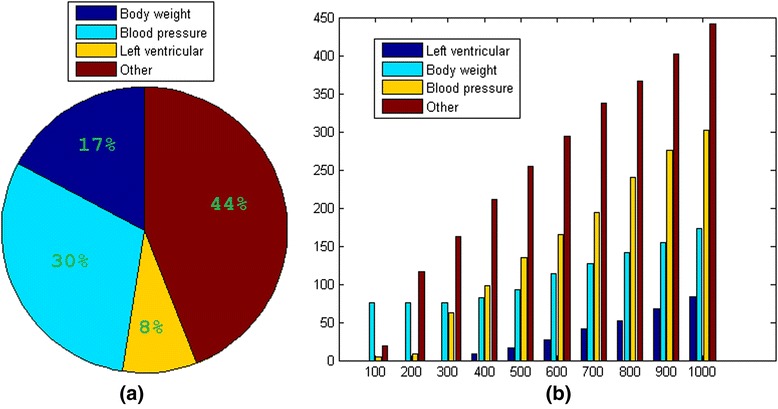
Results: Among the top 1000 variables (SNPs/gene expressions = 575/425) selected, the bioinformatics analysis showed that 302 were plausibly associated with blood pressure. In addition, we identified 173 variables that were associated with body weight and 84 associated with left ventricular contractility. Together, 55.9 % of the top 1000 variables showed associations with blood pressure related phenotypes(SNP/gene expression =348/211).
Conclusions: Our results support the feasibility of the SRVS algorithm in integrating multiple data sets of different structure for comprehensive analysis.
Figures
Similar articles
-
Integrating fMRI and SNP data for biomarker identification for schizophrenia with a sparse representation based variable selection method.BMC Med Genomics. 2013;6 Suppl 3(Suppl 3):S2. doi: 10.1186/1755-8794-6-S3-S2. Epub 2013 Nov 11. BMC Med Genomics. 2013. PMID: 24565219 Free PMC article.
-
Sparse representation based biomarker selection for schizophrenia with integrated analysis of fMRI and SNPs.Neuroimage. 2014 Nov 15;102 Pt 1:220-8. doi: 10.1016/j.neuroimage.2014.01.021. Epub 2014 Feb 12. Neuroimage. 2014. PMID: 24530838 Free PMC article. Review.
-
Dimension reduction and variable selection for genomic selection: application to predicting milk yield in Holsteins.J Anim Breed Genet. 2011 Aug;128(4):247-57. doi: 10.1111/j.1439-0388.2011.00917.x. Epub 2011 Mar 28. J Anim Breed Genet. 2011. PMID: 21749471
-
Sparse Representation-Based Patient-Specific Diagnosis and Treatment for Esophageal Squamous Cell Carcinoma.Bull Math Biol. 2018 Aug;80(8):2124-2136. doi: 10.1007/s11538-018-0449-8. Epub 2018 Jun 4. Bull Math Biol. 2018. PMID: 29869044
-
A curated target gene pool assisting disease prediction and patient-specific biomarker selection for lung squamous cell carcinoma.Oncol Lett. 2018 Oct;16(4):5140-5146. doi: 10.3892/ol.2018.9241. Epub 2018 Jul 31. Oncol Lett. 2018. PMID: 30197682 Free PMC article.
Cited by
-
Joint analysis of multiple phenotypes: summary of results and discussions from the Genetic Analysis Workshop 19.BMC Genet. 2016 Feb 3;17 Suppl 2(Suppl 2):7. doi: 10.1186/s12863-015-0317-6. BMC Genet. 2016. PMID: 26866608 Free PMC article.
References
-
- International Consortium for Blood Pressure Genome-Wide Association Studies. Ehret GB, Munroe PB, Rice KM, Bochud M, Johnson AD, et al. Genetic variants in novel pathways influence blood pressure and cardiovascular disease risk. Nature. 2011;478(7367):103–109. doi: 10.1038/nature10405. - DOI - PMC - PubMed
-
- Kochunov P, Glahn D, Lancaster J, Winkler A, Kent JW, Jr, Olvera RL, et al. Whole brain and regional hyperintense white matter volume and blood pressure: overlap of genetic loci produced by bivariate, whole-genome linkage analyses. Stroke. 2010;41(10):2137–2142. doi: 10.1161/STROKEAHA.110.590943. - DOI - PMC - PubMed
Grants and funding
LinkOut - more resources
Full Text Sources
Other Literature Sources
