. 2016 Dec 7:9:56.
doi: 10.1186/s13072-016-0107-z. eCollection 2016.

"Gap hunting" to characterize clustered probe signals in Illumina methylation array data

Affiliations

"Gap hunting" to characterize clustered probe signals in Illumina methylation array data

Shan V Andrews et al. Epigenetics Chromatin. .

Abstract

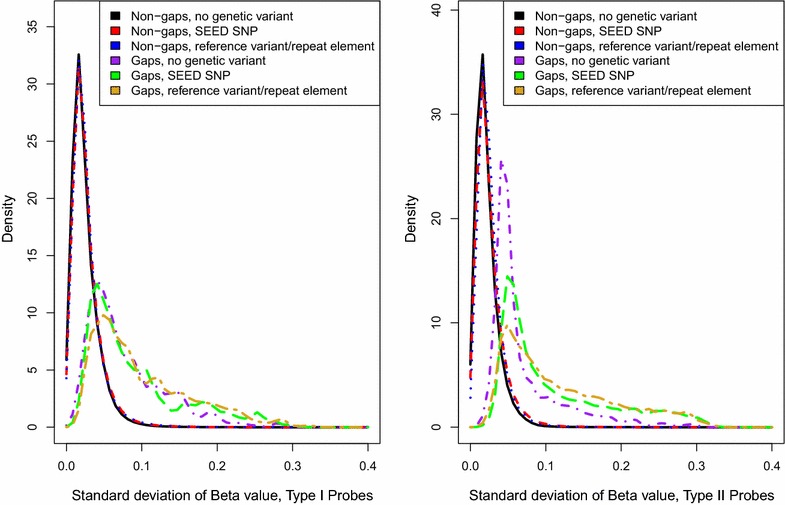
Background: The Illumina 450k array has been widely used in epigenetic association studies. Current quality-control (QC) pipelines typically remove certain sets of probes, such as those containing a SNP or with multiple mapping locations. An additional set of potentially problematic probes are those with DNA methylation distributions characterized by two or more distinct clusters separated by gaps. Data-driven identification of such probes may offer additional insights for downstream analyses.

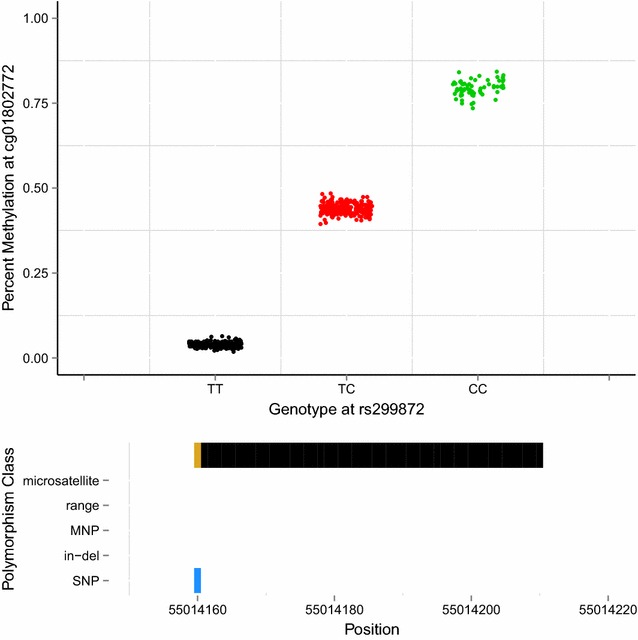
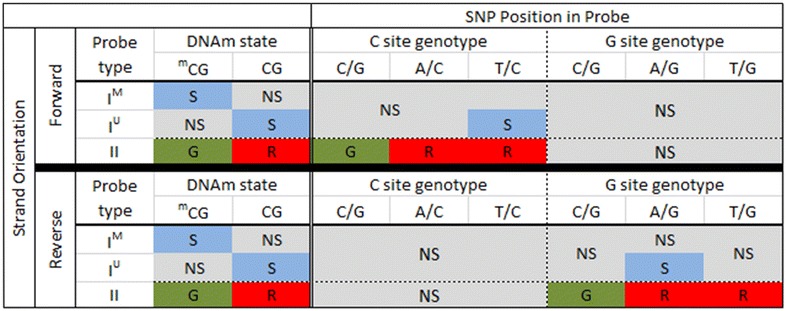
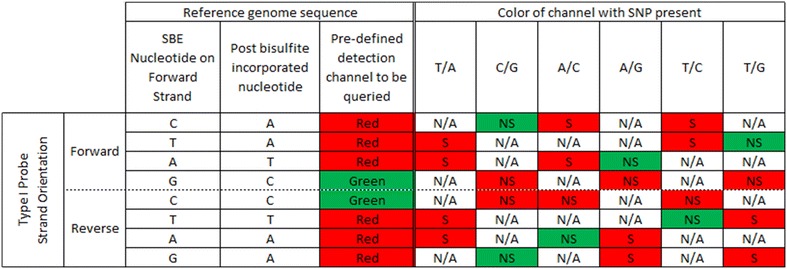
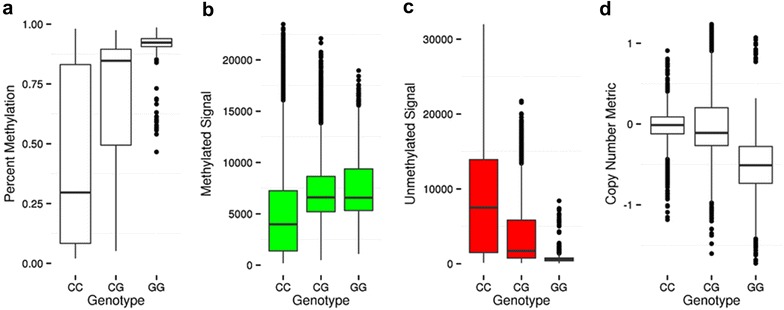
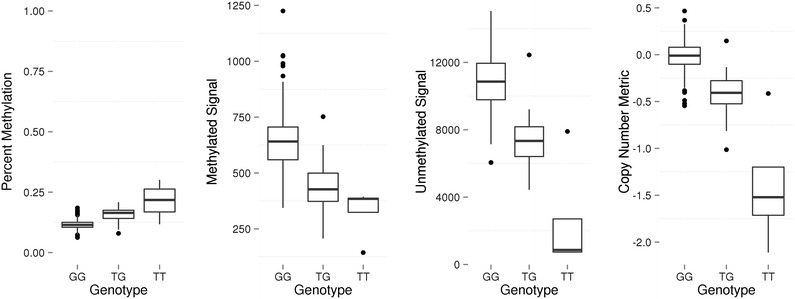
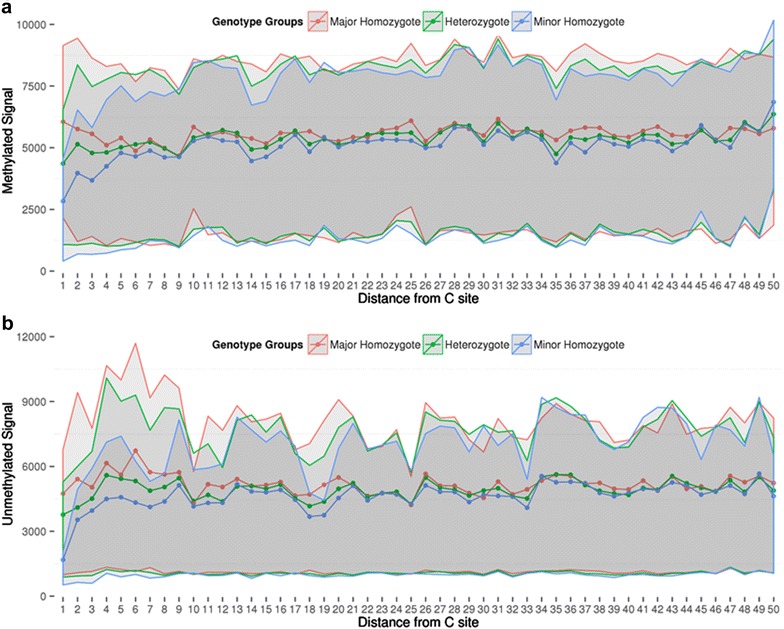
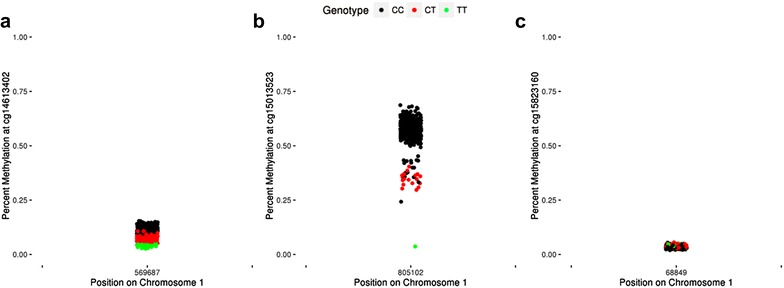
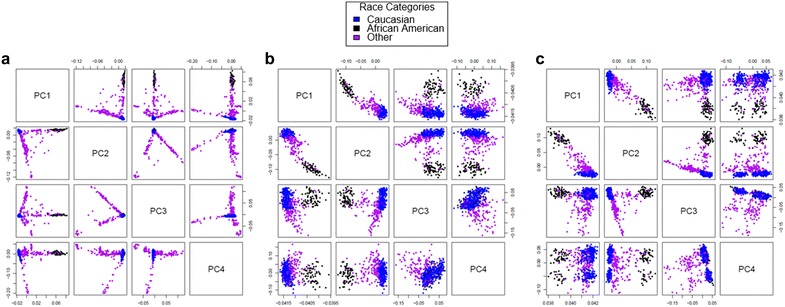
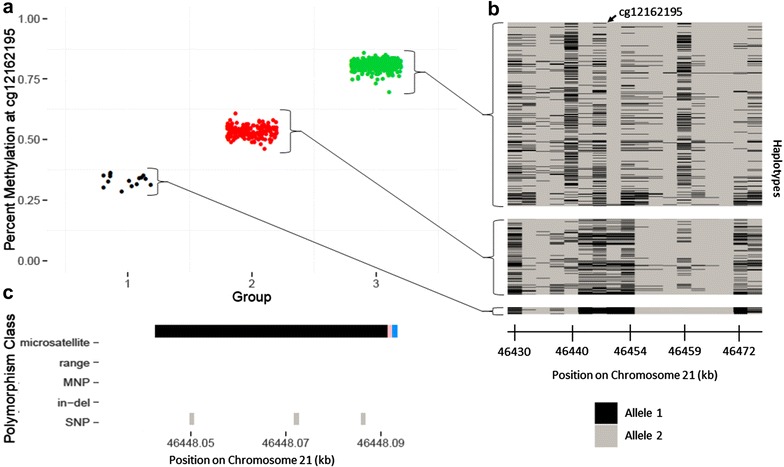
Results: We developed a procedure, termed "gap hunting," to identify probes showing clustered distributions. Among 590 peripheral blood samples from the Study to Explore Early Development, we identified 11,007 "gap probes." The vast majority (9199) are likely attributed to an underlying SNP(s) or other variant in the probe, although SNP-affected probes exist that do not produce a gap signals. Specific factors predict which SNPs lead to gap signals, including type of nucleotide change, probe type, DNA strand, and overall methylation state. These expected effects are demonstrated in paired genotype and 450k data on the same samples. Gap probes can also serve as a surrogate for the local genetic sequence on a haplotype scale and can be used to adjust for population stratification.

Conclusions: The characteristics of gap probes reflect potentially informative biology. QC pipelines may benefit from an efficient data-driven approach that "flags" gap probes, rather than filtering such probes, followed by careful interpretation of downstream association analyses. Our results should translate directly to the recently released Illumina EPIC array given the similar chemistry and content design.

Keywords: 450k Array; Epigenome-wide association studies; Gap hunting; Illumina HumanMethylation450 BeadChip; Polymorphic CpG; SNP.


Figures

Fig. 1
Fig. 1
An example of a gap signal detected in SEED at cg01802772 via gap hunting. Top panel Gap hunting-identified groups are shown in black, red, and green and correspond to measured SEED genotypes TT, TC, and CC, respectively, at rs299872. Bottom panel Depiction of variant locations relative to probe orientation. Blue color denotes the single-base extension site which also corresponds to the interrogated CpG site for this probe type (Type II); black color denotes 50 bp probe length. Y-axis lists variants present in the dbSNP138 database with a frequency greater than 0.5% and validated in more than 200 people
Fig. 2
Fig. 2
Predicted 450k signal for SNPs present at the interrogated CpG site. On the left, in the “DNAm state” column, we show the expected signal for methylated and unmethylated CpG states, when no SNP is present, for both Type I and II probe designs. Middle (“C site SNP”) and right columns (”G site SNP”) provide expected signals for SNPs in the C and G nucleotide positions, respectively. For all columns, S signal, NS no signal, G and R denote red and green channel signals, respectively. mCG represents methylated cytosine. IM and IU denote probe design type I methylated and unmethylated probe types, respectively; II denotes probe type II. For type I design, methylated probes fluoresce and unmethylated probes yield no signal when methylation is present. The type II design fluoresces in the green and red channels for methylated and unmethylated states, respectively. For forward strand interrogated CpG sites (top), a C to G SNP mimics the methylated state; C to A and C to T SNPs mimic the unmethylated state for Type II probes but result in no signal for the Type I design. One exception is for a C to T SNP because it mimics post-bisulfite converted unmethylated Cs. G site SNPs on the forward strand produce no signal for both probe designs because they inhibit single-base extension. Reverse strand probes (bottom) are defined relative to the top strand, so the expected signal scenarios are the converse of what is expected for the forward strand (i.e., G site with some signal, C site with comprehensively no signal)
Fig. 3
Fig. 3
Predicted type I probe signal for individuals with a SBE site-associated SNP. For Type I probes, the SBE is located 1 bp upstream of the C site for interrogations on the forward strand, and 2 bp downstream of the C site for interrogations on the reverse strand (defining the C site location using the forward strand). Enumerating signal expectations requires consideration of bisulfite conversion, complementary bases, the expected color channel for fluorescence, and if those latter two factors change in the presence of SNP. Of note is that C and G bases are labeled to fluoresce green signal, while A and T bases are labeled to fluoresce red signal (hence the existence of “Type I Red” and “Type I Green” probes). For example, consider a forward strand type I probe with a C nucleotide at the SBE position, based on a reference genome sequence (top row). After bisulfite conversion, this base will change to a T, the complementary SBE base is an A, which fluoresces in the red channel. If instead of a C there is a G at the SBE due to a C/G SNP, the SBE-incorporated nucleotide would be a C and fluoresce in the green channel. Because the software is programmed to read only the red channel, no fluorescent signal will be detected when a G SNP is present. Inferring the scenarios for interrogating a CpG site on the reverse strand requires similar reasoning but with the added consideration of complementary bases. N/A not applicable (that SNP cannot exist there), S signal, NS no signal
Fig. 4
Fig. 4
Influence of a C/G SNP located at the interrogated cytosine on reported methylation signal in Type II forward strand probes. a Percent methylation versus genotype plot shows a positive correlation between percent methylation and dosage of the G allele. b Methylated signal versus genotype plot shows a positive correlation between methylated signal and dosage of the G allele. c Unmethylated signal versus genotype plot shows a negative correlation between methylated signal and dosage of the G allele d Copy number metric versus genotype plot shows a negative correlation between copy number and dosage of the G allele
Fig. 5
Fig. 5
Effect of a G/T SNP at the SBE site of Type I probes on percent methylation, methylated signal, unmethylated signal, and a copy number metric. Percent methylation (beta value), methylated signal, unmethylated signal, and a copy number metric plotted against genotype for Type I probes interrogating a CpG site on the forward strand, when the G is the reference genotype. Information was collected across 2 probes. There is an inverse association between dosage of the T allele and signal produced, as predicted in Fig. 3
Fig. 6
Fig. 6
Effect of probe SNPs on methylated signal and unmethylated signal in Type II probes. We isolated specific probes that met the following conditions: it contained a measured SNP in the 50 bp probe length outside of the C, G and/or SBE sites, and it contained only a single SNP in the probe length. The probes that met our criteria varied in distance from 1 to 50 base pairs from the interrogated CpG site. At each distance value, we plotted the mean (shown by dotted lines) and inter-quartile range (grayed area) of the people who were homozygous for the reference allele (shown in red), heterozygous (shown in green) or homozygous for the minor allele (shown in blue). Lack of signal concordance across these 3 groups indicates stronger SNP influences on signal. For both methylated (a) and unmethylated signals (b), polymorphisms closer to the C site show stronger influences on signal. The influence is strongest up to approximately 10 bp but is observed up to roughly 20 bp from the measured C site
Fig. 7
Fig. 7
Examples of probes with a polymorphism that do not result in a gap signal. Most probes that overlap with SEED SNPs are not classified as gap signals. These probes can generally be grouped into 3 categories: a In SEED, cg14613402 overlaps with a C/T SNP at the interrogated C site and displays a negative correlation with dosage of the T allele. However, a discrete difference in the groups is not achieved. b cg15012523 overlaps with a C/T SNP at the interrogated C site and also displays a negative correlation with dosage of the T allele. Here, a discrete difference does existence between the TT genotype and others and thus would be identified via gap hunting; it would be classified as an outlier-driven signal with the default algorithm arguments, however (see “Methods” section). c cg15283160 overlaps with a C/T SNP at the interrogated C site but displays no variability in beta value
Fig. 8
Fig. 8
Distributions of standard deviations among 6 categories of 450k probes. All autosomal probes (n = 473,864) were classified into one of six groups: (1) non-gap probes that lack a SEED SNP, dbSNP-annotated polymorphism, or UCSC-annotated repeat that map to the probe (n = 301,590; shown in black), (2) non-gap probes with at least one SEED SNP present in the probe (n = 62,005; shown in red), (3) non-gap probes that do not contain a SEED SNP but do have an annotated variant as indicated by the dbSNP138 database or map to a UCSC-annotated repeat (n = 99,262; shown in blue), (4) gap probes that lack a SEED SNP, dbSNP-annotated polymorphism, or UCSC-annotated repeat that map to the probe (n = 1808; shown in purple), (5) gap probes with at least one SEED SNP present in the probe (n = 5453; shown in green), (6) gap probes that do not contain a SEED SNP but do have an annotated SNP as indicated by the dbSNP138 database or map to a UCSC-annotated repeat (n = 3746; shown in orange). The 3 non-gap probe distributions are distinct from the gap probe distribution but show some overlap, suggesting some probes with “gap-like” distributions are not captured by gap hunting (also see Fig. 7 for explanation). The gap probe distribution for those probes with annotated SNPs (green and orange) has a slightly higher area under the curve at higher standard deviation values (especially for the Type II design), which is likely due to the generally higher allele frequencies for the annotated SNPs compared to the measured SNPs (see Additional file 8: Figure S33). Gap probes lacking any probe SNPs form a distinct distribution, especially for the Type II design (purple)
Fig. 9
Fig. 9
Comparison of several different methods, including gap probes, for population stratification adjustment. Points are colored according to self-reported race with Caucasian shown in blue, African American shown in black, and Other shown in purple. Each panel contains a series of plots in which the values plotted are dictated by the row (y-axis) and column (x-axis). For example the top row will plot PC 1 (y-axis) versus PCs 2, 3, and 4 (x-axis). a Eigenvectors generated from GWAS data using the EIGENSTRAT software [21]. b PCs generated from probes overlapping with 1000 Genomes-annotated SNPs (0 bp from C site option) as demonstrated by Barfield et al. [20]. c PCs generated from gap signals, which perform similarly to the existing methylation-based method to account for ancestry in EWA studies show in b
Fig. 10
Fig. 10
Relationship between DNA methylation (DNAm) clusters, identified by gap hunting at cg12162195, and local haplotypes among the same individuals. a Percent methylation at cg12162195 versus gap hunting-defined DNAm group. b Individual haplotypes sorted by gap hunting-defined DNAm group. Each column represents a genotyped SNP at a specific locus across all individuals with corresponding DNAm data. Each row denotes an individual’s local haplotype for the region that contains cg12162195. There are two rows per individual, one per haplotype. The arrow at the top of the plot depicts the location of cg12162195 within the haplotype region. Gap hunting-identified groups correspond to different sets of haplotypes; these methylation groups can be used as surrogates of these haplotype groups. c Depiction of variant locations relative to probe orientation. Blue color indicates the single-base extension site; black color denotes 450k probe; pink denotes the interrogated CpG site. Y-axis lists variants present in the dbSNP138 database with a frequency greater than 0.5% and validated in more than 200 people
Fig. 11
Fig. 11
Five gap signals identified in the list of 56 probes that attained suggestive significance (p < 1E − 4) with newborn arousal in a publically available dataset. There is 1 plot for each probe, with percent methylation plotted on the y-axis and newborn arousal score plotted on the x-axis. Each sample is colored by its gap hunting-identified group. The * indicates a probe that would have been filtered out via the dbSNP137 reference annotation in the minfi package

References

    1. Baker-Andresen D, Ratnu VS, Bredy TW. Dynamic DNA methylation: a prime candidate for genomic metaplasticity and behavioral adaptation. Trends Neurosci. 2013;36:3–13. doi: 10.1016/j.tins.2012.09.003. - DOI - PubMed
    1. Hansen KD, Timp W, Bravo HC, Sabunciyan S, Langmead B, McDonald OG, Wen B, Wu H, Liu Y, Diep D, Briem E, Zhang K, Irizarry RA, Feinberg AP. Increased methylation variation in epigenetic domains across cancer types. Nat Genet. 2011;43:768–775. doi: 10.1038/ng.865. - DOI - PMC - PubMed
    1. Liu Y, Aryee MJ, Padyukov L, Fallin MD, Hesselberg E, Runarsson A, Reinius L, Acevedo N, Taub M, Ronninger M, Shchetynsky K, Scheynius A, Kere J, Alfredsson L, Klareskog L, Ekström TJ, Feinberg AP. Epigenome-wide association data implicate DNA methylation as an intermediary of genetic risk in rheumatoid arthritis. Nat Biotechnol. 2013;31:142–147. doi: 10.1038/nbt.2487. - DOI - PMC - PubMed
    1. Ladd-Acosta C, Hansen KD, Briem E, Fallin MD, Kaufmann WE, Feinberg AP. Common DNA methylation alterations in multiple brain regions in autism. Mol Psychiatry. 2014;19:862–871. doi: 10.1038/mp.2013.114. - DOI - PMC - PubMed
    1. Ladd-Acosta C, Shu C, Lee BK, Gidaya N, Singer A, Schieve LA, Schendel DE, Jones N, Daniels JL, Windham GC, Newschaffer CJ, Croen LA, Feinberg AP, Daniele Fallin M. Presence of an epigenetic signature of prenatal cigarette smoke exposure in childhood. Environ Res. 2016; 144(Pt A):139–148. - PMC - PubMed

Publication types