

Virus Nanoparticles Mediated Osteogenic Differentiation of Bone Derived Mesenchymal Stem Cells
- PMID: 27980904
- PMCID: PMC5115314
- DOI: 10.1002/advs.201500026
Virus Nanoparticles Mediated Osteogenic Differentiation of Bone Derived Mesenchymal Stem Cells
Abstract
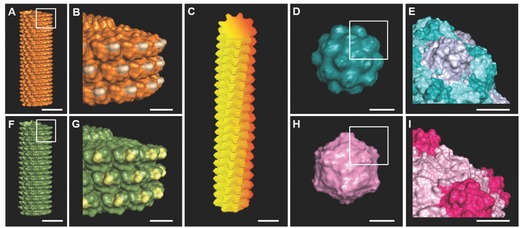
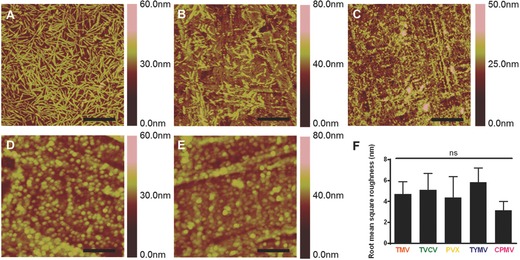
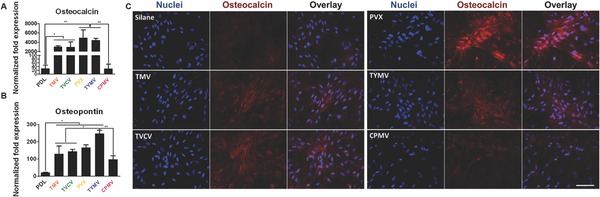
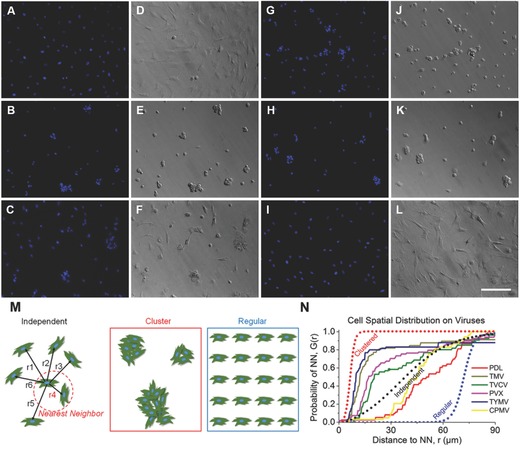
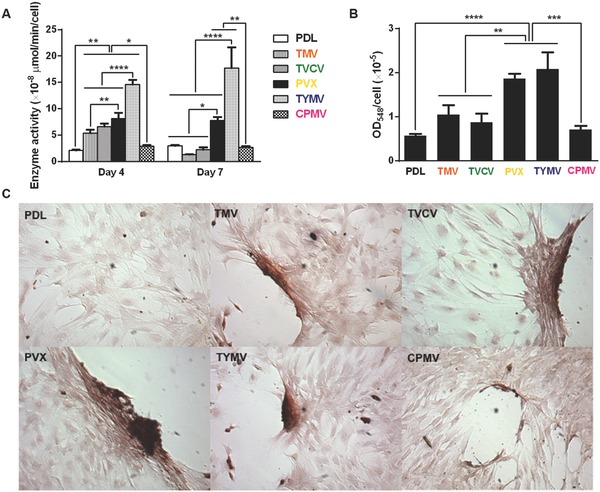
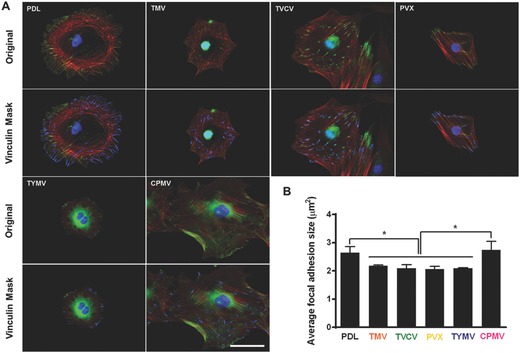
There are few methodologies that allow manipulating a biomaterial surface at nanometer scale, which controllably influence different cellular functions. In this study, virus nanoparticles with different structural features are selected to prepare 2D substrates with defined nanoscale topographies and the cellular responses are investigated. It is demonstrated that the viral nanoparticle based substrates could accelerate and enhance osteogenesis of bone derived mesenchymal stem cells as indicated by the upregulation of osteogenic markers, including bone morphogenetic protein-2, osteocalcin, and osteopontin, at both gene and protein expression levels. Moreover, alkaline phosphatase activity and calcium mineralization, both indicators for a -successful bone formation, are also increased in cells grown on these nanoscale possessed substrates. These discoveries and developments present a new paradigm for nanoscale engineering of a biomaterial surface.
Keywords: biomaterials; mesenchymal stem cells; nanotopography; osteogenesis; virus nanoparticles.
Figures
Similar articles
-
Upregulation of osteogenesis of mesenchymal stem cells with virus-based thin films.Nanotheranostics. 2018 Jan 1;2(1):42-58. doi: 10.7150/ntno.19974. eCollection 2018. Nanotheranostics. 2018. PMID: 29291162 Free PMC article. Review.
-
Knockdown of SLC41A1 magnesium transporter promotes mineralization and attenuates magnesium inhibition during osteogenesis of mesenchymal stromal cells.Stem Cell Res Ther. 2017 Feb 21;8(1):39. doi: 10.1186/s13287-017-0497-2. Stem Cell Res Ther. 2017. PMID: 28222767 Free PMC article.
-
Nanotopographical Cues Mediate Osteogenesis of Stem Cells on Virus Substrates through BMP-2 Intermediate.Nano Lett. 2019 Dec 11;19(12):8372-8380. doi: 10.1021/acs.nanolett.9b02001. Epub 2019 Jul 24. Nano Lett. 2019. PMID: 31296009
-
Inhibitory effect of alcohol on osteogenic differentiation in human bone marrow-derived mesenchymal stem cells.Alcohol Clin Exp Res. 2004 Mar;28(3):468-79. doi: 10.1097/01.alc.0000118315.58404.c1. Alcohol Clin Exp Res. 2004. PMID: 15084905
-
Pulsed electromagnetic fields stimulate osteogenic differentiation in human bone marrow and adipose tissue derived mesenchymal stem cells.Bioelectromagnetics. 2014 Sep;35(6):426-36. doi: 10.1002/bem.21862. Epub 2014 Aug 6. Bioelectromagnetics. 2014. PMID: 25099126
Cited by
-
Valence State Manipulation of Cerium Oxide Nanoparticles on a Titanium Surface for Modulating Cell Fate and Bone Formation.Adv Sci (Weinh). 2017 Dec 18;5(2):1700678. doi: 10.1002/advs.201700678. eCollection 2018 Feb. Adv Sci (Weinh). 2017. PMID: 29610729 Free PMC article.
-
A cigarette filter-derived biomimetic cardiac niche for myocardial infarction repair.Bioact Mater. 2024 Feb 14;35:362-381. doi: 10.1016/j.bioactmat.2024.02.012. eCollection 2024 May. Bioact Mater. 2024. PMID: 38379697 Free PMC article.
-
The Role of the Microenvironment in Controlling the Fate of Bioprinted Stem Cells.Chem Rev. 2020 Oct 14;120(19):11056-11092. doi: 10.1021/acs.chemrev.0c00126. Epub 2020 Jun 19. Chem Rev. 2020. PMID: 32558555 Free PMC article. Review.
-
Upregulation of osteogenesis of mesenchymal stem cells with virus-based thin films.Nanotheranostics. 2018 Jan 1;2(1):42-58. doi: 10.7150/ntno.19974. eCollection 2018. Nanotheranostics. 2018. PMID: 29291162 Free PMC article. Review.
-
Biocompatibility study of tobacco mosaic virus nanoparticles on human alveolar bone cells.J Oral Biol Craniofac Res. 2022 May-Jun;12(3):363-369. doi: 10.1016/j.jobcr.2022.04.005. Epub 2022 Apr 19. J Oral Biol Craniofac Res. 2022. PMID: 35514677 Free PMC article.
References
-
- a) Lee C. H., Shin H. J., Cho I. H., Kang Y. M., Kim I. A., Park K. D., Shin J. W., Biomaterials 2005, 26, 1261; - PubMed
- b) Andersson A. S., Brink J., Lidberg U., Sutherland D. S., IEEE Trans. Nanobiosci. 2003, 2, 49; - PubMed
- c) Fukushima N., Ohkawa H., Crit. Rev. Oncol. Hematol. 1995, 20, 255. - PubMed
-
- a) Bashur C. A., Dahlgren L. A., Goldstein A. S., Biomaterials 2006, 27, 5681; - PubMed
- b) Dalby M. J., Gadegaard N., Wilkinson C. D., J. Biomed. Mater. Res. A 2008, 84, 973; - PubMed
- c) Stevens M. M., George J. H., Science 2005, 310, 1135; - PubMed
- d) Draghi L., Cigada A., J. Appl. Biomater. Biomech. 2007, 5, 61. - PubMed
-
- a) Arnold M., Cavalcanti‐Adam E. A., Glass R., Blummel J., Eck W., Kantlehner M., Kessler H., Spatz J. P., Chemphyschem 2004, 5, 383; - PubMed
- b) He J., Zhou W., Zhou X., Zhong X., Zhang X., Wan P., Zhu B., Chen W., J. Mater. Sci. Mater. Med. 2008, 19, 3465; - PubMed
- c) Mendonca G., Mendonca D. B., Aragao F. J., Cooper L. F., Biomaterials 2008, 29, 3822; - PubMed
- d) Yim E. K., Reano R. M., Pang S. W., Yee A. F., Chen C. S., Leong K. W., Biomaterials 2005, 26, 5405; - PMC - PubMed
- e) Wan Y., Wang Y., Liu Z., Qu X., Han B., Bei J., Wang S., Biomaterials 2005, 26, 4453; - PubMed
- f) Liu Q., Cen L., Yin S., Chen L., Liu G., Chang J., Cui L., Biomaterials 2008, 29, 4792. - PubMed
LinkOut - more resources
Full Text Sources
Other Literature Sources
Research Materials