

Poly(benzoquinonyl sulfide) as a High-Energy Organic Cathode for Rechargeable Li and Na Batteries
- PMID: 27980977
- PMCID: PMC5115381
- DOI: 10.1002/advs.201500124
Poly(benzoquinonyl sulfide) as a High-Energy Organic Cathode for Rechargeable Li and Na Batteries
Abstract
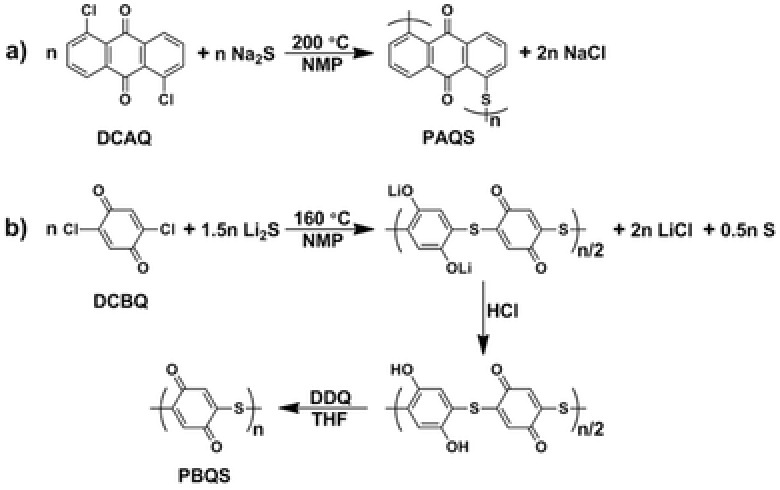
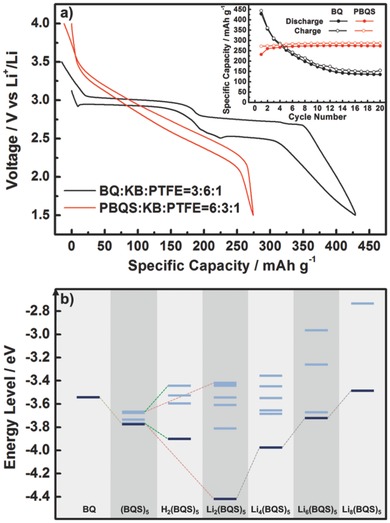
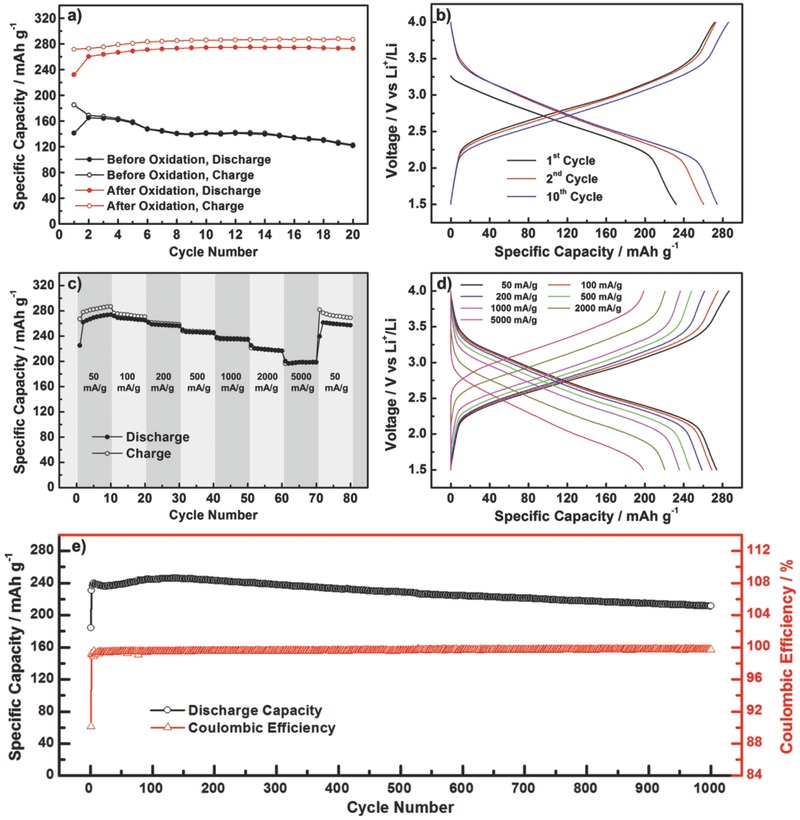
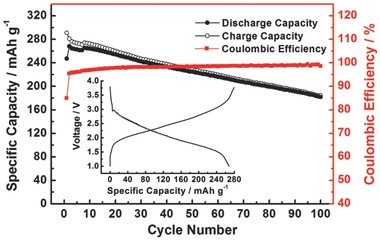
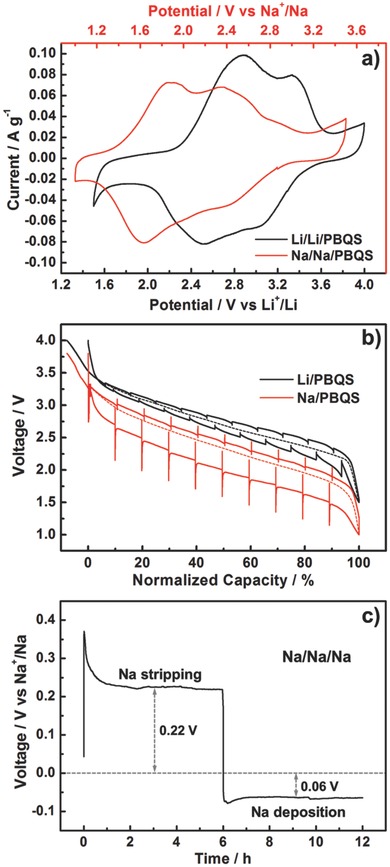
In concern of resource sustainability and environmental friendliness, organic electrode materials for rechargeable batteries have attracted increasing attentions in recent years. However, for many researchers, the primary impression on organic cathode materials is the poor cycling stability and low energy density, mainly due to the unfavorable dissolution and low redox potential, respectively. Herein, a novel polymer cathode material, namely poly(benzoquinonyl sulfide) (PBQS) is reported, for either rechargeable Li or Na battery. Remarkably, PBQS shows a high energy density of 734 W h kg-1 (2.67 V × 275 mA h g-1) in Li battery, or 557 W h kg-1 (2.08 V × 268 mA h g-1) in Na battery, which exceeds those of most inorganic Li or Na intercalation cathodes. Moreover, PBQS also demonstrates excellent long-term cycling stability (1000 cycles, 86%) and superior rate capability (5000 mA g-1, 72%) in Li battery. Besides the exciting battery performance, investigations on the structure-property relationship between benzoquinone (BQ) and PBQS, and electrochemical behavior difference between Li-PBQS battery and Na-PBQS battery, also provide significant insights into developing better Li-organic and Na-organic batteries beyond conventional Li-ion batteries.
Keywords: lithium batteries; organic cathodes; polymers; quinones; sodium batteries.
Figures
Similar articles
-
Benzoquinone-Pyrrole Polymers as Cost-Effective Cathodes toward Practical Organic Batteries.ACS Appl Mater Interfaces. 2022 Jun 8;14(22):25566-25575. doi: 10.1021/acsami.2c05703. Epub 2022 May 25. ACS Appl Mater Interfaces. 2022. PMID: 35611969
-
The Li-ion rechargeable battery: a perspective.J Am Chem Soc. 2013 Jan 30;135(4):1167-76. doi: 10.1021/ja3091438. Epub 2013 Jan 18. J Am Chem Soc. 2013. PMID: 23294028
-
Challenges and prospects of lithium-sulfur batteries.Acc Chem Res. 2013 May 21;46(5):1125-34. doi: 10.1021/ar300179v. Epub 2012 Oct 25. Acc Chem Res. 2013. PMID: 23095063
-
Redox-Active High-Performance Polyimides as Versatile Electrode Materials for Organic Lithium- and Sodium-Ion Batteries.ACS Appl Mater Interfaces. 2024 Sep 18;16(37):48722-48735. doi: 10.1021/acsami.3c10722. Epub 2023 Dec 26. ACS Appl Mater Interfaces. 2024. PMID: 38148122 Review.
-
Recent Progress in Organic Electrodes for Li and Na Rechargeable Batteries.Adv Mater. 2018 Oct;30(42):e1704682. doi: 10.1002/adma.201704682. Epub 2018 Mar 27. Adv Mater. 2018. PMID: 29582467 Review.
Cited by
-
Probing electrochemical reactions in organic cathode materials via in operando infrared spectroscopy.Nat Commun. 2018 Feb 14;9(1):661. doi: 10.1038/s41467-018-03114-1. Nat Commun. 2018. PMID: 29445156 Free PMC article.
-
Graphene composite 3,4,9,10-perylenetetracarboxylic sodium salts with a honeycomb structure as a high performance anode material for lithium ion batteries.Nanoscale Adv. 2021 Jun 21;3(15):4561-4571. doi: 10.1039/d1na00366f. eCollection 2021 Jul 27. Nanoscale Adv. 2021. PMID: 36133480 Free PMC article.
-
Lithium superoxide encapsulated in a benzoquinone anion matrix.Proc Natl Acad Sci U S A. 2021 Dec 21;118(51):e2019392118. doi: 10.1073/pnas.2019392118. Proc Natl Acad Sci U S A. 2021. PMID: 34903644 Free PMC article.
-
Electrode Materials for High-Performance Sodium-Ion Batteries.Materials (Basel). 2019 Jun 17;12(12):1952. doi: 10.3390/ma12121952. Materials (Basel). 2019. PMID: 31212966 Free PMC article. Review.
-
1,4,5,8-Naphthalenetetracarboxylic dianhydride grafted phthalocyanine macromolecules as an anode material for lithium ion batteries.Nanoscale Adv. 2021 Mar 27;3(11):3199-3215. doi: 10.1039/d1na00115a. eCollection 2021 Jun 1. Nanoscale Adv. 2021. PMID: 36133650 Free PMC article.
References
-
- Armand M., Tarascon J.‐M., Nature 2008, 451, 652. - PubMed
-
- Van Noorden R., Nature 2014, 507, 26. - PubMed
-
- Whittingham M. S., Chem. Rev. 2014, 114, 11414. - PubMed
-
- Bruce P. G., Freunberger S. A., Hardwick L. J., Tarascon J.‐M., Nat. Mater. 2012, 11, 19. - PubMed
-
- Manthiram A., Fu Y., Chung S.‐H., Zu C., Su Y.‐S., Chem. Rev. 2014, 114, 11751. - PubMed
LinkOut - more resources
Full Text Sources
Other Literature Sources