. 2016 Nov 25:13:138-153.
doi: 10.1016/j.nicl.2016.11.023. eCollection 2017.

Automated white matter fiber tract identification in patients with brain tumors

Affiliations

Automated white matter fiber tract identification in patients with brain tumors

Lauren J O'Donnell et al. Neuroimage Clin. .

Abstract

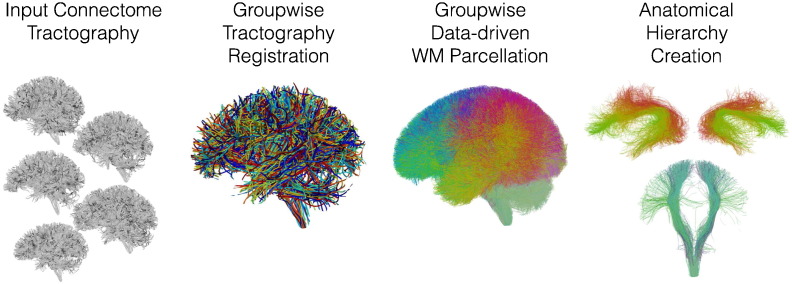
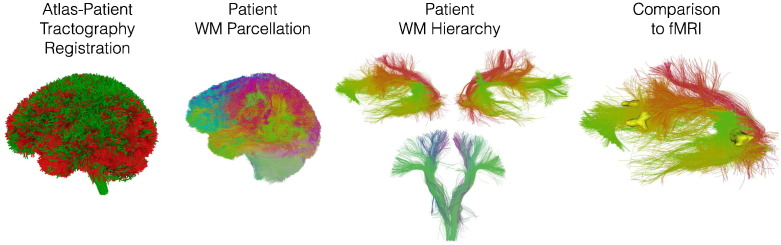
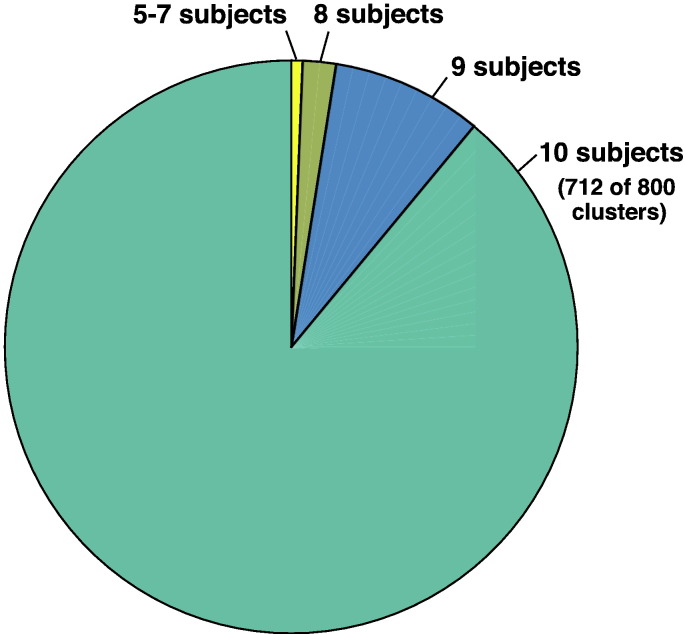
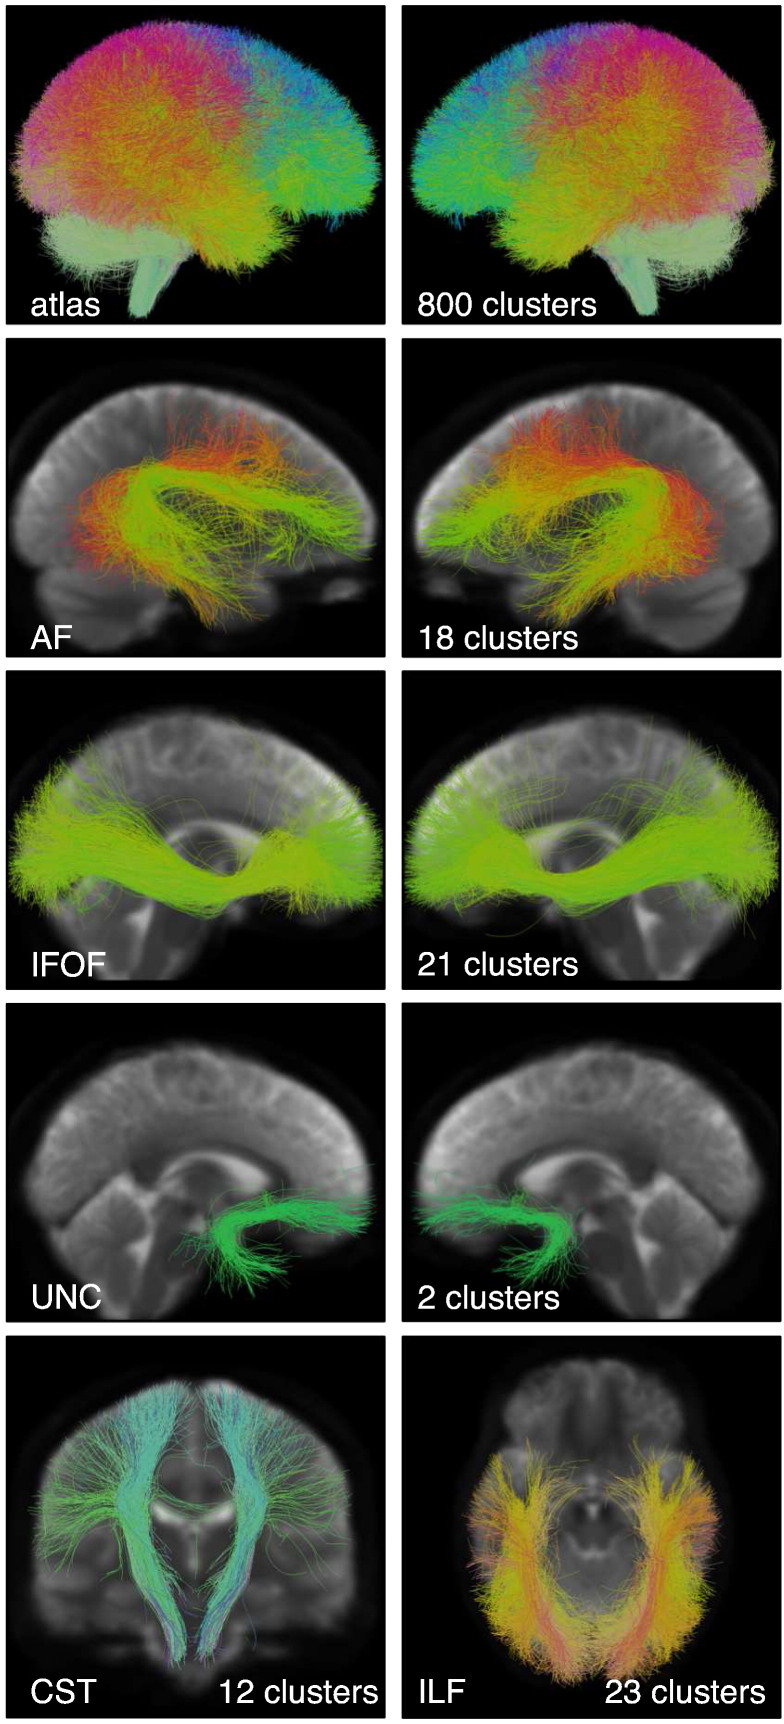
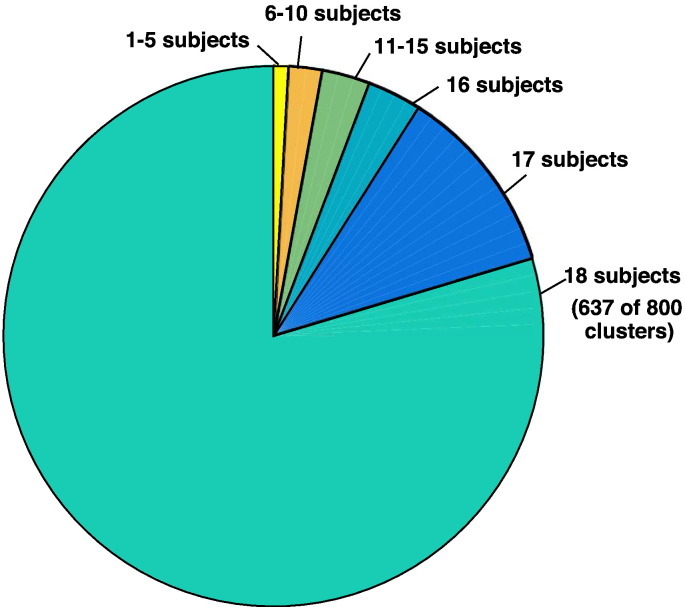
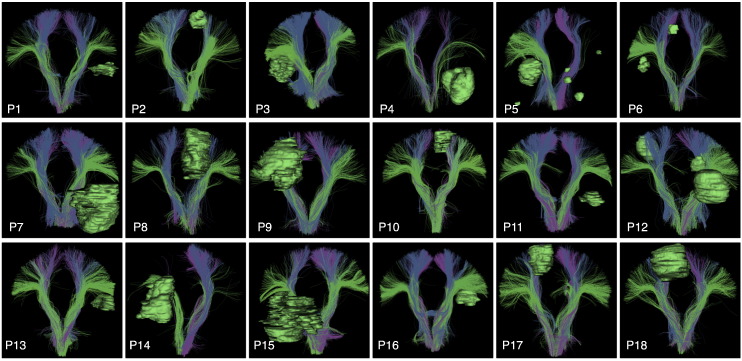
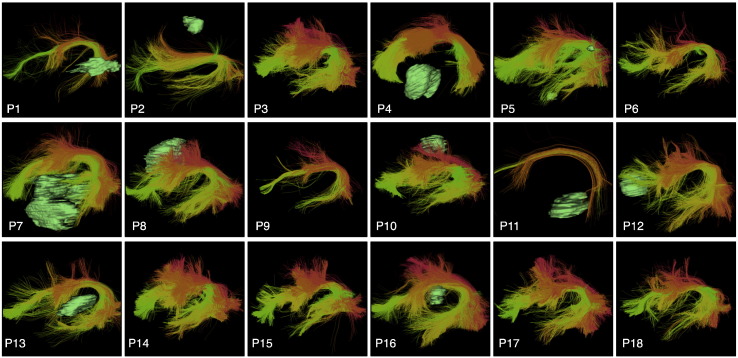
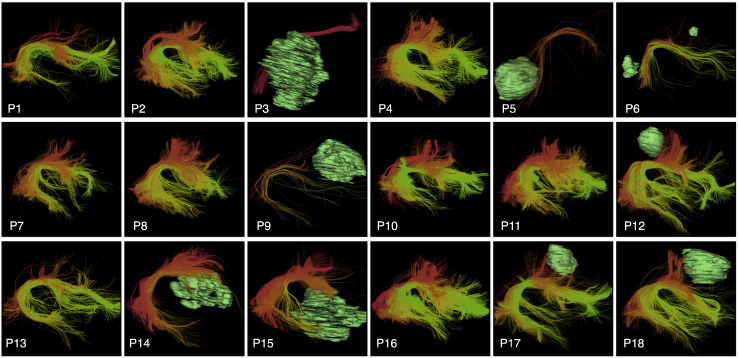
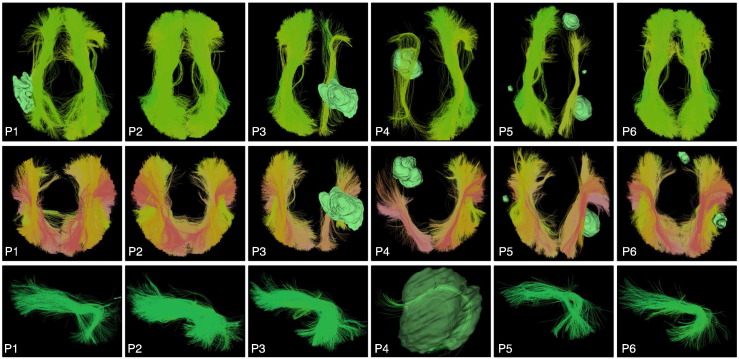
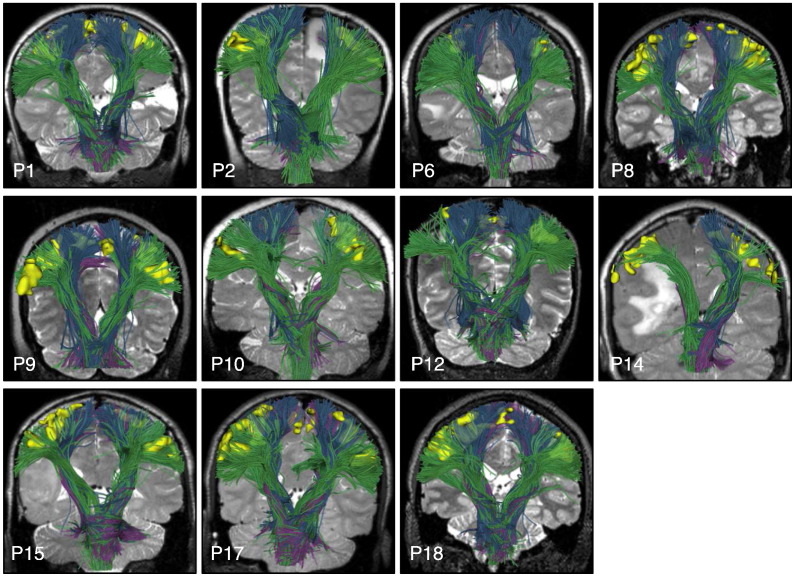
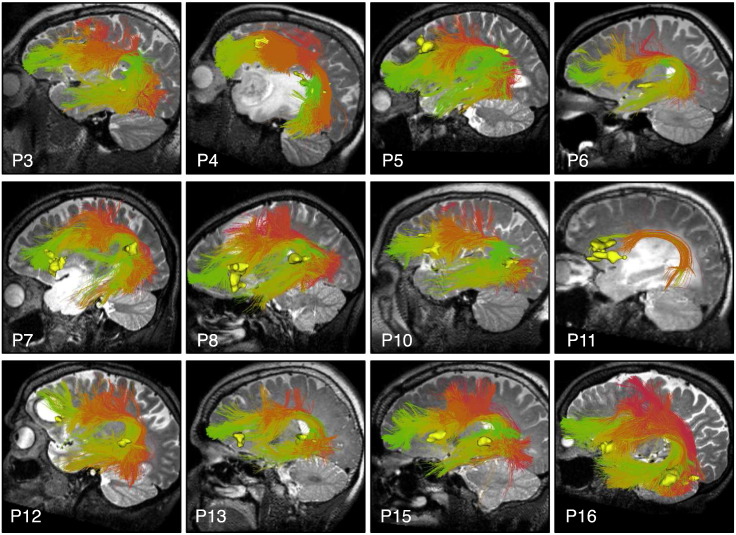
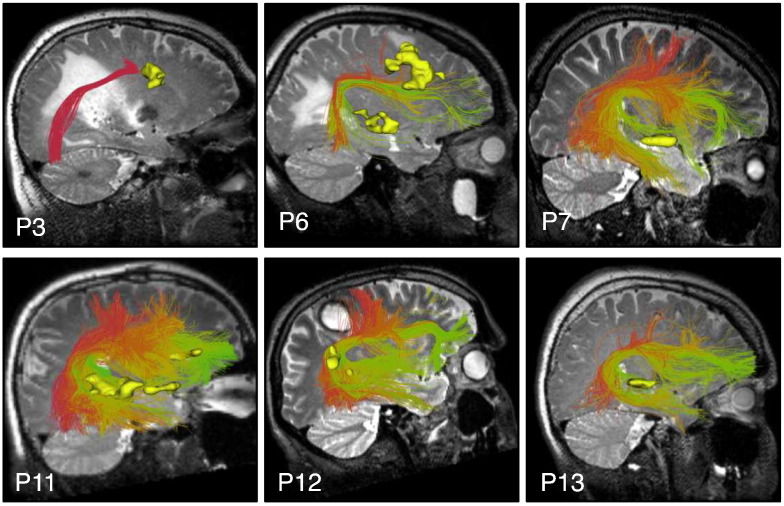
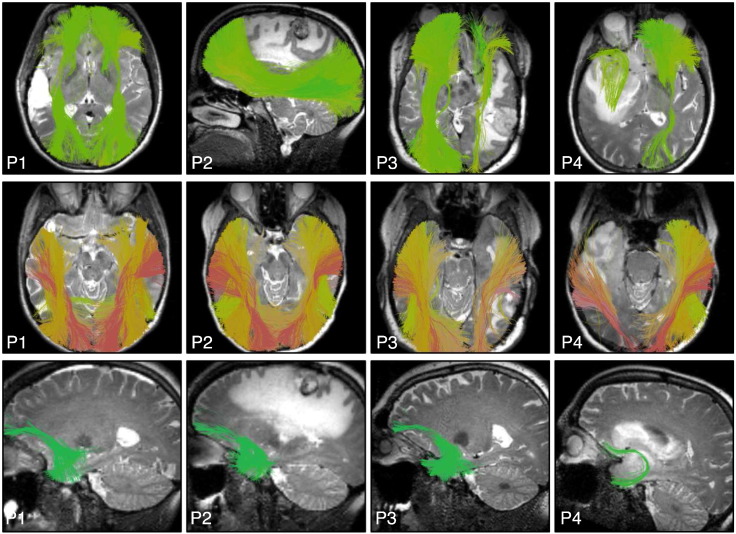
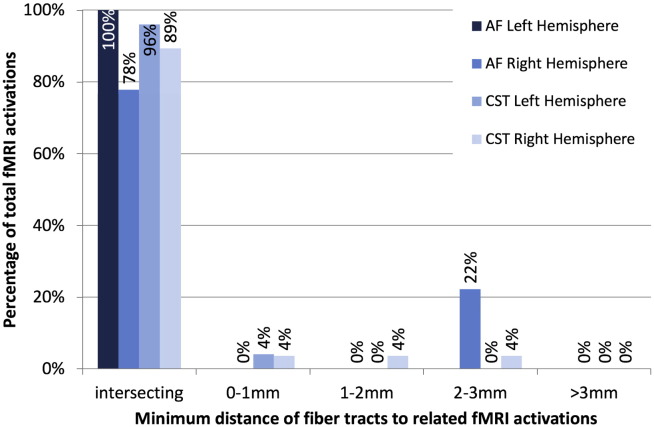
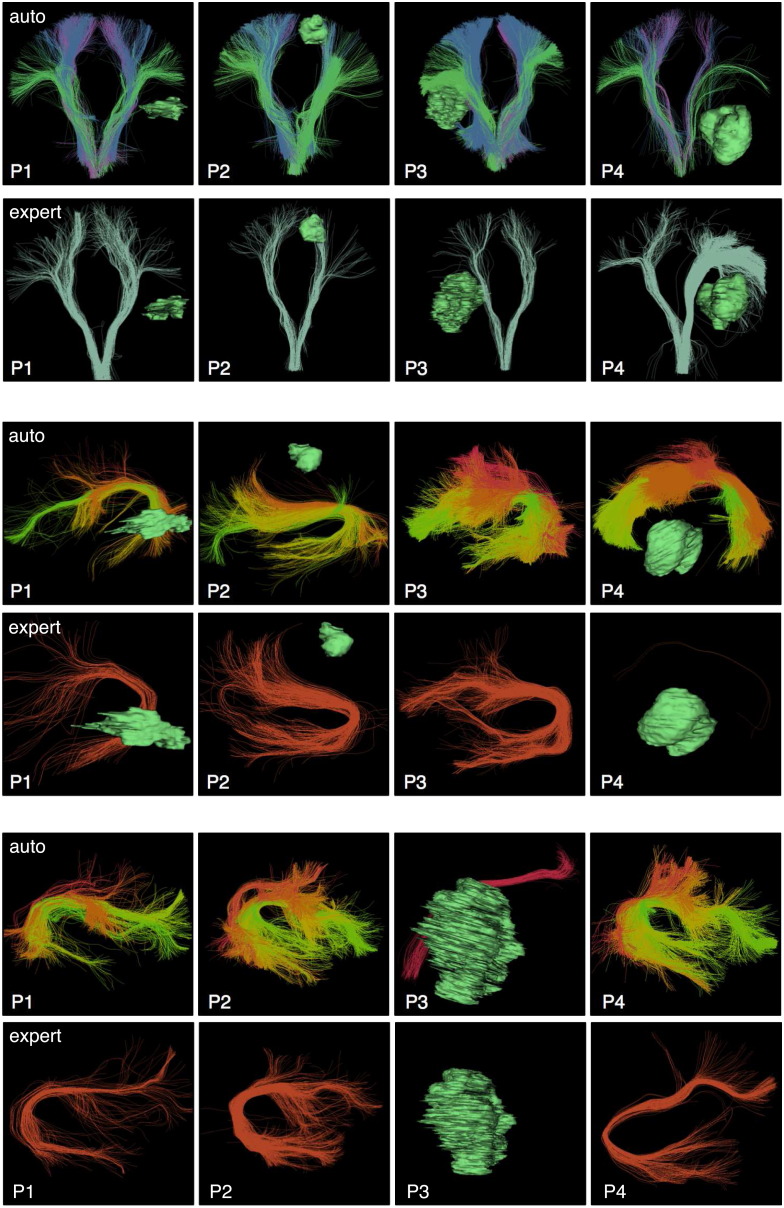
We propose a method for the automated identification of key white matter fiber tracts for neurosurgical planning, and we apply the method in a retrospective study of 18 consecutive neurosurgical patients with brain tumors. Our method is designed to be relatively robust to challenges in neurosurgical tractography, which include peritumoral edema, displacement, and mass effect caused by mass lesions. The proposed method has two parts. First, we learn a data-driven white matter parcellation or fiber cluster atlas using groupwise registration and spectral clustering of multi-fiber tractography from healthy controls. Key fiber tract clusters are identified in the atlas. Next, patient-specific fiber tracts are automatically identified using tractography-based registration to the atlas and spectral embedding of patient tractography. Results indicate good generalization of the data-driven atlas to patients: 80% of the 800 fiber clusters were identified in all 18 patients, and 94% of the 800 fiber clusters were found in 16 or more of the 18 patients. Automated subject-specific tract identification was evaluated by quantitative comparison to subject-specific motor and language functional MRI, focusing on the arcuate fasciculus (language) and corticospinal tracts (motor), which were identified in all patients. Results indicate good colocalization: 89 of 95, or 94%, of patient-specific language and motor activations were intersected by the corresponding identified tract. All patient-specific activations were within 3mm of the corresponding language or motor tract. Overall, our results indicate the potential of an automated method for identifying fiber tracts of interest for neurosurgical planning, even in patients with mass lesions.

Keywords: Diffusion MRI; Fiber tract; Neurosurgery; Tractography; Tumor; White matter.


Figures

Fig. 1
Fig. 1
The overall pipeline for learning the data-driven white matter (WM) parcellation includes groupwise tractography registration, creation of a white matter parcellation (fiber cluster atlas) using groupwise spectral clustering of fibers, and visualization and organization of atlas clusters into an anatomical hierarchy using 3D Slicer. In the tractography registration, tracts from each subject are shown in a different color. In the white matter parcellation, colors are automatically generated from the spectral embedding, where each fiber cluster has a unique color, and similar clusters have similar colors.
Fig. 2
Fig. 2
The pipeline for identification of key white matter (WM) tracts in patient data includes tractography registration, white matter parcellation via spectral embedding of fibers, and visualization of key patient-specific tracts using an anatomical hierarchy. In this study, patient-specific tracts are compared to patient-specific fMRI by computing distances to related functional activations.
Fig. 3
Fig. 3
Data-driven white matter parcellation: cluster consistency across 10 HCP datasets. Of the 800 clusters, 712 (89%) are detected in all 10 subjects, and 780 (98%) are detected in at least 9 of 10 subjects. We note that this cluster consistency result is based on the 10,000 fibers that were randomly sampled from each subject for efficient groupwise clustering, meaning that on average there would be 12.5 fibers sampled per cluster per subject. Using a higher number of fibers per subject will increase this measure of cluster consistency (by increasing the number of clusters that can be detected in all 10 subjects), while increasing the computational run time.
Fig. 4
Fig. 4
Creation of the fiber cluster atlas. Visualization of the data-driven white matter parcellation (top row) and the expert-defined anatomical hierarchies, which define structures of interest for neurosurgical planning. Note that each hierarchy is the union of several clusters. The number of clusters grouped into each hierarchy is shown. The image in the background is the average DWI baseline image from the ten subjects included in the atlas.
Fig. 5
Fig. 5
Cluster consistency across 18 neurosurgical patient datasets. Application of the cluster atlas to whole-brain tractography data from 18 patients indicates good generalization of the atlas to the patient dataset despite the presence of mass lesions. Of the 800 clusters, 637 (80%) are detected in all 18 patients, and 754 (94%) are detected in at least 16 of 18 patients. Note that clusters are found bilaterally, so this measure indicates the presence of the cluster in at least one hemisphere of each patient.
Fig. 6
Fig. 6
Automatically detected corticospinal tract clusters in all patient datasets (anterior view). Tumor surfaces are shown in green. Each cluster has a unique color, and similar clusters have similar colors. Multiple clusters are included in the corticospinal tract hierarchy, which groups putative corticospinal tract clusters for automated visualization.
Fig. 7
Fig. 7
Automatically detected left arcuate fasciculus tract clusters in all patient datasets (view from left). Tumor surfaces are shown in green when they are near the tract. Each cluster has a unique color, and similar clusters have similar colors. Multiple clusters are included in the arcuate fasciculus tract hierarchy, which groups putative arcuate fasciculus clusters for automated visualization.
Fig. 8
Fig. 8
Automatically detected right arcuate fasciculus tract clusters in all patient datasets (view from right). Tumor surfaces are shown in green when they are near the tract. Each cluster has a unique color, and similar clusters have similar colors. Multiple clusters are included in the arcuate fasciculus tract hierarchy, which groups putative arcuate fasciculus clusters for automated visualization.
Fig. 9
Fig. 9
Automatically detected inferior fronto-occipital (IFOF, top row, superior view), occipito-temporal (ILF, middle row, superior view), and left uncinate (UF, bottom row, view from left) tract clusters, shown in the first six patient datasets. Tumor surfaces are shown in green when they are near the tract. Each cluster has a unique color, and similar clusters have similar colors. Multiple clusters are included in the tract hierarchies, which group putative IFOF, ILF, and UF clusters for automated visualization.
Fig. 10
Fig. 10
Automatically detected CST fiber tracts in patients with subject-specific task-based motor fMRI. Images show every patient-specific motor fMRI activation (yellow), with a T2-weighted image behind the fiber tracts, which are rendered partially transparent to better visualize the fMRI activations. All fMRI activations are intersected by CST fiber tracts except the right foot motor activation in the left hemisphere of P10 and the right hemisphere motor activations in P14.
Fig. 11
Fig. 11
Automatically detected left AF fiber tracts in patients with subject-specific task-based language fMRI. Images show patient-specific language fMRI activations (yellow) in the left hemisphere, with a T2-weighted image behind the fiber tracts. All fMRI activations are intersected by AF.
Fig. 12
Fig. 12
Automatically detected right AF fiber tracts in patients with bilateral language activations in subject-specific task-based language fMRI. Images show patient-specific language fMRI activations (yellow) in the right hemisphere, with a T2-weighted image behind the fiber tracts. All fMRI activations are intersected by right AF except putative Broca (P3 antonym task) and putative Wernicke (P6 audionaming task). Patients with language fMRI were right-handed except for P6, who had apparent right-hemispheric language lateralization according to fMRI.
Fig. 13
Fig. 13
Automatically detected fiber tracts in the first four patient datasets illustrate example results in IFOF, ILF, and UF. A T2-weighted image is shown behind the fiber tracts.
Fig. 14
Fig. 14
Quantitative results relating patient-specific automatically identified fiber tracts to patient-specific fMRI activations. Most fiber tracts intersect the related functional activations, and all are under 3mm from the related activations.
Fig. 15
Fig. 15
Comparison of expert tract selection versus automatic tract identification: visualizaton of results in the first 4 patient datasets in CST (top), left AF (middle), and right AF (bottom). In general, the automatic method tends to identify larger structures. All tracts were detected by both methods except for P3 right AF, which was not detected by the expert selection using anatomical ROIs. (Note that expert-selected left AF was detected in P4 but contains two fibers and is minimally visible.)

References

    1. Al Masri O. An essay on the human corticospinal tract: history, development, anatomy, and connections. Neuroanatomy. 2011;10:1–4.
    1. Andersson J.L., Sotiropoulos S.N. An integrated approach to correction for off-resonance effects and subject movement in diffusion MR imaging. Neuroimage. 2016;125:1063–1078. - PMC - PubMed
    1. Archip N., Clatz O., Whalen S., Kacher D., Fedorov A., Kot A., Chrisochoides N., Jolesz F., Golby A., Black P.M., Warfield S.K. Non-rigid alignment of pre-operative MRI, fMRI, and DT-MRI with intra-operative MRI for enhanced visualization and navigation in image-guided neurosurgery. Neuroimage. 2007;35(2):609–624. - PMC - PubMed
    1. Bastiani M., Shah N.J., Goebel R., Roebroeck A. Human cortical connectome reconstruction from diffusion weighted MRI: the effect of tractography algorithm. Neuroimage. 2012;62(3):1732–1749. - PubMed
    1. Behrens T., Berg H.J., Jbabdi S., Rushworth M., Woolrich M. Probabilistic diffusion tractography with multiple fibre orientations: what can we gain? NeuroImage. 2007;34(1):144–155. - PMC - PubMed

Publication types