. 2017 Jan;4(1):011005.
doi: 10.1117/1.JMI.4.1.011005. Epub 2016 Dec 2.

INSIDE in-beam positron emission tomography system for particle range monitoring in hadrontherapy

Affiliations

INSIDE in-beam positron emission tomography system for particle range monitoring in hadrontherapy

Maria Giuseppina Bisogni et al. J Med Imaging (Bellingham). 2017 Jan.

Abstract

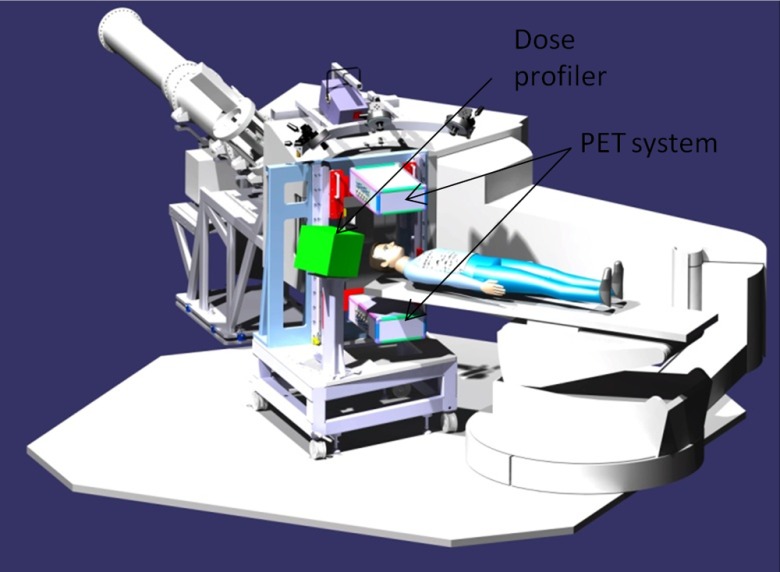
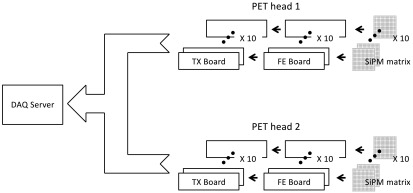
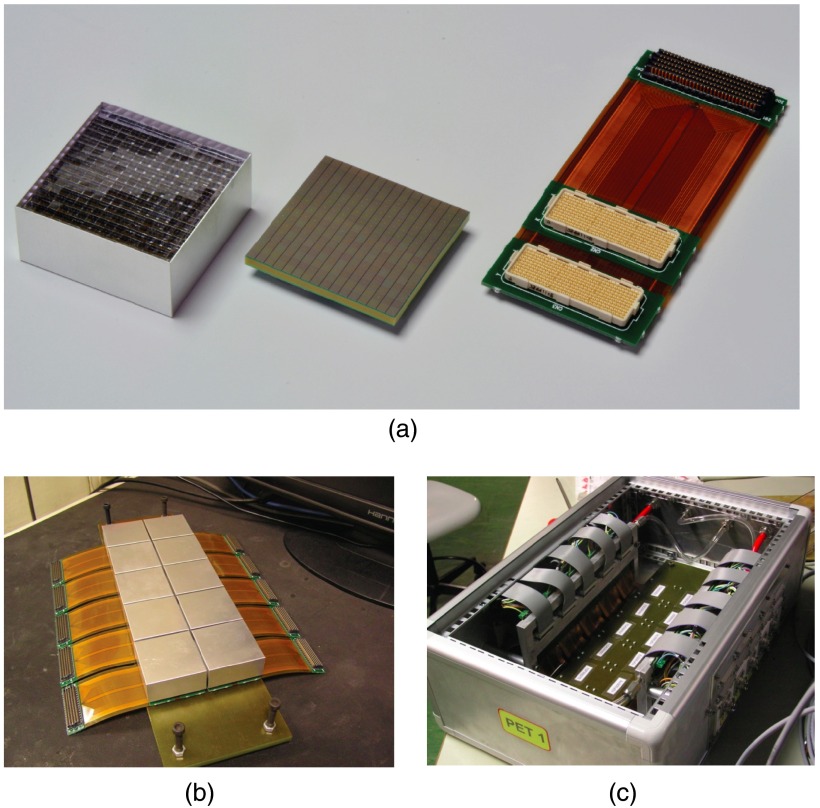
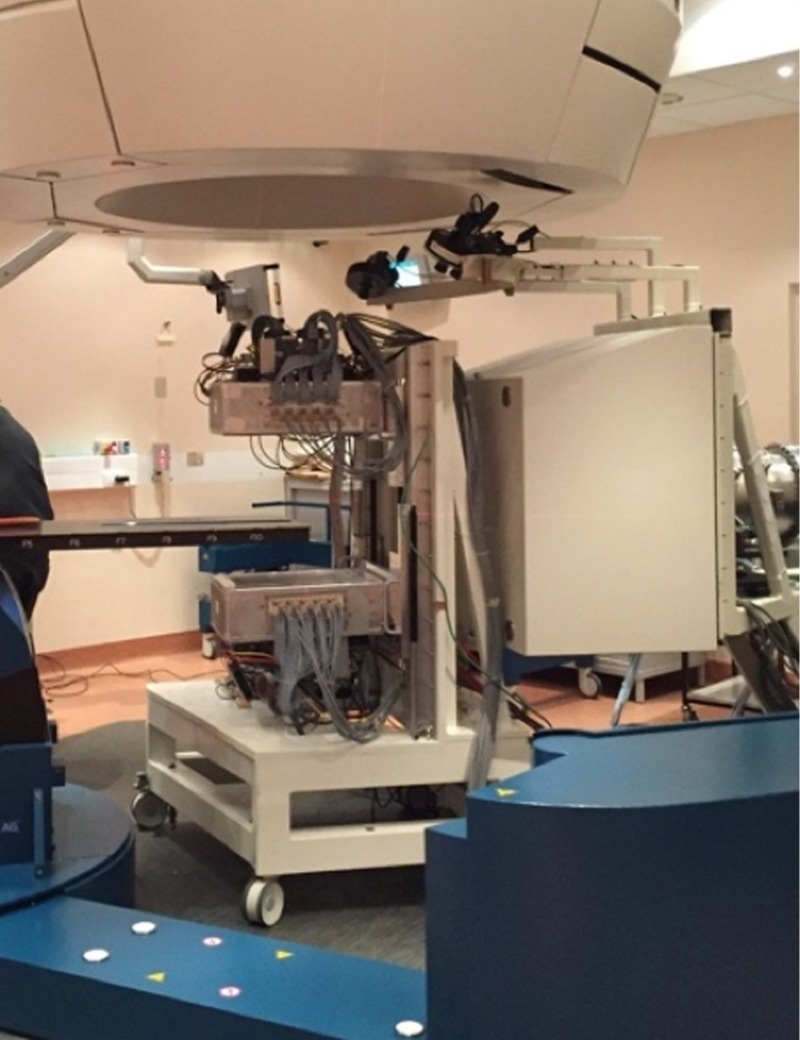
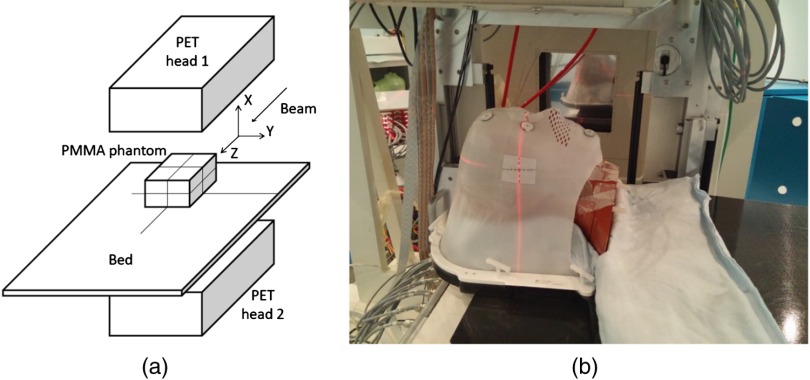
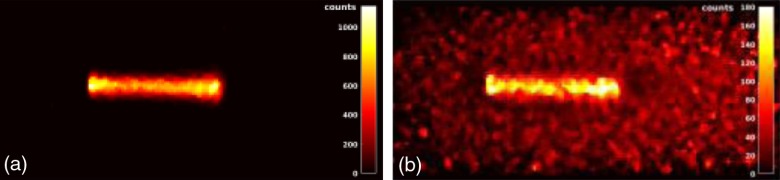
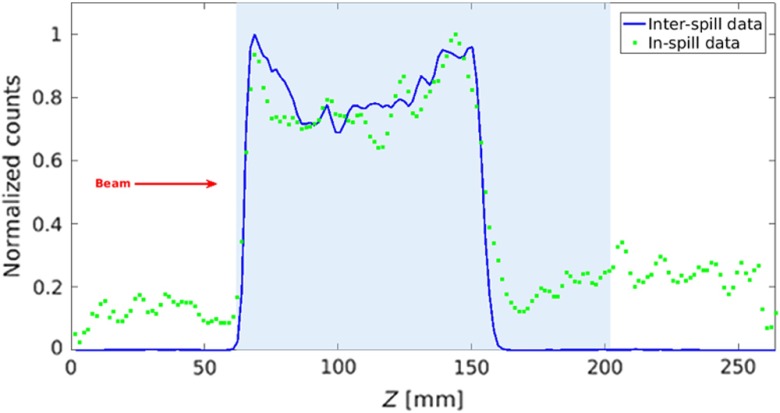
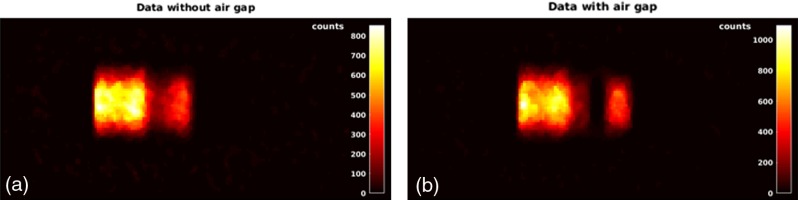
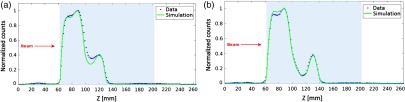
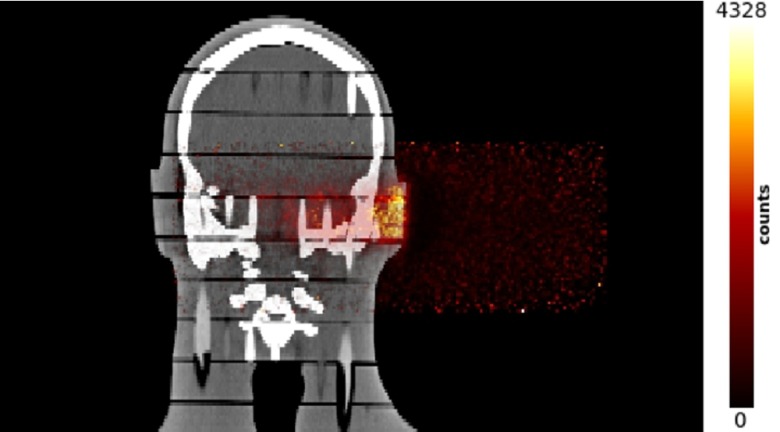
The quality assurance of particle therapy treatment is a fundamental issue that can be addressed by developing reliable monitoring techniques and indicators of the treatment plan correctness. Among the available imaging techniques, positron emission tomography (PET) has long been investigated and then clinically applied to proton and carbon beams. In 2013, the Innovative Solutions for Dosimetry in Hadrontherapy (INSIDE) collaboration proposed an innovative bimodal imaging concept that combines an in-beam PET scanner with a tracking system for charged particle imaging. This paper presents the general architecture of the INSIDE project but focuses on the in-beam PET scanner that has been designed to reconstruct the particles range with millimetric resolution within a fraction of the dose delivered in a treatment of head and neck tumors. The in-beam PET scanner has been recently installed at the Italian National Center of Oncologic Hadrontherapy (CNAO) in Pavia, Italy, and the commissioning phase has just started. The results of the first beam test with clinical proton beams on phantoms clearly show the capability of the in-beam PET to operate during the irradiation delivery and to reconstruct on-line the beam-induced activity map. The accuracy in the activity distal fall-off determination is millimetric for therapeutic doses.

Keywords: hadrontherapy; particle range verification; positron emission tomography.


Figures

Fig. 1
Fig. 1
Solid model of the INSIDE system in the measurement position, with the two heads PET subsystem and the dose profiler. The beam line and nozzle of the CNAO treatment room are shown in gray.
Fig. 2
Fig. 2
Conceptual block diagram of the PET system comprehending the SiPM matrices, the FE boards, and the DAQ components.
Fig. 3
Fig. 3
(a) The crystal matrix (left), the SiPM matrix (center), and the hybrid rigid-flex circuit (right; courtesy of Hamamatsu Photonics27). (b) 10 detection modules assembled in the 2×5 array. (c) Inside of the PET box with details of the detection modules (on the back), FE boards (on the sides), and water cooling.
Fig. 4
Fig. 4
The INSIDE in-beam PET system fully assembled and installed in one of the CNAO treatment rooms.
Fig. 5
Fig. 5
(a) Lay-out (not to scale) of the set-up adopted for the PMMA phantoms and reference axis. (b) Set-up adopted for the anthropomorphic phantom acquisitions that reproduces a typical clinical treatment setting. The PET top head is visible in the upper part of the picture.
Fig. 6
Fig. 6
(a) Interspill and (b) in-spill reconstructed events on the central slice parallel to the PET heads.
Fig. 7
Fig. 7
Profiles normalized to the maximum of the interspill (blue line) and in-spill data (green squares). The light blue area indicates the phantom position within the FoV.
Fig. 8
Fig. 8
(a) Image (central slice) of the phantom A obtained for an acquisition time of 519 s. (b) Image (central slice) of the phantom B obtained for an acquisition time of 485 s. In both acquisitions, only interspill and after-treatment data are considered.
Fig. 9
Fig. 9
Normalized profiles of the simulated (continuous green line) and experimental (blue dots) images in case of (a) phantom A and (b) phantom B.
Fig. 10
Fig. 10
Image (on the coronal view) of the CT of the anthropomorphic phantom fused with the reconstructed activation map generated in the phantom by a proton beam shaped following a real treatment plan with proton energies ranging from 74 to 134 MeV. The delivered dose was 0.9 Gy (the beam enters at the right side of the image). Only interspill data are used for the reconstruction; the after-treatment was not considered.

References

    1. Schulz-Ertner D., Tsujii H., “Particle radiation therapy using proton and heavier ion beams,” J. Clin. Oncol. 25(8), 953–964 (2007).JCONDN10.1200/JCO.2006.09.7816 - DOI - PubMed
    1. Terasawa T., et al. , “Systematic review: charged-particle radiation therapy for cancer,” Ann. Internal Med. 151(8), 556 (2009).AIMEAS10.7326/0003-4819-151-8-200910200-00145 - DOI - PubMed
    1. Knopf A.-C., Lomax A., “In vivo proton range verification: a review,” Phys. Med. Biol. 58(15), R131 (2013).PHMBA710.1088/0031-9155/58/15/R131 - DOI - PubMed
    1. Parodi K., “On- and off-line monitoring of ion beam treatment,” Nucl. Instrum. Methods Phys. Res. Sect. A 809, 113–119 (2016).10.1016/j.nima.2015.06.056 - DOI
    1. Del Guerra A., Belcari N., Bisogni M. G., “Positron emission tomography: its 65 years,” La Rivista Del Nuovo Cimento 39(4), 155–223 (2016).RNUCAC10.1393/ncr/i2016-10122-6 - DOI