. 2017 Mar 1;595(5):1725-1741.
doi: 10.1113/JP273752. Epub 2017 Jan 25.

Loop G in the GABAA receptor α1 subunit influences gating efficacy

Affiliations

Loop G in the GABAA receptor α1 subunit influences gating efficacy

Daniel T Baptista-Hon et al. J Physiol. .

Abstract

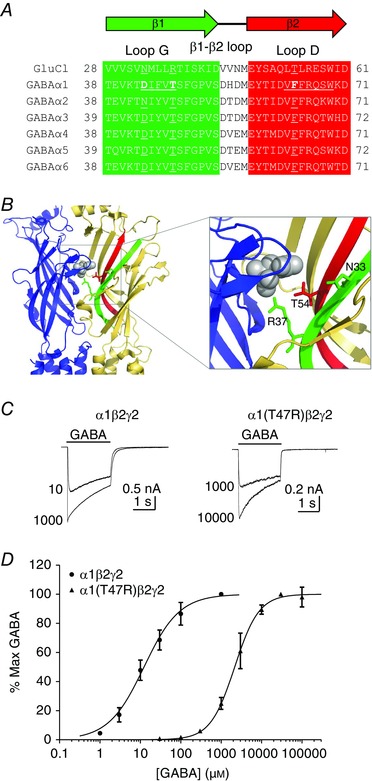
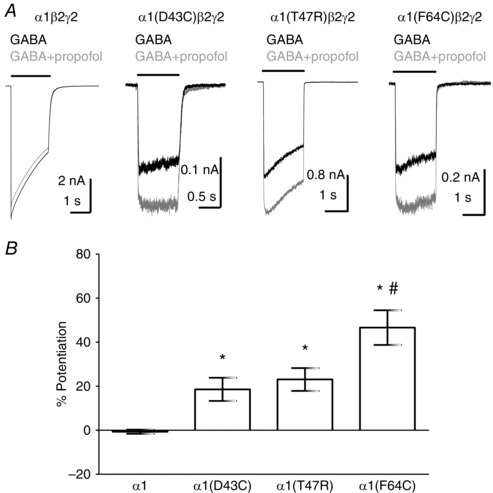
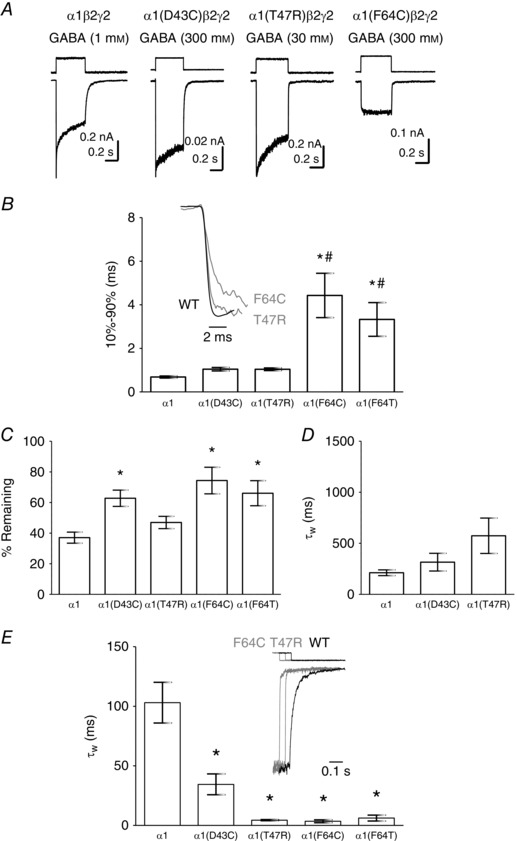
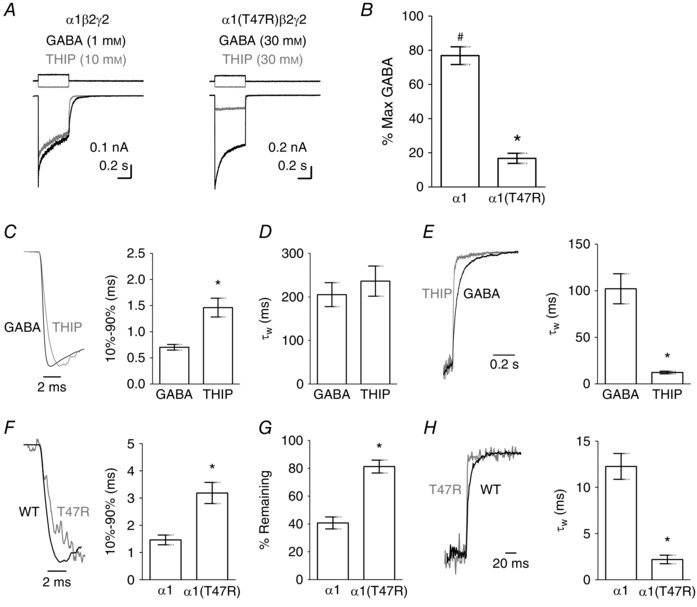
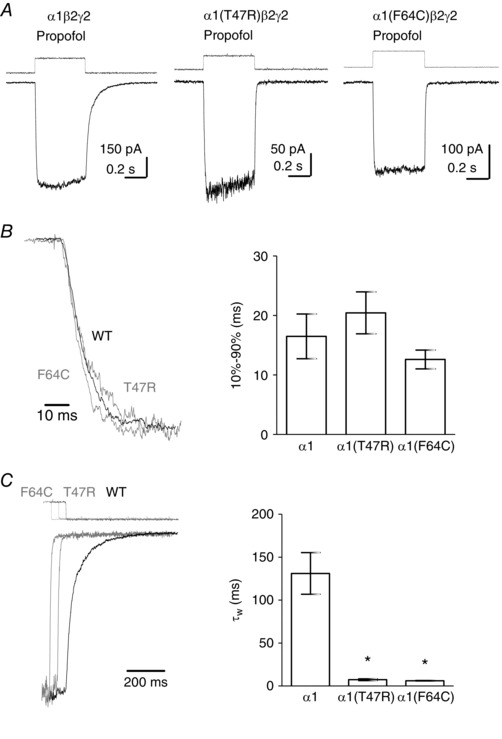
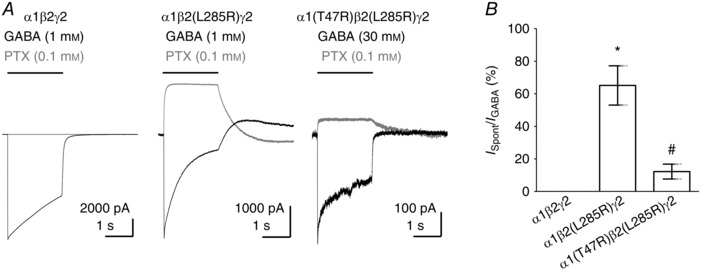
Key points: The functional importance of residues in loop G of the GABAA receptor has not been investigated. D43 and T47 in the α1 subunit are of particular significance as their structural modification inhibits activation by GABA. While the T47C substitution had no significant effect, non-conservative substitution of either residue (D43C or T47R) reduced the apparent potency of GABA. Propofol potentiated maximal GABA-evoked currents mediated by α1(D43C)β2γ2 and α1(T47R)β2γ2 receptors. Non-stationary variance analysis revealed a reduction in maximal GABA-evoked Popen , suggesting impaired agonist efficacy. Further analysis of α1(T47R)β2γ2 receptors revealed that the efficacy of the partial agonist THIP (4,5,6,7-tetrahydroisoxazolo[5,4-c]pyridine-3-ol) relative to GABA was impaired. GABA-, THIP- and propofol-evoked currents mediated by α1(T47R)β2γ2 receptors deactivated faster than those mediated by α1β2γ2 receptors, indicating that the mutation impairs agonist-evoked gating. Spontaneous gating caused by the β2(L285R) mutation was also reduced in α1(T47R)β2(L285R)γ2 compared to α1β2(L285R)γ2 receptors, confirming that α1(T47R) impairs gating independently of agonist activation.

Abstract: The modification of cysteine residues (substituted for D43 and T47) by 2-aminoethyl methanethiosulfonate in the GABAA α1 subunit loop G is known to impair activation of α1β2γ2 receptors by GABA and propofol. While the T47C substitution had no significant effect, non-conservative substitution of either residue (D43C or T47R) reduced the apparent potency of GABA. Propofol (1 μm), which potentiates sub-maximal but not maximal GABA-evoked currents mediated by α1β2γ2 receptors, also potentiated maximal currents mediated by α1(D43C)β2γ2 and α1(T47R)β2γ2 receptors. Furthermore, the peak open probabilities of α1(D43C)β2γ2 and α1(T47R)β2γ2 receptors were reduced. The kinetics of macroscopic currents mediated by α1(D43C)β2γ2 and α1(T47R)β2γ2 receptors were characterised by slower desensitisation and faster deactivation. Similar changes in macroscopic current kinetics, together with a slower activation rate, were observed with the loop D α1(F64C) substitution, known to impair both efficacy and agonist binding, and when the partial agonist THIP (4,5,6,7-tetrahydroisoxazolo[5,4-c]pyridine-3-ol) was used to activate WT or α1(T47R)β2γ2 receptors. Propofol-evoked currents mediated by α1(T47R)β2γ2 and α1(F64C)β2γ2 receptors also exhibited faster deactivation than their WT counterparts, revealing that these substitutions impair gating through a mechanism independent of orthosteric binding. Spontaneous gating caused by the introduction of the β2(L285R) mutation was also reduced in α1(T47R)β2(L285R)γ2 compared to α1β2(L285R)γ2 receptors, confirming that α1(T47R) impairs gating independently of activation by any agonist. These findings implicate movement of the GABAA receptor α1 subunit's β1 strand during agonist-dependent and spontaneous gating. Immobilisation of the β1 strand may provide a mechanism for the inhibition of gating by inverse agonists such as bicuculline.

Keywords: cys-loop receptors; pentameric ligand-gated ion channels; site-directed mutagenesis; spontaneous gating.


Figures

Figure 1
Figure 1. Loop G and loop D of C. elegans GluCl and GABAA receptor α subunits
A, amino acid sequence alignment of the mouse GABAA α1–α6 subunits and the GluCl α subunit. The β1 and β2 strands are highlighted in green and red, respectively. Residues in loop G and D of the GABAA α1 subunit are underlined. Also underlined are the homologous residues on the GABAA α2–α6 and GluCl which are relevant to this study. B, the C. elegans GluCl (Hibbs & Gouaux, 2011) model, showing the interface between two subunits (blue, primary interface; yellow, complementary interface) with the β1 and β2 strands highlighted (green and red, respectively). Bound glutamate is shown in grey. Inset shows the highlighted area in more detail. Asn33 and Arg37 are shown on the β1 strand as stick rendering in green. Thr54 is shown on the β2 strand as stick rendering in red. C, representative examples of whole‐cell currents evoked by a maximal and an approximate EC50 concentration of GABA (indicated) mediated by α1β2γ2 or α1(T47R)β2γ2 GABAA receptors. The bar indicates GABA application (2 s). D, concentration–response relationships for α1β2γ2 (circles) or α1(T47R)β2γ2 (triangles) receptors. Current amplitudes were expressed as a percentage of the maximum current amplitude recorded from each cell. The sigmoidal curve represents the logistic function fitted to the data points. [Color figure can be viewed at wileyonlinelibrary.com]
Figure 2
Figure 2. The identity of Loop G and loop D residues influences agonist efficacy
A, representative examples of whole‐cell currents mediated by α1β2γ2, α1(D43C)β2γ2, α1(T47R)β2γ2 or α1(F64C)β2γ2 receptors evoked by a maximal concentration of GABA alone (black traces) or in the presence of 1 μm propofol (grey traces). The concentration of GABA used was 1 mm for α1β2γ2, 300 mm for α1(D43C)β2γ2, 30 mm for α1(T47R)β2γ2 and 300 mm for α1(F64C)β2γ2 receptors. Propofol potentiated GABA‐evoked currents mediated by α1(D43C)β2γ2, α1(T47R)β2γ2 and α1(F64C)β2γ2 receptors. B, bar graph showing mean percentage potentiation by propofol. Propofol significantly potentiated GABA‐evoked currents mediated by α1(D43C)β2γ2, α1(T47R)β2γ2 and α1(F64C)β2γ2 receptors (* P < 0.05, P < 0.001 and P < 0.0001, respectively; one‐way ANOVA post hoc Tukey's comparison). There was also a statistically significant difference between α1(F64C)β2γ2 receptors and α1(D43C)β2γ2 or α1(T47R)β2γ2 receptors (# P < 0.05 and P < 0.001, respectively; one‐way ANOVA post hoc Tukey's comparison).
Figure 3
Figure 3. Maximal P open is reduced in α1(D43C)β2γ2 and α1(T47R)β2γ2 receptors
A, representative examples of variance and mean current calculated from 10 consecutive GABA applications to α1β2γ2 or α1(T47R)β2γ2 receptors. The application of GABA is indicated by the liquid junction current above each trace. Only the variance and mean current values following the peak of the current (black) were used in the analysis. B, mean current versus variance plot for α1β2γ2 or α1(T47R)β2γ2 receptors. The dotted line represents the parabolic function fitted to the data points. C, bar graph of mean single channel conductances. The single channel conductances for α1β2γ2, α1(D43C)β2γ2 and α1(T47R)β2γ2 receptors were 26 ± 3.2 pS (n = 8), 27 ± 2.9 pS (n = 7) and 26 ± 2.3 pS (n = 5), respectively. There was no significant difference between the means (P = 0.96; one‐way ANOVA). D, bar graph of mean maximal P open for α1β2γ2, α1(D43C)β2γ2 and α1(T47R)β2γ2 receptors. There was a statistically significant difference in P open between α1β2γ2 and α1(D43C)β2γ2 receptors and between α1β2γ2 and α1(T47R)β2γ2 receptors (* P < 0.05; one‐way ANOVA; post hoc Tukey's comparison).
Figure 4
Figure 4. The kinetics of GABA‐evoked currents mediated by α1β2γ2, α1(D43C)β2γ2, α1(T47R)β2γ2, α1(F64C)β2γ2 and α1(F64T)β2γ2 receptors
A, representative examples of GABA‐evoked currents mediated by α1β2γ2, α1(D43C)β2γ2, α1(T47R)β2γ2 and α1(F64C)β2γ2 receptors recorded from outside‐out patches. The associated square pulses indicate the junction currents corresponding to agonist application. B, (inset) representative examples of amplitude‐normalised activation phases of GABA‐evoked currents mediated by α1β2γ2 (black), α1(T47R)β2γ2 (grey) or α1(F64C)β2γ2 (grey) receptors. Bar graph shows mean 10–90% rise time of current activation. Both α1(F64C) and α1(F64T) substitutions significantly slowed the GABA activation rate when compared with α1β2γ2 receptors (* P < 0.0001; one‐way ANOVA post hoc Tukey's comparison) and with α1(D43C)β2γ2 or α1(T47R)β2γ2 receptors (# P < 0.0001; one‐way ANOVA post hoc Tukey's comparison). C, bar graph shows the mean percentage current remaining. GABA‐evoked currents mediated by α1(D43C)β2γ2, α1(F64C)β2γ2 and α1(F64T)β2γ2 receptors desensitise significantly less, when compared with α1β2γ2 receptors (* P < 0.05; P < 0.001 and P < 0.001, respectively; one‐way ANOVA post hoc Tukey's comparison). D, mean desensitisation τw of α1β2γ2, α1(D43C)β2γ2 and α1(T47R)β2γ2 receptors. There was no statistically significant difference in mean τw (P = 0.08; one‐way ANOVA). The individual components of the multi‐exponential fit are summarised in Table 1. E, (inset) representative examples of amplitude‐normalised current deactivation following agonist removal. The superimposed traces are time‐shifted for clarity. The step above each trace indicates the liquid junction current corresponding to agonist removal. The bar graph shows mean deactivation τw. GABA‐evoked currents mediated by α1(D43C)β2γ2, α1(T47R)β2γ2, α1(F64C)β2γ2 and α1(F64T)β2γ2 receptors deactivated significantly faster when compared to those mediated by α1β2γ2 receptors (* P < 0.0001; one‐way ANOVA post hoc Tukey's comparison). The individual components of the multi‐exponential fits are summarised in Table 2.
Figure 5
Figure 5. The kinetics of GABA‐ and THIP‐evoked currents mediated by α1β2γ2 or α1(T47R)β2γ2 receptors
A, representative examples of maximal GABA‐ (black) and THIP‐evoked (grey) currents recorded from excised outside‐out patches containing α1β2γ2 or α1(T47R)β2γ2 receptors. The upward (black) and downward (grey) steps above each correspond to the liquid junction current for GABA and THIP application, respectively. B, the mean maximum THIP‐evoked current amplitude (as a percentage of maximal GABA current amplitude) was significantly less than the maximum GABA‐evoked current amplitude at α1β2γ2 receptors (# P = 0.002; paired t‐test). The efficacy of THIP was significantly reduced at α1(T47R)β2γ2 receptors (* P = 0.0001; t‐test). C, representative examples of the activation phases of GABA‐ (black) and THIP‐evoked (grey) currents recorded from excised outside‐out patches containing α1β2γ2 receptors. The associated graph illustrates the mean 10–90% rise times. THIP‐evoked currents activated significantly slower than GABA‐evoked currents (* P = 0.0001; t‐test). D, bar graph shows mean desensitisation τw. E, representative examples show amplitude‐normalised deactivation phases of GABA‐ (black) and THIP‐evoked (grey) currents. Bar graph shows mean deactivation τw. THIP‐evoked currents deactivated significantly faster than GABA‐evoked currents (* P = 0.0001; t‐test). F, representative activation phases of THIP‐evoked currents from outside‐out patches containing α1β2γ2 (black) and α1(T47R)β2γ2 (grey) receptors. Bar graph shows mean 10–90% rise times. The α1(T47R) substitution significantly slowed the activation rates of THIP‐evoked currents, as compared to WT receptors (* P = 0.002; t‐test). G, bar graph shows mean percentage current remaining. THIP‐evoked currents mediated by α1(T47R)β2γ2 receptors show less desensitisation as compared to α1β2γ2 receptors (* P = 0.0001; t‐test). H, representative examples of amplitude‐normalised deactivation phases of THIP‐evoked currents mediated by α1β2γ2 (black) and α1(T47R)β2γ2 (grey) receptors. Bar graph shows mean deactivation τw. The α1(T47R) substitution significantly increased deactivation rate (* P = 0.0001; t‐test).
Figure 6
Figure 6. The kinetics of propofol‐evoked currents mediated by α1β2γ2, α1(T47R)β2γ2 and α1(F64C)β2γ2 receptors
A, representative examples of propofol‐evoked currents mediated by α1β2γ2, α1(T47R)β2γ2 and α1(F64C)β2γ2 receptors recorded from excised outside‐out patches. The square pulse above each trace indicates the time‐course of solution exchange. B, representative examples of amplitude‐normalised activation phases of propofol‐evoked currents mediated by α1β2γ2 (black), α1(T47R)β2γ2 (grey) and α1(F64C)β2γ2 (grey) receptors. The bar graph shows the mean 10–90% rise time of current activation. There were no statistically significant differences in the activation rates of propofol‐evoked currents. C, representative examples of amplitude‐normalised decaying phases of the currents depicted in A, following propofol removal. The superimposed traces are time‐shifted for clarity. The step above each trace indicates the liquid junction current corresponding to agonist removal. The bar graph shows mean deactivation τw. Propofol‐evoked currents mediated by α1(T47R)β2γ2 and α1(F64C)β2γ2 receptors deactivated significantly faster when compared to those mediated by α1β2γ2 receptors (* P < 0.0001 for both; one‐way ANOVA post hoc Tukey's comparison). Mean kinetic parameters are summarised in Table 1.
Figure 7
Figure 7. Spontaneous gating mediated by α1β2γ2, α1β2(L285R)γ2 and α1(T47R)β2(L285R)γ2 receptors
A, representative examples of GABA‐evoked currents (black traces) and inhibition of spontaneous currents by picrotoxin (grey traces) mediated by α1β2γ2, α1β2(L285R)γ2 and α1(T47R)β2(L285R)γ2 receptors. B, bar graph shows mean percentage spontaneous current (expressed as I Spont/I GABA). One‐way ANOVA revealed a statistically significant difference in mean spontaneous current (P < 0.0001). Mean spontaneous current amplitudes differed between α1β2γ2 and α1β2(L285R)γ2 receptors (* P < 0.0001) and between α1β2(L285R)γ2 and α1(T47R)β2(L285R)γ2 receptors (# P < 0.0001; post hoc Tukey's comparison).

Similar articles

Cited by

References

    1. Adodra S & Hales TG (1995). Potentiation, activation and blockade of GABAA receptors of clonal murine hypothalamic GT1‐7 neurones by propofol. Br J Pharmacol 115, 953–960. - PMC - PubMed
    1. Althoff T, Hibbs RE, Banerjee S & Gouaux E (2014). X‐ray structures of GluCl in apo states reveal a gating mechanism of Cys‐loop receptors. Nature 512, 333–337. - PMC - PubMed
    1. Anstee QM, Knapp S, Maguire EP, Hosie AM, Thomas P, Mortensen M, Bhome R, Martinez A, Walker SE, Dixon CI, Ruparelia K, Montagnese S, Kuo YT, Herlihy A, Bell JD, Robinson I, Guerrini I, McQuillin A, Fisher EM, Ungless MA, Gurling HM, Morgan MY, Brown SD, Stephens DN, Belelli D, Lambert JJ, Smart TG & Thomas HC (2013). Mutations in the Gabrb1 gene promote alcohol consumption through increased tonic inhibition. Nat Commun 4, 2816. - PMC - PubMed
    1. Baptista‐Hon DT, Deeb TZ, Lambert JJ, Peters JA & Hales TG (2013). The minimum M3‐M4 loop length of neurotransmitter‐activated pentameric receptors is critical for the structural integrity of cytoplasmic portals. J Biol Chem 288, 21558–21568. - PMC - PubMed
    1. Baptista‐Hon DT, Krah A, Zachariae U & Hales TG (2016). A role for loop G in the β1 strand in GABA receptor activation. J Physiol 594, 5555–5571. - PMC - PubMed

Publication types

LinkOut - more resources