. 2016 Dec 16:7:13896.
doi: 10.1038/ncomms13896.

A TLR9 agonist promotes IL-22-dependent pancreatic islet allograft survival in type 1 diabetic mice

Affiliations

A TLR9 agonist promotes IL-22-dependent pancreatic islet allograft survival in type 1 diabetic mice

Deepak Tripathi et al. Nat Commun. .

Abstract

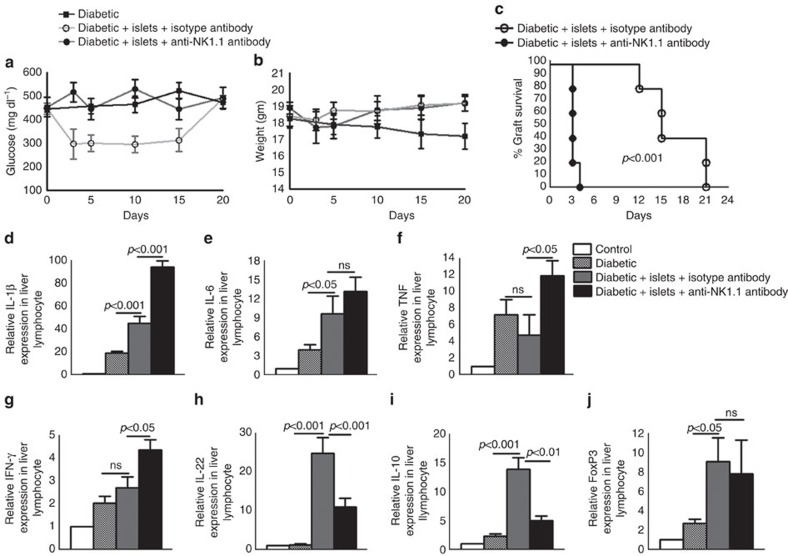
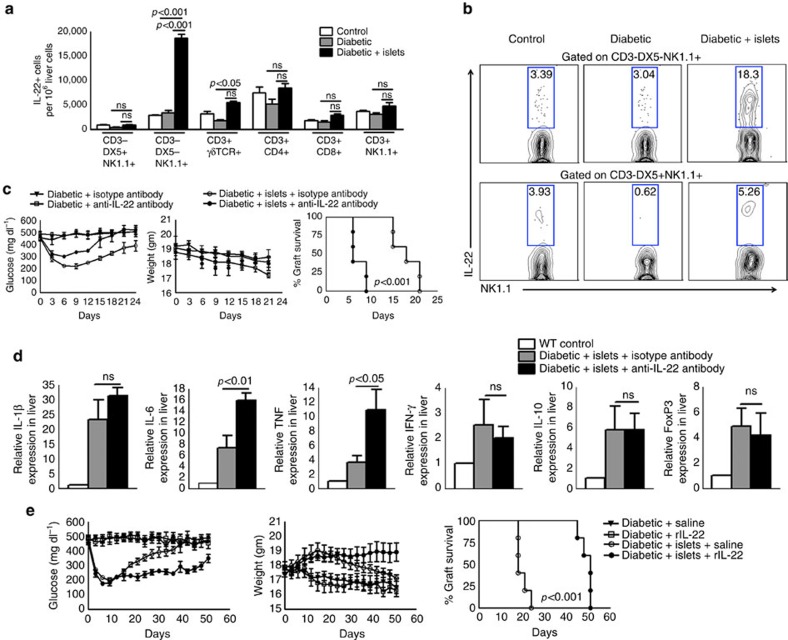
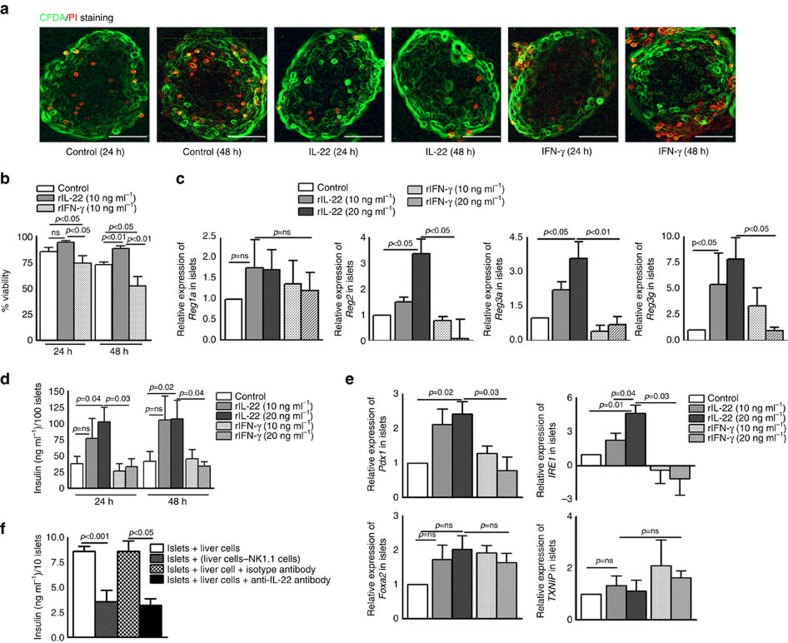
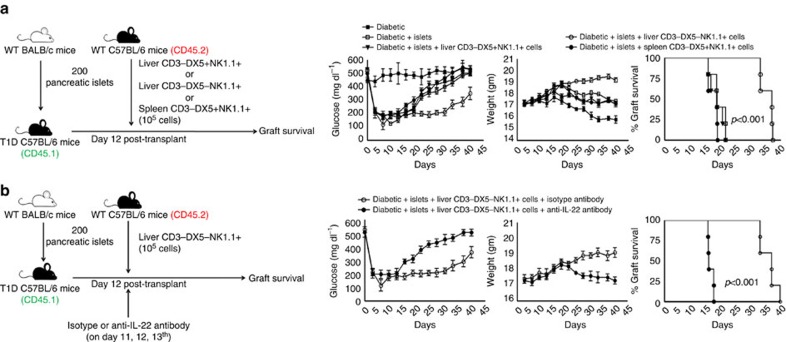
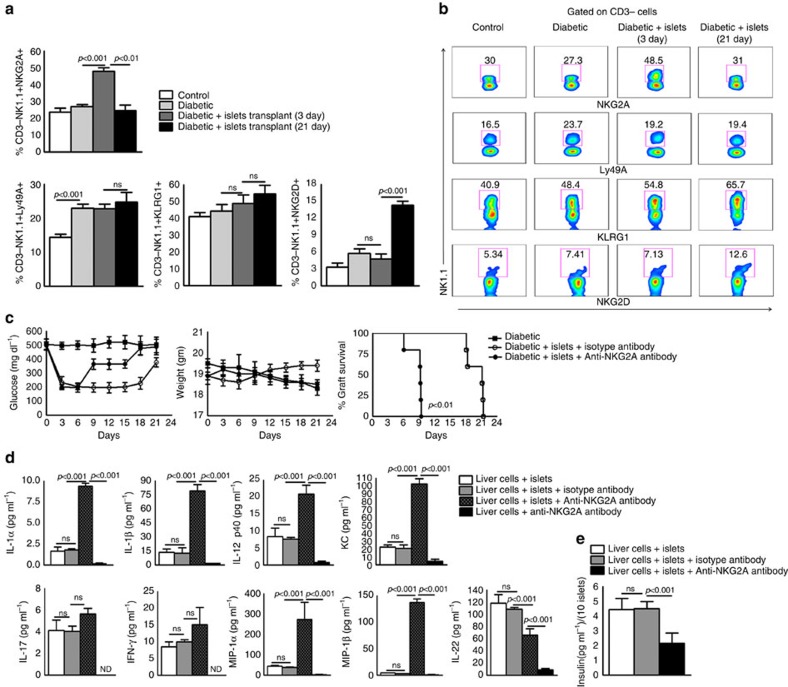
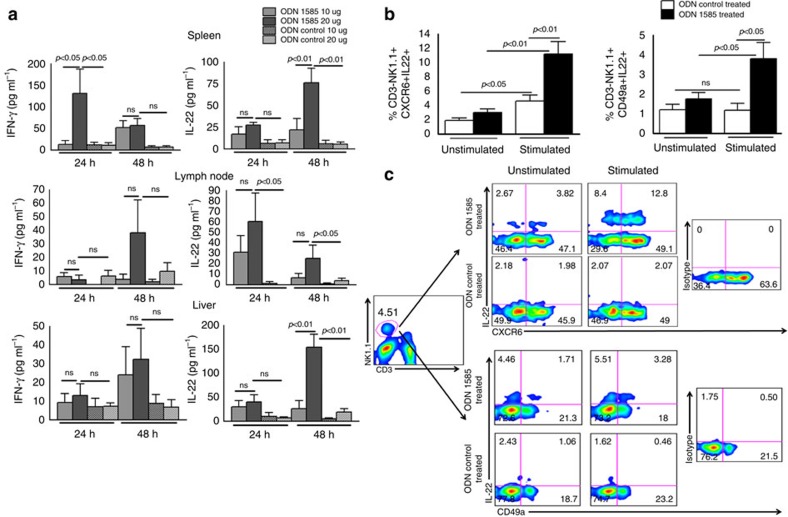
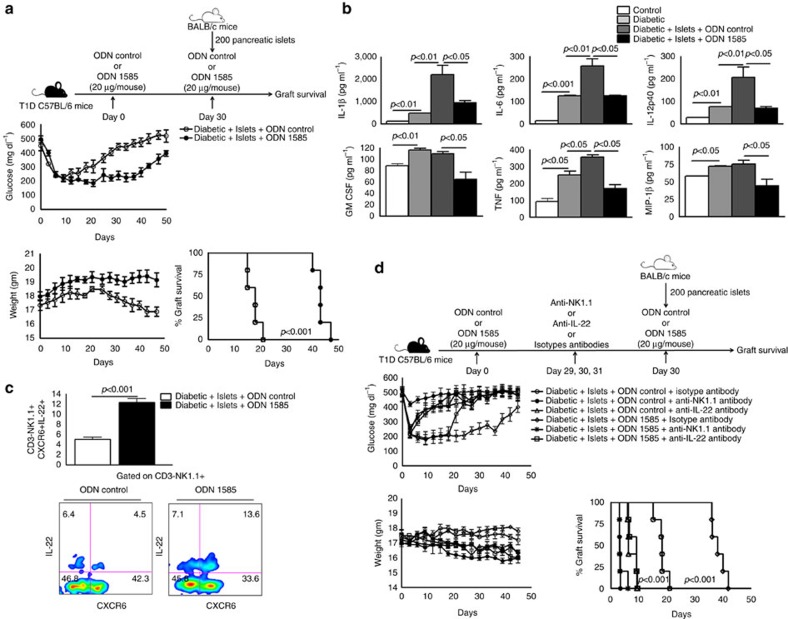
Pancreatic islet transplantation is a promising potential cure for type 1 diabetes (T1D). Islet allografts can survive long term in the liver parenchyma. Here we show that liver NK1.1+ cells induce allograft tolerance in a T1D mouse model. The tolerogenic effects of NK1.1+ cells are mediated through IL-22 production, which enhances allograft survival and increases insulin secretion. Increased expression of NKG2A by liver NK1.1+ cells in islet allograft-transplanted mice is involved in the production of IL-22 and in the reduced inflammatory response to allografts. Vaccination of T1D mice with a CpG oligonucleotide TLR9 agonist (ODN 1585) enhances expansion of IL-22-producing CD3-NK1.1+ cells in the liver and prolongs allograft survival. Our study identifies a role for liver NK1.1+ cells, IL-22 and CpG oligonucleotides in the induction of tolerance to islet allografts in the liver parenchyma.


Figures

Figure 1
Figure 1. NK1.1 cells enhance islet allograft survival in T1D mice.
A single intraperitoneal injection of streptozotocin (STZ) (180 mg kg−1 body weight) induced type 1 diabetes (T1D) in C57BL/6 mice as measured by random blood sugar levels after one week. Approximately 200 islets obtained from BALB/c or C57BL/6 mice (donor) were transplanted into the liver parenchyma of T1D C57BL/6 mice (recipients). Some of the islet allograft recipient mice were treated with anti-NK1.1 or isotype control antibodies (0.5 mg per mouse 24 h before and 0 and 24 h after transplantation via tail vein injection). (a) Blood glucose levels were measured every 72 h until 24 days. Blood glucose levels above 300 mg dl−1 were considered to indicate diabetes or failed glucose control. (b) Body weight. (c) Percentage graft survival. P value for per cent graft survival was calculated using a log rank test. Kaplan–Meier survival curves of mice are shown. (dj) Islets from BALB/c mice were transplanted into T1D C57BL/6 mice that were treated with anti-NK1.1 and isotype control antibodies, as mentioned in (a). After 3 days, liver lymphocytes were isolated. Cytokine mRNA expression was determined by real-time PCR. Bar graphs show the means±s.d. P values were generated by one-way analysis of variance (ANOVA). The data presented are representative of five independent experiments, and five mice per group were used.
Figure 2
Figure 2. IL-22 produced by liver NK 1.1 cells prolongs islet allograft survival.
(a) IL-22 production by liver cells. Islets from BALB/c mice were transplanted into T1D C57BL/6 mice as mentioned in Fig. 1. Three days after transplantation, the percentages of IL-22+ cells in the recipient liver were determined by flow cytometry. Bar graphs show the means±s.d. P values were generated by one-way analysis of variance (ANOVA). (b) A representative flow cytometry plot is shown. (c) Anti-IL-22 antibody inhibited islet allograft survival. Islets from BALB/c mice were transplanted into T1D C57BL/6 mice, as shown in Fig. 1. Some of the T1D and islet allograft-transplanted T1D recipient mice were treated with anti-IL-22 or isotype control antibodies (0.3 mg per mouse 24 h before, 0 and 24 h after transplantation through tail vein injection). The P value for per cent graft survival was calculated using the log rank test. The Kaplan–Meier survival curves of mice are shown. (d) Anti-IL-22 antibody enhanced TNF and IL-6 expression. T1D mice were transplanted and treated with anti-IL-22 antibodies, as mentioned in (c). After 5 days, liver lymphocytes were isolated, and cytokine mRNA expression levels were determined by real-time PCR. Bar graphs show the means±s.d. P values were generated by one-way analysis of variance (ANOVA). (e) Recombinant IL-22 treatment prolonged allograft survival. T1D and islet transplanted-TID mice were treated with saline or recombinant IL-22 (100 ng kg−1 of body weight) starting on day 12 and continuing twice weekly for 50 days. As a control, some of the TID mice (not islet-transplanted) were also treated with saline or rIL-22 (100 ng kg−1 of body weight). The P value for per cent graft survival was calculated using the log rank test. The Kaplan–Meier survival curves of mice are shown. The data presented are representative of five independent experiments, and five mice per group were used.
Figure 3
Figure 3. IL-22 produced by NK 1.1 cells enhances survival and insulin production by islets.
(a,b) BALB/c mouse islets (one hundred islets) were cultured in the presence of recombinant IL-22 or IFN-γ (10 and 20 ng ml−1) for 24 and 48 h. The islets were labelled with CFDA/PI (carboxyfluorescein diacetate succinimidyl ester/propidium iodide) staining. A fluorescence microscopy image is shown. Photographs are representative of staining patterns. Magnification × 40; scale bar, 50 μm (Right). The percentage of viable islets was determined using a fluorescence microscope. Bar graphs show the means±s.d. P values were generated by one-way analysis of variance (ANOVA). (c) Islets from BALB/c mice were cultured in the presence of recombinant IL-22 and IFN-γ (10 and 20 ng ml−1). The mRNA expression of islet regenerating genes (Reg2, Reg3a, Reg1a and Reg3g) was determined by real time PCR. Bar graphs show the means±s.d. P values were generated by one-way analysis of variance (ANOVA). (d) Insulin levels in the culture supernatants were measured by ELISA. Bar graphs show the means±s.d. P values were generated by one-way analysis of variance (ANOVA). (e) The mRNA expression of regulatory genes for insulin biosynthesis and secretion (pdx1, foxa2, IRE1, TXNIP1) was determined by real time PCR. Bar graphs show the means±s.d. P values were generated by one-way analysis of variance (ANOVA). (f) Whole liver cells from C57BL/6 mice were cultured with BALB/c mouse islets at a ratio of 10,000:1 (1 × 10⁵ liver cells and 10 islets) in the presence of anti-IL-22 or isotype control IgG2 antibodies (1.5 μg ml−1). In some cultures, NK cells were depleted from whole liver cells by positive selection before the liver cells were cultured with the islets. After 24 h, insulin levels in the culture supernatant were measured by ELISA. Bar graphs show the means±s.d. P values were generated by one-way analysis of variance (ANOVA). The data from four independent experiments are shown.
Figure 4
Figure 4. Liver CD3-DX5-NK1.1+ cells prolong islet allograft survival.
(a) Islets from BALB/c mice were transplanted into the liver parenchyma of CD45.1 T1D C57BL/6 mice (recipients) as mentioned in Fig. 1. Twelve days after transplantation, 105 liver CD3-DX5-NK1.1+ or CD3-DX5+NK1.1+ or splenic CD3-DX5+NK1.1+ cells from CD45.2 C57BL/6 mice were adoptively transferred via tail vein injection (recipient CD45.1 T1D C57BL/6 mice). Blood glucose and body weight were measured every 72 h until 40 days. The P value for per cent graft survival was calculated using the log rank test. Kaplan–Meier survival curves of mice are shown. (b) IL-22 produced by the liver CD3-DX5-NK1.1+ cells prolongs islet allograft survival. Islets from BALB/c mice were transplanted into the liver parenchyma of CD45.1 T1D C57BL/6 mice (recipients), as mentioned in Figs 1 and 2c. Twelve days after transplantation, 105 liver CD3-DX5-NK1.1+ cells from CD45.2 C57BL/6 mice were adoptively transferred along with the anti-IL-22 or isotype control antibodies (0.3 mg per mouse on day 12, 13 and 14 through tail vein injection). Blood glucose and body weight were measured every 72 h until 40 days. The P value for per cent graft survival was calculated using the log rank test. Kaplan–Meier survival curves of mice are shown. The data presented are representative of five independent experiments. In all mouse experiments, five mice were used per group.
Figure 5
Figure 5. NKG2A expressed by NK1.1 cells inhibits the alloimmune response.
(a) The expression of NK cell activating and inhibitory receptors. Islets from BALB/c mice were transplanted into T1D C57BL/6 mice, as mentioned in Fig. 1. After 3 and 21 days, the expression of Ly49A, NKG2A, KLRG1 and NKG2D by liver CD3-NK1.1+ cells was determined by flow cytometry. Bar graphs show the means±s.d. P values were generated by one-way analysis of variance (ANOVA). (b) A representative flow cytometry figure is shown. (c) Blocking of NKG2A receptor signaling reduces islet allograft survival. Islets from BALB/c mice were transplanted into the liver parenchyma of T1D C57BL/6 mice (recipients) as shown in Fig. 1. Some of the islet allograft recipient mice were treated with anti-NKG2A or isotype control antibodies (0.3 mg per mouse 24 h before, 0 and 24 h after transplantation through tail vein injection). Blood glucose and body weight were measured every 72 h until 24 days. P value for per cent graft survival was calculated using a log rank test. Kaplan–Meier survival curves of mice are shown. The data presented are representative of five independent studies. Five mice per group were use. (d) Liver cells from T1D mice were isolated and cultured with BALB/c mouse pancreatic islets at a ratio of 10,000:1 (1 × 10⁵:10) in the presence of anti-NKG2A, or isotype control IgG2 antibodies (1.5 μg ml−1). After 72 h, various cytokine levels and (e) insulin levels were measured by ELISA. Bar graphs show the means±s.d. P values were generated by one-way analysis of variance (ANOVA). The data from three independent experiments are shown.
Figure 6
Figure 6. Immunization with a TLR9 agonist enhances the expansion of IL-22-producing NK1.1 cells.
(a) The TLR9 agonist ODN 1585 enhanced IL-22 production by liver NK1.1 cells. Spleen, liver and lymph node cells from C57BL/6 mice were cultured with the TLR9 agonist ODN 1585 or ODN control for 24 and 48 h, and various cytokine levels were measured by ELISA. Bar graphs show the means±s.d. P values were generated by one-way analysis of variance (ANOVA). (b) Immunization of T1D mice with the same TLR9 agonist enhances the expansion of IL-22-producing CD3-NK1.1+ cells. C57BL/6 T1D mice were immunized intravenously with the TLR9 agonist ODN 1585 or treated with control ODN (20 μg per mouse). After 30 days, liver cells were isolated and restimulated with ODN 1585 or control ODN (20 μg ml−1). After 120 h, the expansion of CD3-NK1.1+CXCR6+IL-22+ and CD3-NK1.1+ CD49a+IL-22+ cellular populations was determined by flow cytometry. Bar graphs show the means±s.d. P values were generated by one-way analysis of variance (ANOVA). (c) A representative flow cytometry figure is shown. The data from five independent experiments are shown, and five mice were used per group.
Figure 7
Figure 7. TLR9 agonist immunization before islet transplantation prolongs allograft survival.
(a) Immunization of T1D mice with TLR9 agonist prolonged islet allograft survival. C57BL/6 T1D mice were immunized intravenously with the TLR9 agonist ODN 1585 or with ODN control (20 μg per mouse). Thirty days after immunization, pancreatic islets from BALB/c mice were transplanted as mentioned in Fig. 1. Blood glucose and body weight were measured every 72 h until 50 days. The P value for per cent graft survival was calculated using a log rank test. Kaplan–Meier survival curves of mice are shown. (b) Liver homogenates were prepared from transplanted mice after 20 days, and various cytokine levels were measured by ELISA. Bar graphs show the means±s.d. P values were generated by one-way analysis of variance (ANOVA). (c) After 20 days, liver lymphocytes were isolated. The expansion of NK1.1+CXCR6+IL-22+ cells in ODN 1585-vaccinated mice was determined by surface and intracellular staining. Bar graphs show the means±s.d. P values were generated by independent t-test. (d) IL-22 prolongs islet allograft survival in ODN 1585-vaccinated mice. C57BL/6 T1D mice were immunized intravenously with the TLR9 agonist ODN 1585 or with ODN control (20 μg per mouse). After 30 days, 200 pancreatic islets obtained from BALB/c mice (donor) were transplanted into the liver parenchyma of T1D C57BL/6 mice (recipients). Some of the islet allograft recipient mice were treated with anti-NK1.1 or anti-IL-22 or isotype control antibodies (0.5 mg per mouse 24 h before and 0 and 24 h after transplantation via tail vein injection). Blood glucose and body weight were measured every 72 h until 50 days. The P value for per cent graft survival was calculated using the log rank test. Kaplan–Meier survival curves of mice are shown. The data presented are representative of five independent experiments. Five mice were used per group.

Similar articles

Cited by

References

    1. Eizirik D. L., Colli M. L. & Ortis F. The role of inflammation in insulitis and β-cell loss in type 1 diabetes. Nat. Rev. Endocrinol. 5, 219–226 (2009). - PubMed
    1. Lehuen A., Diana J., Zaccone P. & Cooke A. Immune cell crosstalk in type 1 diabetes. Nat. Rev. Immunol. 10, 501–513 (2010). - PubMed
    1. Jabs D. A. et al.. Guidelines for the use of immunosuppressive drugs in patients with ocular inflammatory disorders: recommendations of an expert panel. Am. J. Ophthalmol. 130, 492–513 (2000). - PubMed
    1. Vial T. & Descotes J. Immunosuppressive drugs and cancer. Toxicology 185, 229–240 (2003). - PubMed
    1. De Leeuw I. et al.. Insulin detemir used in basal-bolus therapy in people with type 1 diabetes is associated with a lower risk of nocturnal hypoglycaemia and less weight gain over 12 months in comparison to NPH insulin. Diabetes Obes. Metab. 7, 73–82 (2005). - PubMed

Publication types