. 2016 Dec 16:6:39259.
doi: 10.1038/srep39259.

A cloud-based workflow to quantify transcript-expression levels in public cancer compendia

Affiliations

A cloud-based workflow to quantify transcript-expression levels in public cancer compendia

P J Tatlow et al. Sci Rep. .

Abstract

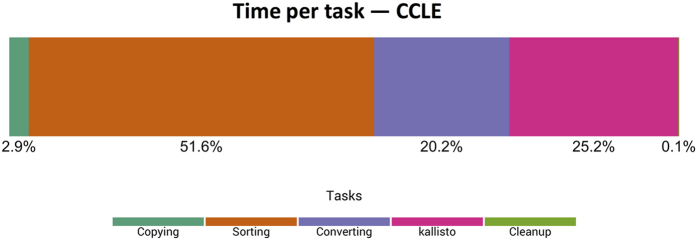
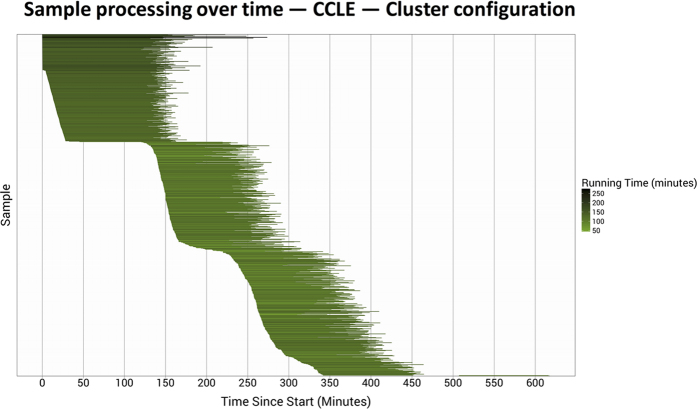
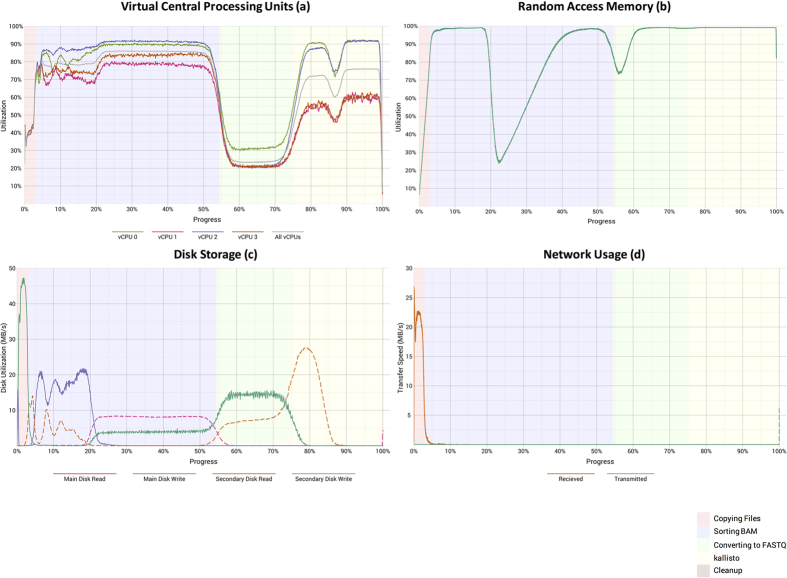
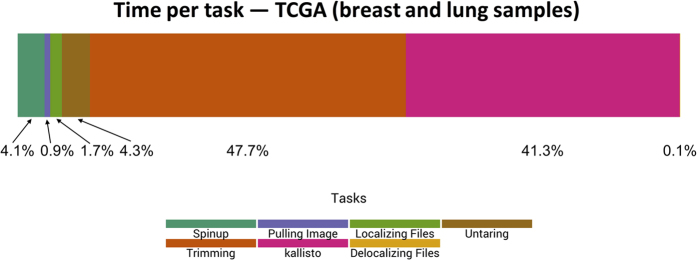
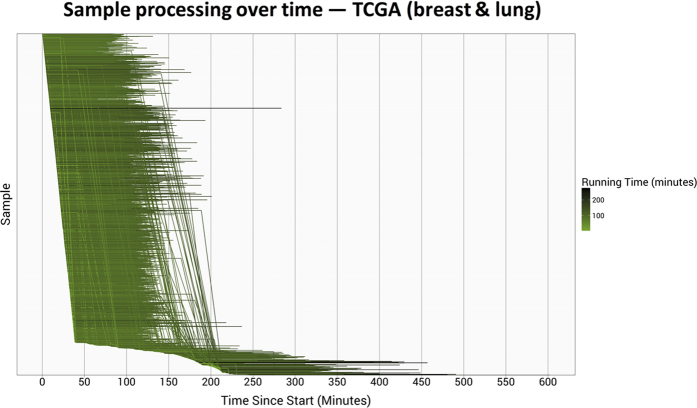
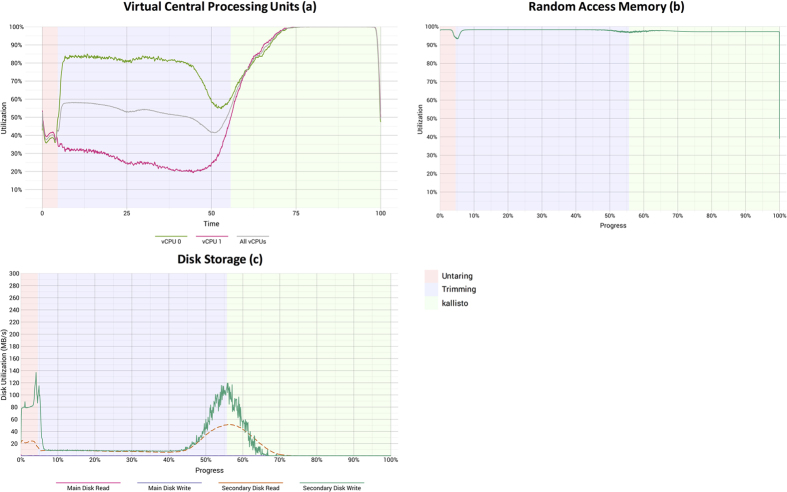
Public compendia of sequencing data are now measured in petabytes. Accordingly, it is infeasible for researchers to transfer these data to local computers. Recently, the National Cancer Institute began exploring opportunities to work with molecular data in cloud-computing environments. With this approach, it becomes possible for scientists to take their tools to the data and thereby avoid large data transfers. It also becomes feasible to scale computing resources to the needs of a given analysis. We quantified transcript-expression levels for 12,307 RNA-Sequencing samples from the Cancer Cell Line Encyclopedia and The Cancer Genome Atlas. We used two cloud-based configurations and examined the performance and cost profiles of each configuration. Using preemptible virtual machines, we processed the samples for as little as $0.09 (USD) per sample. As the samples were processed, we collected performance metrics, which helped us track the duration of each processing step and quantified computational resources used at different stages of sample processing. Although the computational demands of reference alignment and expression quantification have decreased considerably, there remains a critical need for researchers to optimize preprocessing steps. We have stored the software, scripts, and processed data in a publicly accessible repository (https://osf.io/gqrz9).


Figures

Figure 1
Figure 1. Relative time spent on computational tasks for CCLE samples using a cluster-based configuration.
We logged the durations of individual processing tasks for all CCLE samples, averaged these values, and calculated the percentage of overall processing time for each task. Because the raw data were stored on Google Cloud Storage, copying the BAM and index files to the computing nodes took less than 3% of the total processing time. For preprocessing, the BAM files were sorted and converted to FASTQ format, which took 71.8% of the overall processing time. The kallisto alignment and quantification steps took only 25.2% of the overall processing time.
Figure 2
Figure 2. Processing time per CCLE sample using the cluster-based configuration.
The 934 CCLE samples were processed on a cluster of 295 virtual machines. The horizontal lines represent the relative start and stop times at which each sample was processed. Darker lines identify samples that took longer to process. The longest-running sample took over 4.5 hours to process; the shortest-running sample completed in less than 1 hour. All but two samples finished processing within 7.5 hours. These two samples failed due to a disk-mounting error, so we reprocessed the samples on a smaller cluster (see Methods).
Figure 3
Figure 3. Computational resource utilization while CCLE samples were processed using a cluster-based configuration.
These graphs show the (a) percentage of user and system vCPU utilization, (b) percentage of memory usage, (c) disk activity, and (d) network activity. The “main” disk for each virtual machine had 100 gigabytes of storage space. The “secondary” disks, which stored temporary files during the sorting and FASTQ-to-BAM conversion steps, had 300 gigabytes of space. The background colors represent the five computational tasks shown in Fig. 2. Each graph summarizes data from all 934 CCLE samples.
Figure 4
Figure 4. Relative time spent on computational tasks for TCGA breast and lung samples using a preemptible-node configuration.
We logged the durations of individual processing tasks for the TCGA breast and lung samples, averaged these values, and calculated the percentage of overall processing time for each task. The “spinup,” image pulling, and file localization steps enabled the virtual machines to begin executing. For sample preprocessing, the FASTQ files were unpacked, decompressed, and quality trimmed; together these steps took 52.0% of the processing time (on average). The kallisto alignment and quantification steps took 41.3% of the overall processing time.
Figure 5
Figure 5. Processing time per TCGA breast and lung sample using a preemptible-node configuration.
The 1,811 TCGA breast and lung samples were processed using a variable number of preemptible virtual machines. The horizontal lines represent the relative start and stop times at which each sample was processed. Darker lines identify samples that took longer to process. Vertical lines indicate times at which samples were preempted and then resubmitted for processing. In total, 210 preemptions occurred.
Figure 6
Figure 6. Computational resource utilization while TCGA breast and lung samples were processed using a preemptible-node configuration.
These graphs show the (a) percentage of user and system vCPU utilization, (b) percentage of memory usage, and (c) disk activity. The “main” disks had 10 gigabytes of storage space and stored operating-system files. The “secondary” disks, which stored all data files, had 350 gigabytes of space. The background colors represent the computational tasks shown in Fig. 4. We were unable to collect performance metrics for preliminary tasks, such as file localization, because these tasks were not performed within the software container. Each graph summarizes data observed across all 1,811 TCGA lung and breast samples. Because there was typically only one pair of FASTQ files per sample, quality trimming could not be parallelized; therefore, we used only 2 vCPUs per sample.

Comment in

  • Cheap-seq.
    Greene CS. Greene CS. Sci Transl Med. 2016 Dec 21;8(370):370ec203. doi: 10.1126/scitranslmed.aal3701. Sci Transl Med. 2016. PMID: 28003542 No abstract available.

References

    1. Network T. C. G. A. R., Cancer T. & Atlas G. Comprehensive genomic characterization defines human glioblastoma genes and core pathways. Nature 455, 1061–1068 (2008). - PMC - PubMed
    1. Cancer Genome Atlas Research Network. Integrated genomic analyses of ovarian carcinoma. Nature 474, 609–615 (2011). - PMC - PubMed
    1. The Cancer Genome Atlas Research Network. Comprehensive genomic characterization of squamous cell lung cancers. Nature 489, 519–525 (2012). - PMC - PubMed
    1. Koboldt D. C. et al.. Comprehensive molecular portraits of human breast tumours. Nature 490, 61–70 (2012). - PMC - PubMed
    1. Omberg L. et al.. Enabling transparent and collaborative computational analysis of 12 tumor types within The Cancer Genome Atlas. Nat. Genet. 45, 1121–1126 (2013). - PMC - PubMed

Publication types