. 2016 Dec 16:6:39299.
doi: 10.1038/srep39299.

Huangqin-tang ameliorates dextran sodium sulphate-induced colitis by regulating intestinal epithelial cell homeostasis, inflammation and immune response

Affiliations

Huangqin-tang ameliorates dextran sodium sulphate-induced colitis by regulating intestinal epithelial cell homeostasis, inflammation and immune response

Ying Zou et al. Sci Rep. .

Abstract

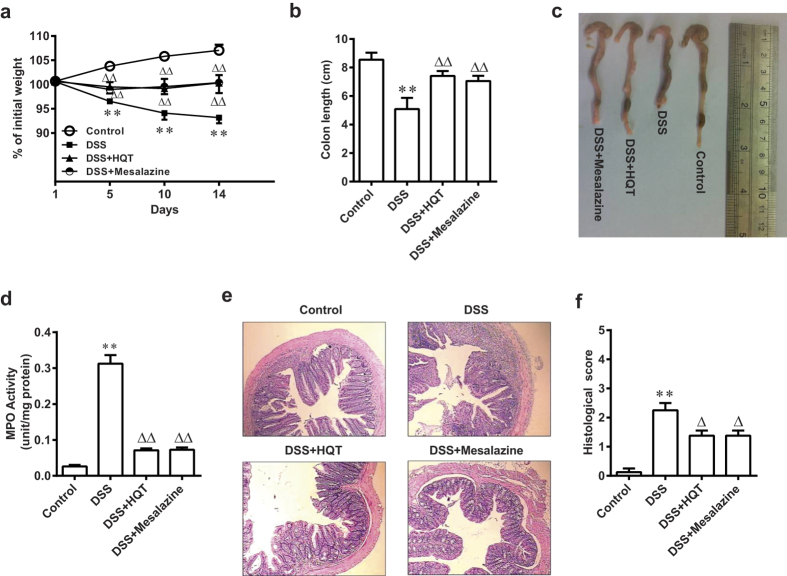
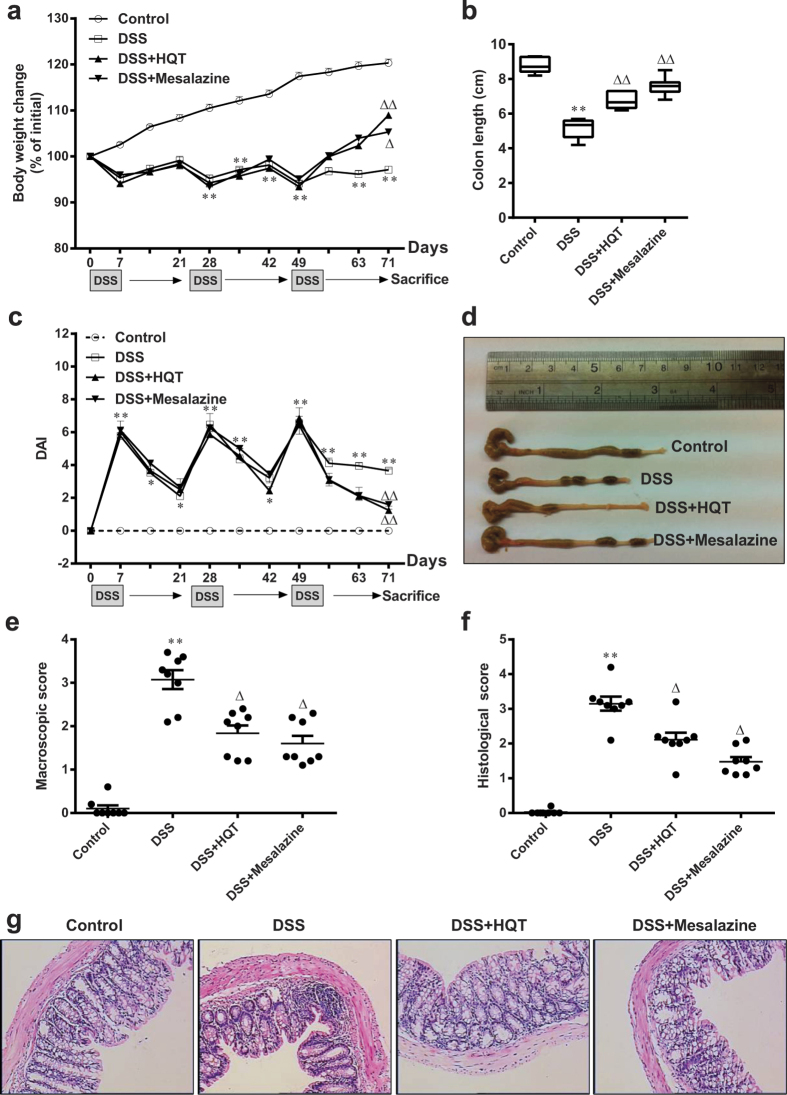
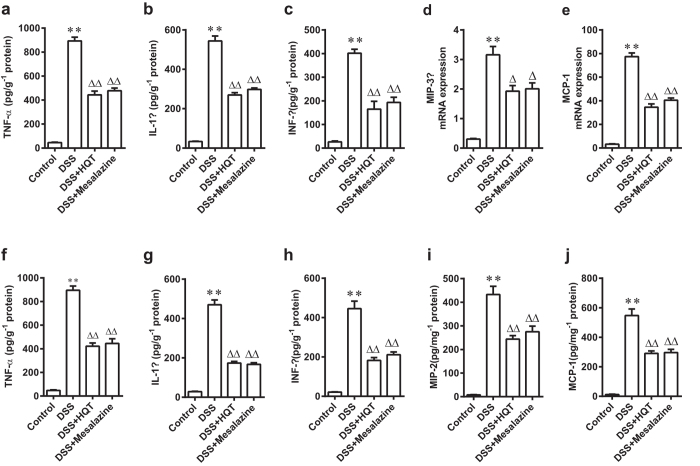
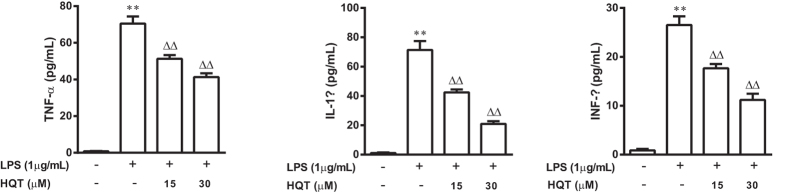
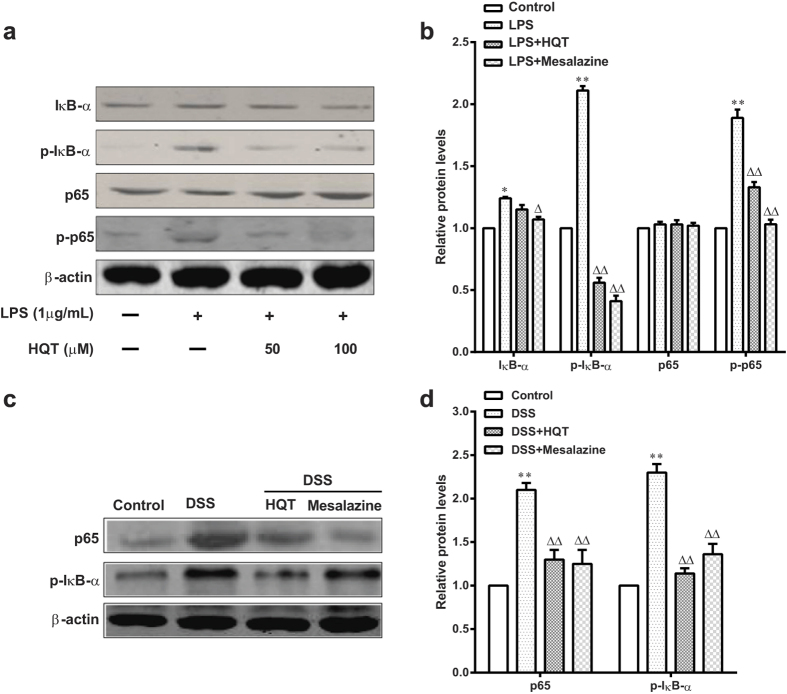
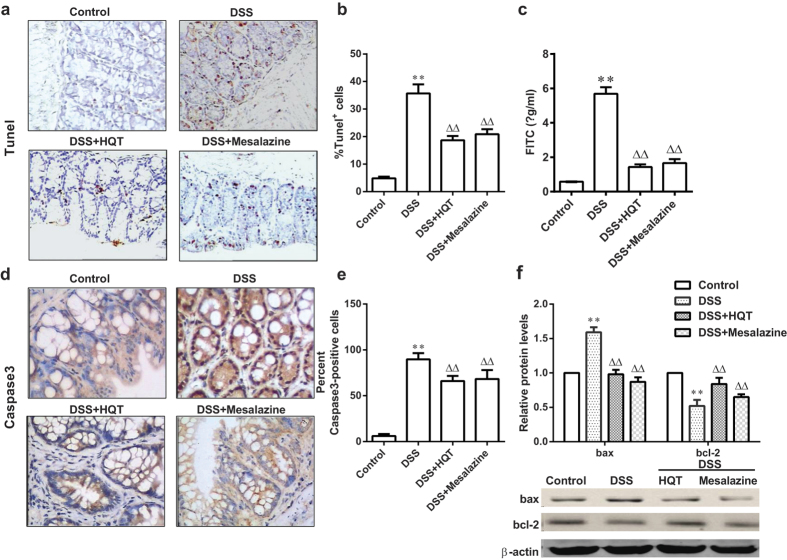
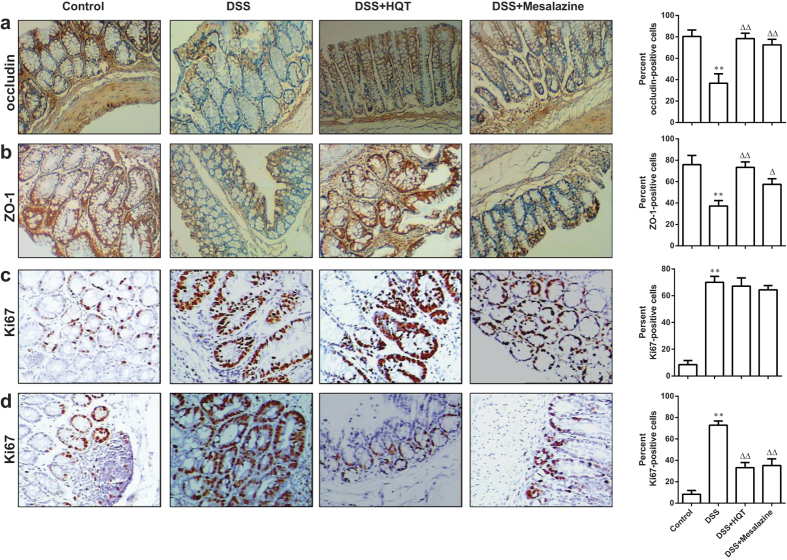
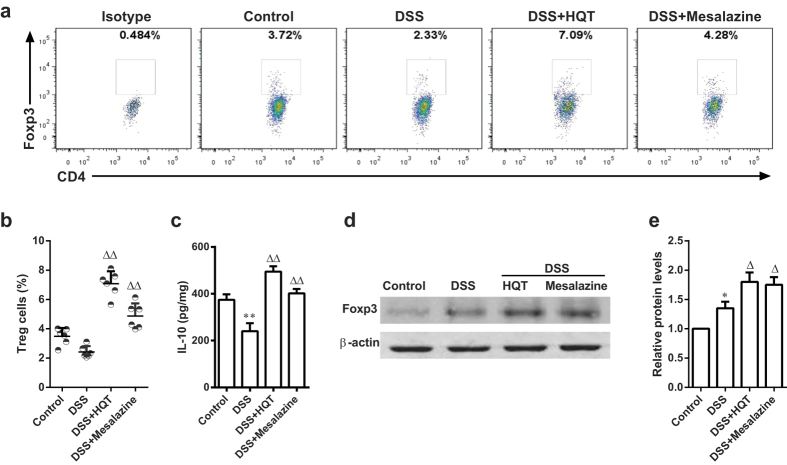
Huangqin-tang (HQT) is a traditional Chinese medicine (TCM) formula widely used for the treatment of inflammatory bowel disease in China. However, the molecular mechanisms by which HQT protects the colon are unclear. We studied the protective effects of HQT and the underlying mechanisms in an experimental mouse model and in vitro. In vivo, dextran sodium sulphate (DSS)-induced acute and chronic colitis were significantly ameliorated by HQT as gauged by phenotypic, histopathologic and inflammatory manifestations of the disease. Mechanistically, DSS-induced nuclear factor-κB (NF-κB) signalling was inhibited by HQT. Moreover, HQT-treated mice demonstrated significant changes in cell apoptosis, expression of apoptosis-associated genes such as caspase-3, bax, bcl-2, and intestinal permeability. HQT also increased occluding and zonula occludens-1 (ZO-1), inhibited cell proliferation (Ki67), and increased regulatory T cells numbers, protein expression of Foxp3 and IL-10 in the colonic tissue. In vitro, HQT down-regulated production of pro-inflammatory cytokines and supressed the NF-κB signalling pathway in lipopolysaccharides-induced RAW 264.7 macrophages. Our study suggests that HQT plays a critical role in regulating intestinal epithelial cell homeostasis, inflammation and immune response in colitis and offers novel therapeutic options in the management of inflammatory bowel disease.


Figures

Figure 1
Figure 1. HQT ameliorates DSS-induced acute colitis in mice.
Mice were administered regular water (control) or 3.5% DSS for 7 days followed by treatment with HQT for 7 days. (a) Body weight, as a percent of starting weight, assessed daily. (b,c) Colon length, measured at day 14 after treatment. (d) Colonic MPO activity analysis. The results are expressed as units of MPO activity per mg of protein. (e,f) Representative H&E-stained distal colonic sections and histological scores, assessed at day 14 after treatment (magnification, x100). Results are expressed as means ± SD of three independent experiments; n = 8 mice per group. *p < 0.05, **p < 0.001 vs. the control group; p < 0.05, △△p < 0.001 vs. DSS-treated mice. MPO, myeloperoxidase.
Figure 2
Figure 2. HQT ameliorates DSS-induced chronic colitis.
Mice received three cycles of DSS treatment, each cycle consisting of 7 days of 2.5% DSS in drinking water followed by 14 days of tap water, followed by treatment with HQT for 7 days. (a) Body weight, as a percent of starting weight, assessed throughout the recurring DSS-induced colitis time course every 7 days. (b,d) Colon length, measured at day 71. (c) DAI reflecting weight loss, loose stool consistency and amount of blood present in stool and rectum, assessed throughout the recurring DSS-induced colitis time course every 7 days. (e) Macroscopic scores, assessed at day 71 after HQT treatment. (f) Histological score, assessed at day 71 after HQT treatment. (g) H&E staining of representative colon cross-sections on day 71 after HQT treatment (magnification, x100). Results are expressed as means ± SD of three independent experiments; n = 8 mice per group.*p < 0.05, **p < 0.001 vs. the control group; p < 0.05, △△p < 0.001 vs. DSS-treated mice. DAI, disease activity index.
Figure 3
Figure 3. HQT inhibits pro-inflammatory cytokines and chemokines production in colon tissues from mice with DSS-induced acute and chronic colitis.
Mice were administered regular water (control) or 3.5% DSS for 7 days followed by treatment with HQT for 7 days. (a–c) The protein levels of inflammation-related cytokines TNF-α, IL-1β and IFN-γ in colonic homogenate, determined by ELISA. (d,e) Expression of mRNA of inflammatory chemokines MIP-3α and MCP-1 determined by real-time PCR. Results are expressed as means ± SD of three independent experiments; n = 8 mice per. *p < 0.05, **p < 0.001 vs. the control group; p < 0.05, △△p < 0.001 vs. DSS-treated mice. Mice received three cycles of DSS treatment (2.5%), each cycle consisting of 7 days of water containing DSS followed by 14 days of tap water, followed by treatment with HQT for 7 days. (f–h) Protein levels of inflammation-related cytokines TNF-α, IL-1β and IFN-γ in colonic homogenates, determined by ELISA. (i,j) Protein levels of inflammatory chemokines MIP-2 and MCP-1, determined by ELISA. Results are expressed as means ± SD of three independent experiments; n = 8 mice per group. *p < 0.05, **p < 0.001 vs. the control group; p < 0.05, △△p < 0.001 vs. DSS-treated mice. TNF, tumour necrosis factor; IL, interleukin; IFN, interferon; ELISA, enzyme-linked immunosorbent assay; real-time PCR, Real-time polymer chain reaction.
Figure 4
Figure 4. HQT decreases pro-inflammatory cytokines production in LPS-stimulated RAW264.7 cells.
RAW264.7 cells were stimulated with LPS (1 μg/mL) with or without HQT at various concentrations (15 and 30 μM) for 24 hours. At the end of incubation, production of cytokines was determined using ELISA. (a) TNF-α, (b) IL-1β and (c) INF-γ. The results are expressed as means ± SD of three independent experiments. *p < 0.05, **p < 0.001 vs. the control cells; p < 0.05, △△p < 0.001 vs. the LPS-stimulated cells. LPS, lipopolysaccharides; ELISA, enzyme-linked immunosorbent assay; TNF, tumour necrosis factor; IL, interleukin.
Figure 5
Figure 5. HQT down-regulates NF-κB pathway in vitro and in vivo.
In vitro study: RAW264.7 cells were stimulated with LPS (1 μg/mL) with or without HQT at various concentrations (15 and 30 μM) for 24 hours. (a,b) Protein levels of IκBα, p-IκBα, p65 and p-p65 measured by Western blotting. The gels were run under the same experimental conditions. Densitometric analysis was performed to determine the relative ratios of each protein. The results are expressed as means ± SD of three independent experiments. *p < 0.05, **p < 0.001 vs. the control cells; p < 0.05, △△p < 0.001 vs. the LPS-stimulated cells. In vivo study: Mice were administered regular water (control) or 3.5% DSS for 7 days followed by treatment with HQT for 7 days. (c,d) The protein levels of p-IκBα and p65 measured by Western blotting. The gels were run under the same experimental conditions. Densitometric analysis was performed to determine the relative ratios of each protein. Results are expressed as means ± SD of three independent experiments; n = 8 mice per group. p < 0.05, △△p < 0.001 vs. DSS-treated mice. LPS, lipopolysaccharides.
Figure 6
Figure 6. HQT attenuates epithelial cell apoptosis and intestinal permeability in DSS-induced acute colitis.
Mice were administered regular water (control) or 3.5% DSS for 7 days followed by treatment with HQT for 7 days. (a) TUNEL assay for apoptosis (magnification, x200). (b) The percent of TUNEL-positive cells. (c) Intestinal permeability assessed by measuring serum FITC-Dextran levels 4 hours after administration. (d) Immunohistochemistry analysis of caspase-3 in colon sections (magnification, ×200). (e) Graphical representation of Caspase-3 positive cells in the mid-colon. (f) Western blotting analyses and densitometric quantitation of colonic mucosal levels of bax and bcl-2 proteins. The gels were run under the same experimental conditions. Results are expressed as mean ± SD of three independent experiments; n = 8 mice per group. *p < 0.05, **p < 0.001 vs. the control group; p < 0.05, △△p < 0.001 vs. DSS-treated mice. TUNEL, terminal deoxynucleotidyl transferase dUTP nick end labelling; FITC, fluorescein isothiocyanate.
Figure 7
Figure 7. HQT regulates epithelial proliferation in the colonic mucosa of mice with DSS-induced acute and chronic colitis.
Mice were administered regular water (control) or 3.5% DSS for 7 days followed by treatment with HQT for 7 days. (a–c) Immunohistochemical analysis of tight junction proteins occluding, ZO-1 and proliferating cells detected based on Ki67 in colon sections in DSS-induced acute colitis mice. (magnification, ×200). Graphical representation of the percentage of occluding, ZO-1 and Ki67-positive cells in the mid-colon. Results are expressed as means ± SD of three independent experiments; n = 8 mice per group. *p < 0.05, **p < 0.001 vs. the control group; p < 0.05, △△p < 0.001 vs. DSS-treated mice. Mice received three cycles of DSS treatment (2.5%), each cycle consisting of 7 days of water containing DSS followed by 14 days of tap water, followed by treatment with HQT for 7 days. (d) Immunohistochemical analysis of proliferating cells detected based on Ki67 in colon sections in mice with DSS-induced chronic colitis (magnification, ×200). Graphical representation of the percentage of Ki67-positive cells in the mid-colon. Results are expressed as means ± SD of three independent experiments; n = 8 mice per group. *p < 0.05, **p < 0.001 vs. the control group; p < 0.05, △△p < 0.001 vs. DSS-treated mice.
Figure 8
Figure 8. HQT induces Treg cells in mice with DSS-induced chronic colitis.
Mice received three cycles of DSS treatment (2.5%), each cycle consisting of 7 days of water containing DSS followed by 14 days of tap water, followed by treatment with HQT for 7 days. LPMCs were isolated from each group and subjected to intracellular Foxp3 staining. (a) The frequency of Treg cells (CD4+CD25+Foxp3+) determined by flow cytometry. Numbers indicate percentages of Foxp3-expressing CD4+CD25+T cells in each quadrant. (b) Quantitative analysis of the frequency and total number of Treg in LPMCs. (c) IL-10 in colonic homogenate determined by ELISA. (d,e) Western blot analysis of Foxp3 protein expression in the colon. The gels were run under the same experimental conditions. Densitometric analysis to determine the relative ratios of Foxp3 protein. Results are expressed as mean ± SD of three independent experiments; n = 8 mice per group. *p < 0.05, **p < 0.001 vs. the control group; p < 0.05, △△p < 0.001 vs. DSS-treated mice. Treg, regulatory T cells; LPMC, lamina propria mononuclear cells; ELISA, enzyme-linked immunosorbent assay; IL, interleukins.

References

    1. Kaser A., Zeissig S. & Blumberg R. S. Inflammatory bowel disease. Annu Rev Immunol 28, 573–621 (2010). - PMC - PubMed
    1. Maloy K. J. & Powrie F. Intestinal homeostasis and its breakdown in inflammatory bowel disease. Nature 474, 298–306 (2011). - PubMed
    1. Cho J. H. The genetics and immunopathogenesis of inflammatory bowel disease. Nat Rev Immunol 8, 458–66 (2008). - PubMed
    1. Fries W., Belvedere A. & Vetrano S. Sealing the broken barrier in IBD: intestinal permeability, epithelial cells and junctions. Curr Drug Targets 14, 1460–70 (2013). - PubMed
    1. Strober W., Fuss I. J. & Blumberg R. S. The immunology of mucosal models of inflammation. Annu Rev Immunol 20, 495–549 (2002). - PubMed

Publication types

MeSH terms