. 2017 Mar;94(3):411-422.
doi: 10.1097/OPX.0000000000001031.

SD-OCT and Adaptive Optics Imaging of Outer Retinal Tubulation

Affiliations

SD-OCT and Adaptive Optics Imaging of Outer Retinal Tubulation

Brett J King et al. Optom Vis Sci. 2017 Mar.

Abstract

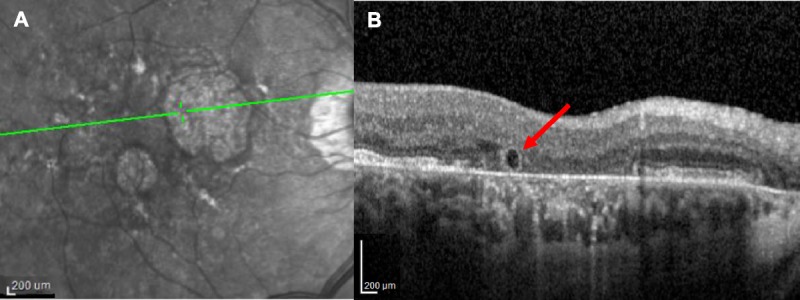
Purpose: To investigate outer retinal tubulation (ORT) using spectral domain optical coherence tomography (SD-OCT) and an adaptive optics scanning laser ophthalmoscope (AOSLO). To document the frequency of ORT in atrophic retinal conditions and quantify ORT dimensions versus adjacent retinal layers.

Methods: SD-OCT images were reviewed for the presence of retinal atrophy, scarring, and/or exudation. The greatest width of each ORT was quantified. Inner and outer retinal thicknesses adjacent to and within the area of ORT were measured for 18 patients. AOSLO imaged ORTs in five subjects with direct and scattered light imaging.

Results: ORT was identified in 47 of 76 subjects (61.8%) and in 65 eyes via SD-OCT in a wide range of conditions and ages, and in peripapillary atrophy. ORTs appeared as finger-like projections in atrophy, seen in the en face images. AOSLO showed some ORTs with bright cones that guide light within atrophic areas. Multiply scattered light mode AOSLO visualized variegated lines (18-35 μm) radiating from ORTs. The ORTs' width on OCT b-scan images varied from 70 to 509 μm. The inner retina at the ORT was significantly thinner than the adjacent retina, 135 vs.170 μm (P = .004), whereas the outer retina was significantly thicker, 115 vs. 80 μm (P = .03).

Conclusions: ORTs are quite common in eyes with retinal atrophy in various disorders. ORTs demonstrate surviving photoreceptors in tubular structures found within otherwise nonsupportive atrophic areas that lack retinal pigment epithelium and choriocapillaris.


Figures

FIGURE 1
FIGURE 1
SD-OCT imaging of an ORT in a 76-year-old subject with nonexudative AMD. (A) Infrared image showing location of the cross-sectional SD-OCT image (B) within an area of geographic atrophy. (B) SD-OCT b-scan of ORT (red arrow) with hyperreflective border adjacent to an edge of geographic atrophy.
FIGURE 2
FIGURE 2
Technique used for measuring retinal thickness and ORT cross-sectional size. (A) Example of b-scan location (red line) with ORT used for retinal thickness measurements. (B) Corresponding B scan showing numerous ORT. Red arrow indicates ORT shown in C and D in which adjacent measurements of retinal thickness were taken. (C) Enlarged image of ORT in B (red arrow) and labeled retinal layers. (D) Measurement of retinal thickness at the site of an ORT was performed for the inner retina, from ILM to the top of the outer nuclear layer (red) and from the top of the outer nuclear layer to Bruch’s membrane (blue). This measurement was made directly above an ORT and adjacent to the ORT.
FIGURE 3
FIGURE 3
ORT found in parapapillary atrophy (PPA) in subjects without and with other atrophic changes of the outer retina imaged by SD-OCT. (A) and (B) Infrared (IR) reflectance image with b-scan location and corresponding b-scan of an ORT (red arrow) at the edge of PPA in an 87-year-old white female patient with NEAMD. (C) and (D) IR reflectance image with b-scan location and corresponding b-scan of an ORT (red arrow) at the edge of PPA in an 87-year-old white female patient with geographic atrophy. Although not shown in the selected b-scan, this subject has other ORTs associated with her geographic atrophy.
FIGURE 4
FIGURE 4
Distribution of ages for subjects. Blue: patients with outer retinal tubulation. Red: patients with atrophy but no detected outer retinal tubulation.
FIGURE 5
FIGURE 5
SD-OCT imaging of ORT in a 56-year-old subject with rod-cone dystrophy demonstrating extensive networks of ORTs and large variations in their topography and width. (A) En face image showing several areas of outer retinal atrophy (red asterisks) with numerous ORT extending from more normal retinal into atrophic regions. The fovea is denoted by the blue asterisk. Note, one ORT (white arrow) is completely enclosed within an atrophic region. (B) Magnified regions of an ORT in (A) (dashed lines) showing two locations of cross-sectional images in (D) and (E). (C) Magnified region of branching ORT in (A) (long dashed lines) showing location of cross-sectional images (F and G). (D) Cross-sectional image of ORT (red arrow, cross-section location: red line in B). (E) Cross-sectional image of ORT (green arrow, cross-section location: green line in B). (B), (D), and (E) demonstrate the variation in size of a single ORT. (F) Cross-sectional image of horizontally elongated ORT (red arrow, cross-section location: red line in C). (G) Cross-sectional image of two branches (green arrows, cross-section location: green line in C) of ORT in (F). (C), (F), and (G) demonstrate an ORT that branches into two distinct ORT as it extends into an atrophic region.
FIGURE 6
FIGURE 6
Consecutive IR reflectance and cross-sectional SD-OCT images of an ORT over approximately 2 years in an 80-year-old subject with nonexudative AMD. (A) and (B) Onset of atrophic changes before ORT. (C) and (D) An ORT (red arrows) that has developed within the area of atrophy 6 months after (A) and (B). (E) and (F) The same ORT 1 year and 3 months after (C) and (D). Appearance of the ORT has remained relatively stable when comparing between (D) and (F). (G) and (H) The same ORT taken 1 year after (E) and (F). There seems to be a significant change in the appearance of the ORT, and it may be dividing.
FIGURE 7
FIGURE 7
AOSLO imaging at the border of an atrophic region of retina (red asterisk) and less abnormal retina (white asterisk) in a 56-year-old subject with rod-cone dystrophy. This region of atrophy has a long ORT bridging it (black arrows) and a several smaller ORT (white arrows) extending from the less abnormal region of retina into the atrophic region. (A) Confocal image. (B) Multiply scattered light image showing the clear borders of the ORT. (C) An enlarged region of (A) (denoted by dotted lines) showing cones extending onto the ORT. (D) An enlarged region of (B) (donated by dotted lines) showing cones extending onto the ORT. Scale bars = 200 μm.
FIGURE 8
FIGURE 8
Visualization of ORT by SD-OCT and AOSLO in a 57-year-old subject with rod-cone dystrophy. (A) Cross-sectional SD-OCT image of an ORT (red arrow) demonstrating contents within the lumen. (B) En face SD-OCT image of the same ORT (red arrow) in an area of atrophy (red asterisk). Numerous ORTs can be seen extending into this area of atrophy (white arrows). (C) The same ORT (red arrow) viewed with multiply scattered light AOSLO imaging. An additional ORT is also visible extending in this area of atrophy (white arrow). In each imaging modality, a clearly defined border can be viewed surrounding the ORT. Scale bar = 100 μm.
FIGURE 9
FIGURE 9
Multiply scattered light AOSLO image of visible cones within an ORT in a 57-year-old subject with rod-cone dystrophy. Numerous cones are visible within and around the borders of the ORT (black arrow) as it bridges the junction of atrophic (red asterisk) and more normal (white asterisk) retina. Variegated structures (blue arrows) are also visualized. Scale bar = 100 μm.
FIGURE 10
FIGURE 10
Multiply scattered light AOSLO image of variegated structures along ORT wall. Variegated structures (blue arrows) are visible that appear to line the walls of ORTs. One of these structures has been bracketed in red for better individual visualization. These structures range in size from 18 to 35 μm. Scale bar = 50 μm. SD-OCT images of this ORT can be viewed in Fig. 4A (dashed lines) and 4B.

References

    1. Bhutto I, Lutty G. Understanding age-related macular degeneration (AMD): relationships between the photoreceptor/retinal pigment epithelium/Bruch’s membrane/choriocapillaris complex. Mol Aspects Med 2012;33:295–317. - PMC - PubMed
    1. Zweifel SA, Engelbert M, Laud K, et al. Outer retinal tubulation a novel optical coherence tomography finding. Arch Ophthalmol 2009;127:1596–602. - PubMed
    1. Dolz-Marco R, Gallego-Pinazo R, Pinazo-Duran MD, et al. Outer retinal tubulation analysis in cases of macular dystrophy. Arch Soc Esp Oftalmol 2013;88:161–2. - PubMed
    1. Goldberg NR, Greenberg JP, Laud K, et al. Outer retinal tubulation in degenerative retinal disorders. Retina 2013;33:1871–6. - PMC - PubMed
    1. Iriyama A, Aihara Y, Yanagi Y. Outer retinal tubulation in inherited retinal degenerative disease. Retina 2013;33:1462–5. - PubMed