. 2016 Dec 16;12(12):e1005283.
doi: 10.1371/journal.pcbi.1005283. eCollection 2016 Dec.

The Multilayer Connectome of Caenorhabditis elegans

Affiliations

The Multilayer Connectome of Caenorhabditis elegans

Barry Bentley et al. PLoS Comput Biol. .

Abstract

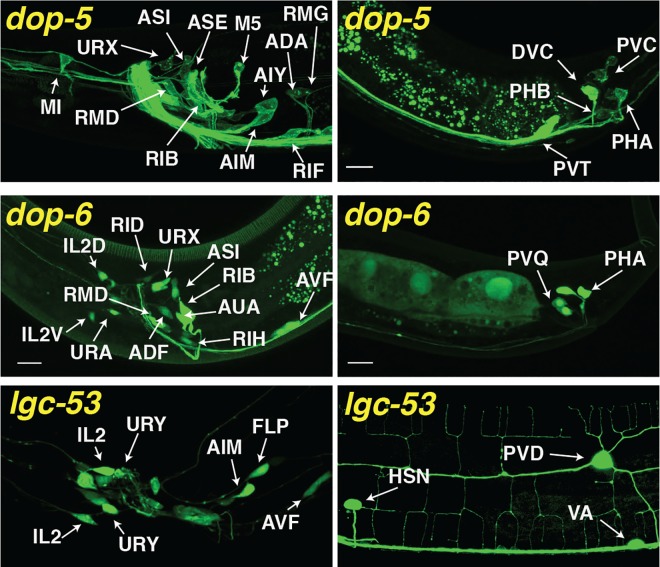
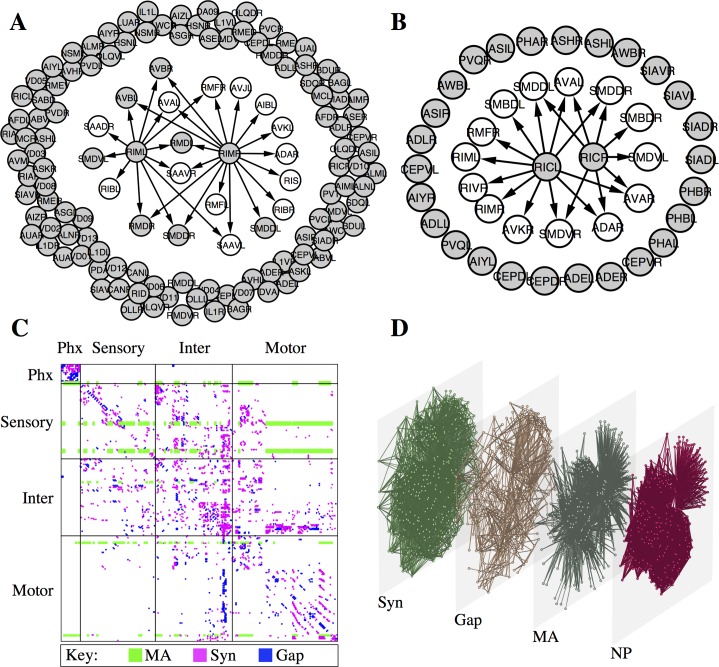
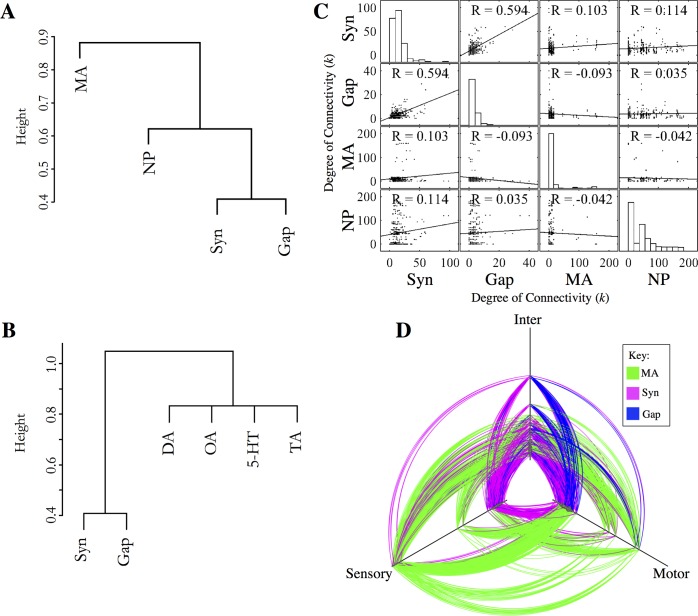
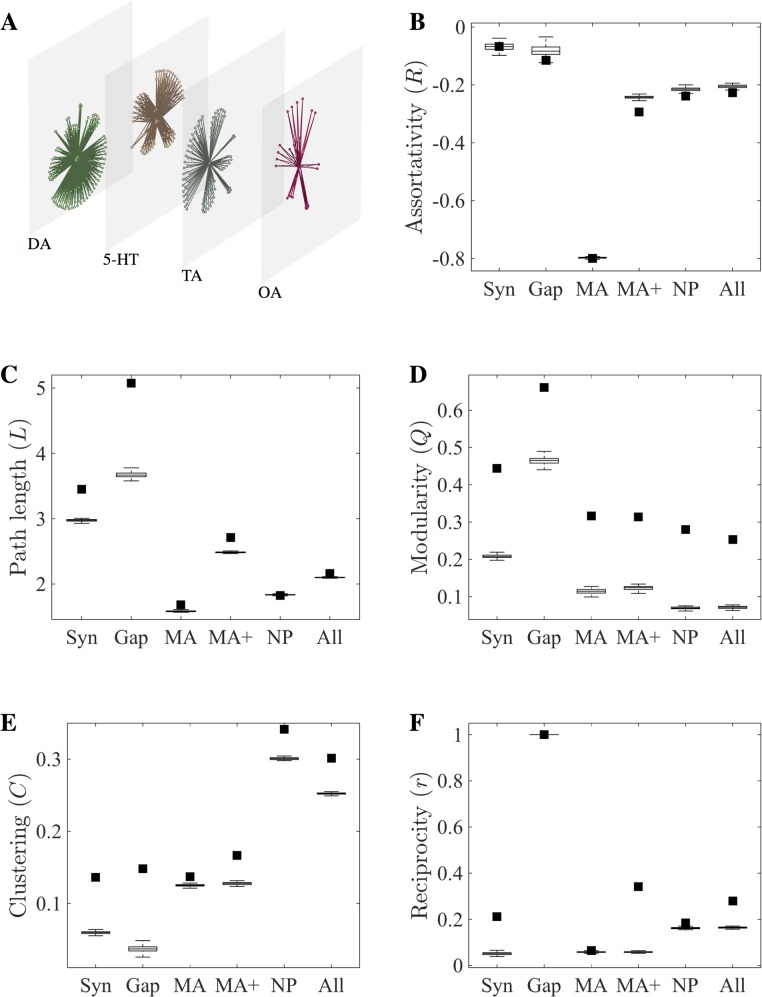
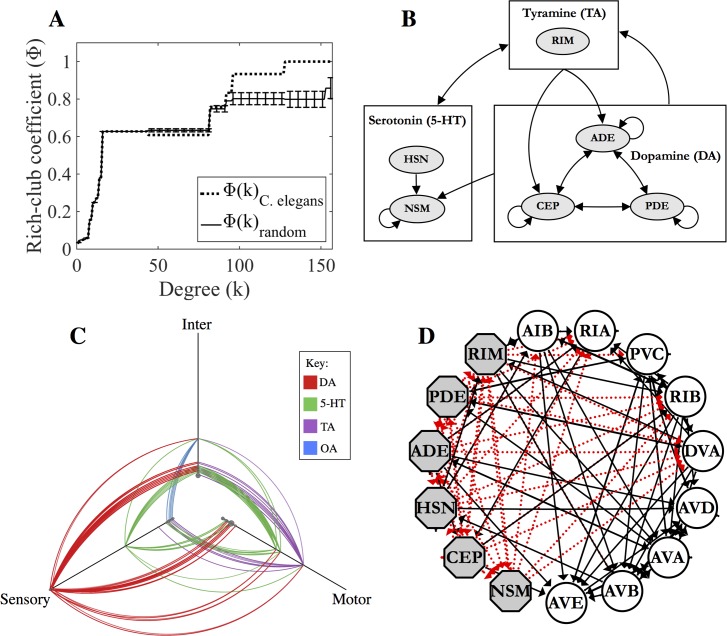
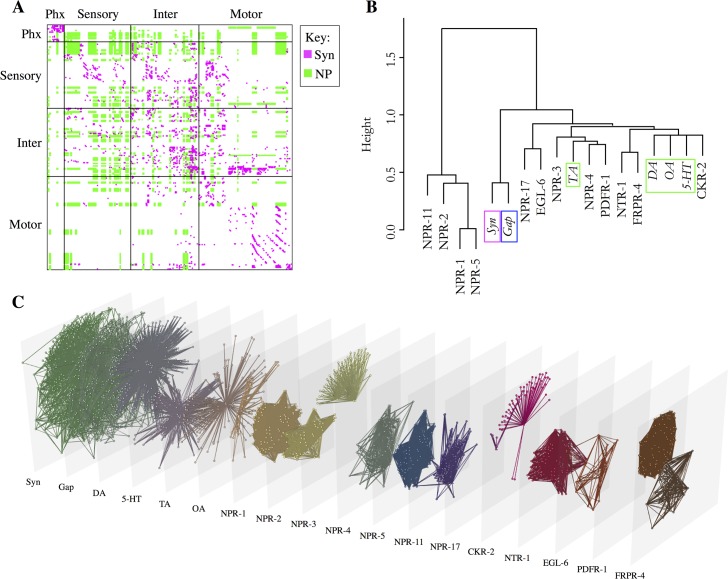
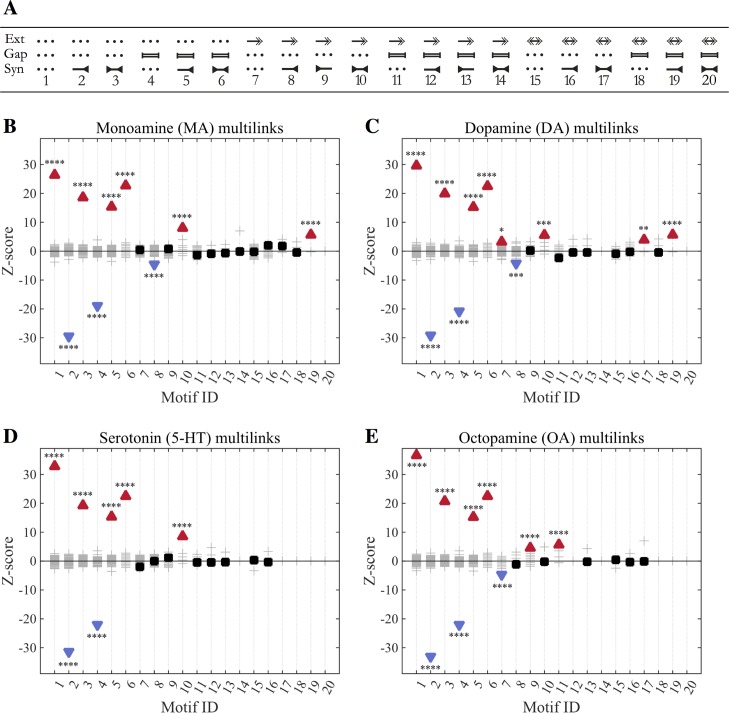
Connectomics has focused primarily on the mapping of synaptic links in the brain; yet it is well established that extrasynaptic volume transmission, especially via monoamines and neuropeptides, is also critical to brain function and occurs primarily outside the synaptic connectome. We have mapped the putative monoamine connections, as well as a subset of neuropeptide connections, in C. elegans based on new and published gene expression data. The monoamine and neuropeptide networks exhibit distinct topological properties, with the monoamine network displaying a highly disassortative star-like structure with a rich-club of interconnected broadcasting hubs, and the neuropeptide network showing a more recurrent, highly clustered topology. Despite the low degree of overlap between the extrasynaptic (or wireless) and synaptic (or wired) connectomes, we find highly significant multilink motifs of interaction, pinpointing locations in the network where aminergic and neuropeptide signalling modulate synaptic activity. Thus, the C. elegans connectome can be mapped as a multiplex network with synaptic, gap junction, and neuromodulator layers representing alternative modes of interaction between neurons. This provides a new topological plan for understanding how aminergic and peptidergic modulation of behaviour is achieved by specific motifs and loci of integration between hard-wired synaptic or junctional circuits and extrasynaptic signals wirelessly broadcast from a small number of modulatory neurons.


Conflict of interest statement

ETB is employed half-time by the University of Cambridge and half-time by GlaxoSmithKline; he holds stock in GSK. The authors have declared that no competing interests exist.

Figures

Fig 1
Fig 1. Expression patterns of the dopamine receptors dop-5, dop-6 & lgc-53.
Shown are representative images showing expression of GFP reporters under the control of indicated receptor promoters in the head (left panels) or tail/posterior body (right panels). Identified neurons are labelled; procedures for confirmation of cell identities are described in methods. In all panels, dorsal is up and anterior is to the left. In addition to the neurons indicated, dopamine receptor reporters were detected in the following neurons: dop-5: BDU (some animals); lgc-53: CAN (some animals).
Fig 2
Fig 2. Monoamine signalling in C. elegans is primarily extrasynaptic.
(A) RIM tyramine releasing neurons, showing outgoing synaptic edges (arrows), and neurons expressing one or more of the four tyramine receptors (grey). (B) RIC octopamine releasing neurons, showing outgoing synaptic edges (arrows), and neurons expressing one or more of the three octopamine receptors (grey). (C) Adjacency matrix showing the monoamine (green), synaptic (magenta) and gap junction (blue) networks. (D) Multilayer expansion of the synaptic (syn), gap junction (gap), monoamine (MA) and neuropeptide (NP) signalling networks. Node positions are the same in all layers.
Fig 3
Fig 3. Monoamine networks are largely non-overlapping with the wired connectome.
(A-B) Multilayer reducibility dendrograms. Panel A considers monoamine and neuropeptide networks in aggregate; panel B considers monoamine systems individually with neuropeptide systems not included. Layers close on the dendrogram have more overlapping edges and are more reducible. Branching height gives the Jensen-Shannon distance between the layers. (C) Degree-degree correlation matrix. Off-diagonal panels show the degree-degree correlation between a pair of network layers. Panels on the diagonal show the degree distribution of the individual layers. Monoamine hubs correspond to releasing neurons, which are distinct for each monoamine. (D) Hive plot showing the wired synaptic (magenta), gap junction (blue), and monoamine connections (green). Nodes are classified as sensory, motor or interneurons and are arranged along the three axes according to their degree. Hubs are located further out along the axes.
Fig 4
Fig 4. Topological properties of the C. elegans extrasynaptic networks.
(A) Multilayer expansion of monoamine subnetworks. Node positions are the same in all layers. (B-F) Comparison of network metrics for the synaptic (syn), gap junction (gap), monoamine network (MA), aggregate wired & monoamine network (MA+), neuropeptide (NP) and complete aggregate (all) networks. Plots show the observed values (filled squares) and expected values for 100 rewired networks preserving degree distribution (boxplots). Network measures for individual monoamine networks and dop-5/6-containing aggregate network are presented in S1 Fig.
Fig 5
Fig 5. Monoamine rich-club.
(A) Rich-club curve for the directed monoamine network. Dashed line indicates the rich-club coefficient for the C. elegans monoamine network and the solid curve is a randomized rich-club curve representing the average rich-club coefficient of 100 random graphs (preserving degree distribution) at each value k. Individual rich-club neurons are shown in Table 3. (B) Schematic showing the separate aminergic systems and the volume transmission signalling between them based on receptor expression. Arrows between boxes denote connections between all of the contained neurons. (C) Hive plot showing the connections made by individual monoamines. Nodes are classified as sensory, motor or interneurons and are arranged along the three axes according to their degree. Hubs are located further out along the axes. (D) Connections between the wired & monoamine rich-clubs. Aminergic rich-club neurons are represented as grey octagons. Members of the wired rich-club are shown as circles (RIBL but not RIBR is included due to its higher synaptic degree). Dashed red lines are extrasynaptic links. Solid black lines are chemical or electrical synapses.
Fig 6
Fig 6. Neuropeptide networks.
(A) Adjacency matrix showing the synaptic (magenta) and neuropeptide (green) networks. (B) Multilayer reducibility dendrograms for individual neuropeptide networks. Layers close on the dendrogram have more overlapping edges and are more reducible. Branching height gives the Jensen-Shannon distance between the layers. Wired and monoamine layers are italicized and indicated with green (MA), blue (gap junction), or magenta (synaptic) boxes. (C) Multilayer expansion of wired, monoamine, and neuropeptide networks. Node positions are the same in all layers.
Fig 7
Fig 7. Modes of interaction between connectome layers.
Shown are overrepresented and underrepresented multilink motifs for 3-layer networks consisting of synaptic, gap junction and monoamine (aggregate or individual MA) layers. (A) Multilink motif IDs. These correspond to all possible configurations of links between two neurons allowing for: no connection of a given type (dotted line), directed extrasynaptic monoamine links (Ext, represented as arrows on the top), bidirectional gap junctions (represented as bars in the middle) and synapses (represented as inverted arrowheads on the bottom line). (B-C) Motif z-scores for aggregate monoamines (B), dopamine (C), serotonin (D) or octopamine (E) 3-layer multilink. Plots for tyramine and dop-5/6-containing monoamine multilink are in S3 Fig. Over-represented motifs are represented by red upward-pointing triangles. Under-represented motifs are represented by blue downward-pointing triangles. Non-significant motifs are shown by black squares. Values for randomized null model networks are shown as grey crosses. Asterisks report the significance level using the z-test, with Bonferroni-adjusted p-values: * indicates p ≤ 0.05; ** indicates p ≤ 0.01; *** indicates p ≤ 0.001; **** indicates p ≤ 0.0001. Observed and expected multilink frequencies are in Table 5. Examples of monoamine motif 10 are listed in Table 6.

References

    1. Bullmore E, Sporns O. Complex brain networks: graph theoretical analysis of structural and functional systems. Nature reviews Neuroscience. 2009;10(3):186–98. Epub 2009/02/05. 10.1038/nrn2575 - DOI - PubMed
    1. White J, Southgate E, Thomson J, Brenner S. The structure of the nervous system of the nematode Caenorhabditis elegans Phil Trans R Soc Lond (Biol). 1986;314:1–340. - PubMed
    1. Albertson DG, Thomson JN. The pharynx of Caenorhabditis elegans. Philos Trans R Soc Lond B Biol Sci. 1976;275:299–325. - PubMed
    1. Stam CJ, Reijneveld JC. Graph theoretical analysis of complex networks in the brain. Nonlinear Biomed Phys. 2007;1(1):3 Epub 2007/10/03. PubMed Central PMCID: PMC1976403. 10.1186/1753-4631-1-3 - DOI - PMC - PubMed
    1. Varshney LR, Chen BL, Paniagua E, Hall DH, Chklovskii DB. Structural properties of the Caenorhabditis elegans neuronal network. PLoS computational biology. 2011;7(2):e1001066 Epub 2011/02/10. PubMed Central PMCID: PMC3033362. 10.1371/journal.pcbi.1001066 - DOI - PMC - PubMed

Publication types

Substances