. 2016 Dec 15;167(7):1853-1866.e17.
doi: 10.1016/j.cell.2016.11.038.

Perturb-Seq: Dissecting Molecular Circuits with Scalable Single-Cell RNA Profiling of Pooled Genetic Screens

Affiliations

Perturb-Seq: Dissecting Molecular Circuits with Scalable Single-Cell RNA Profiling of Pooled Genetic Screens

Atray Dixit et al. Cell. .

Abstract

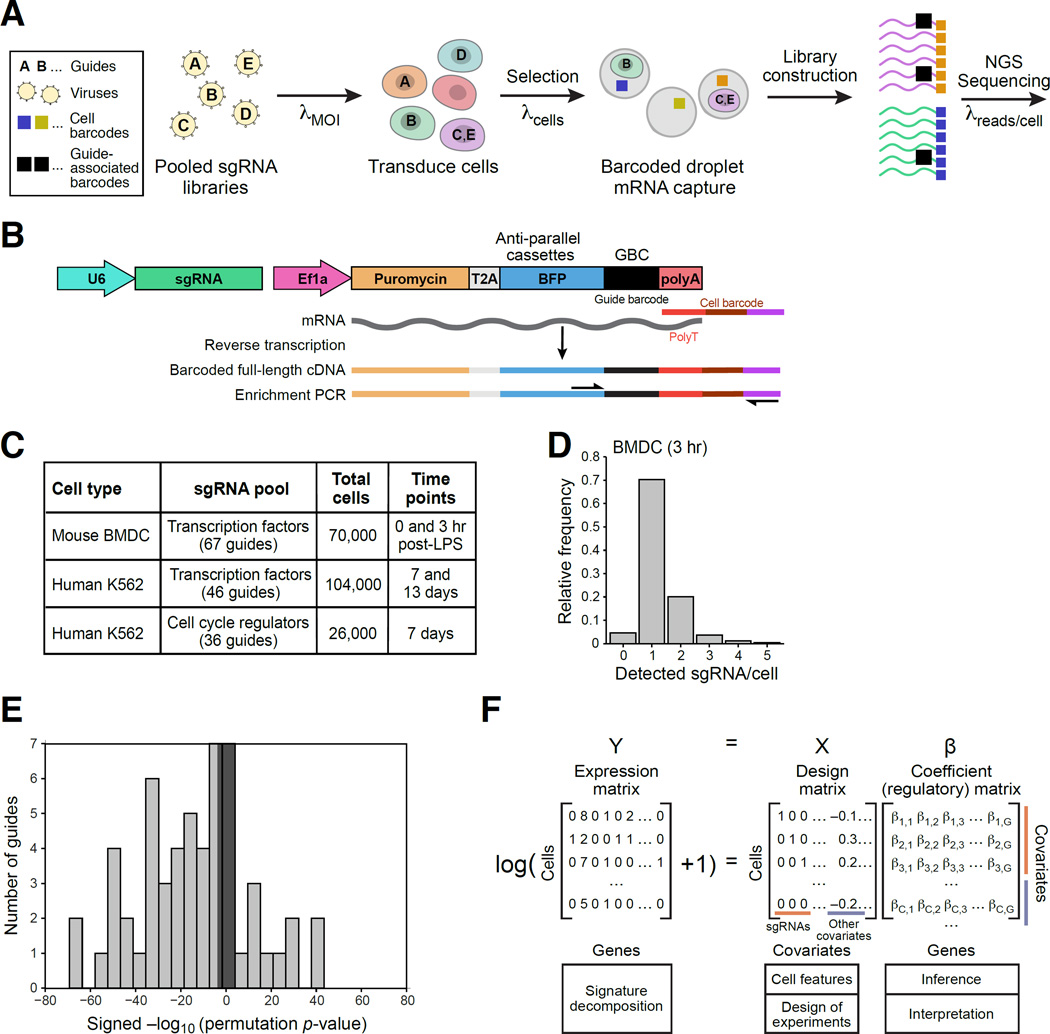
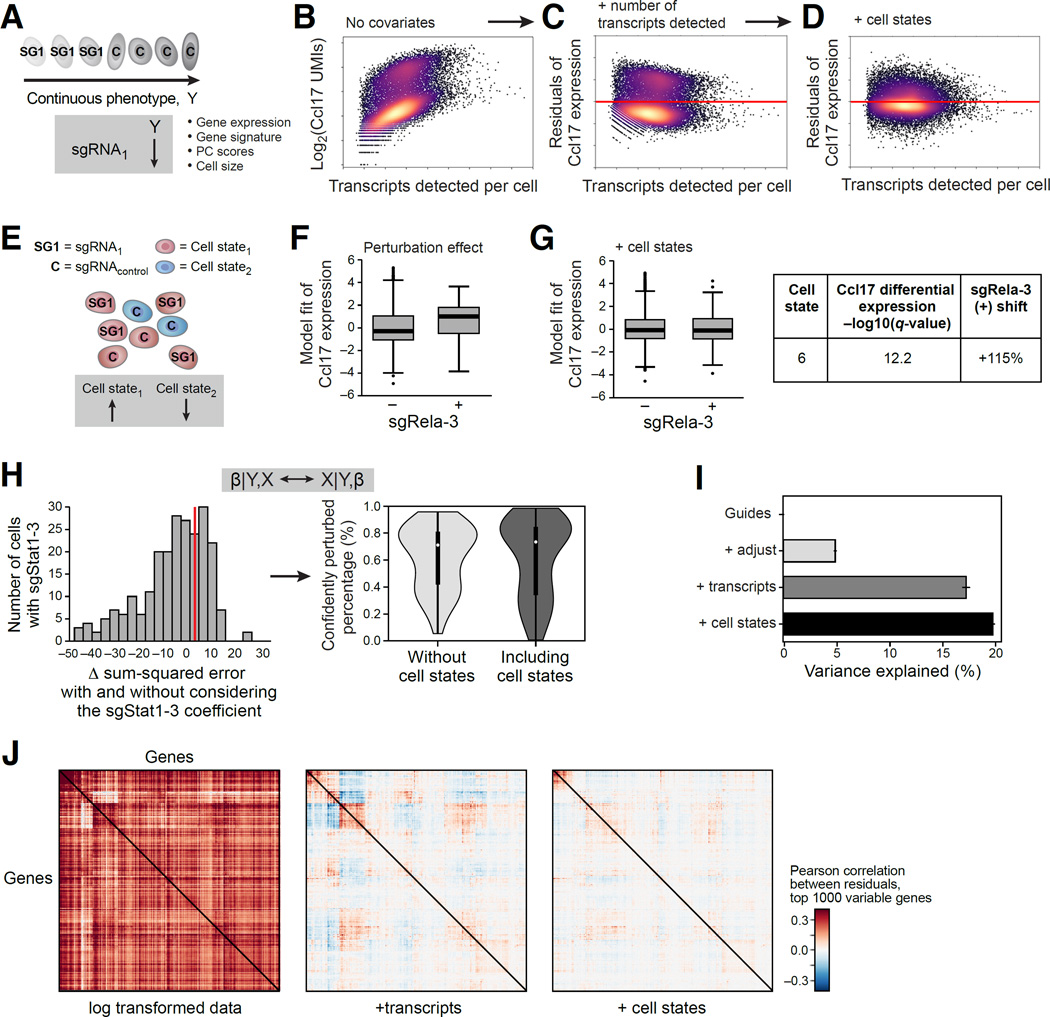
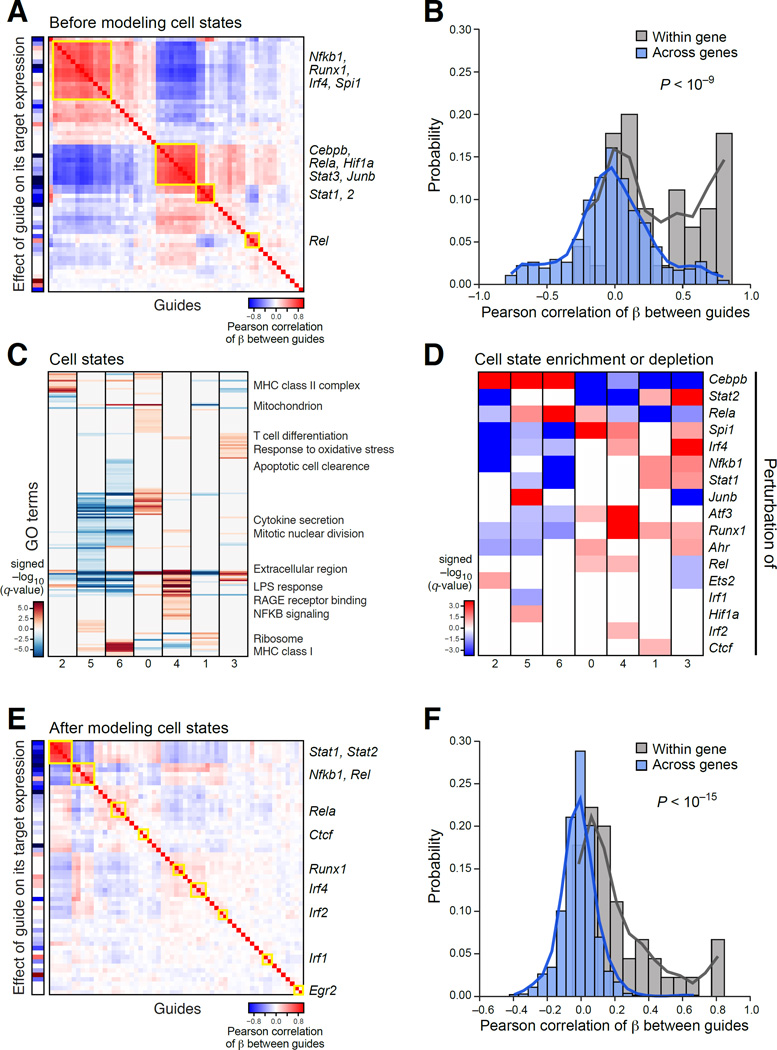
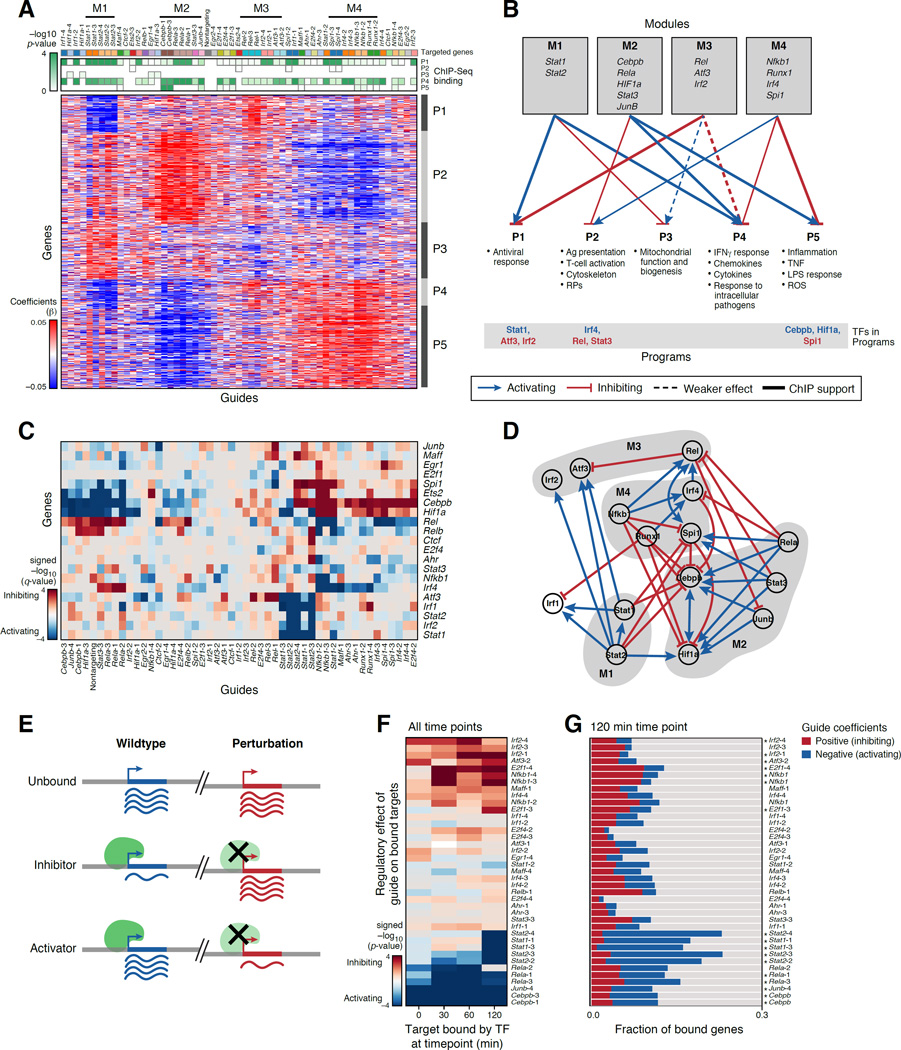
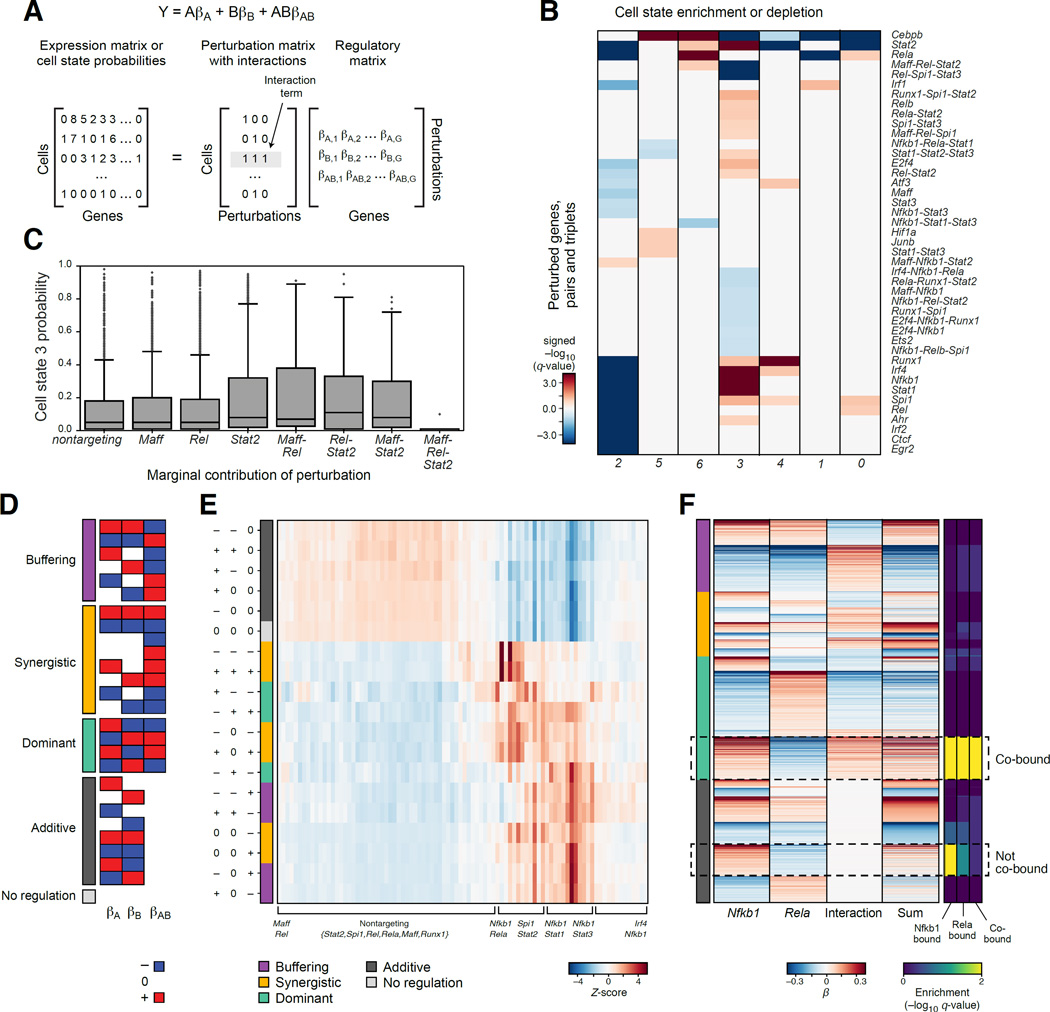
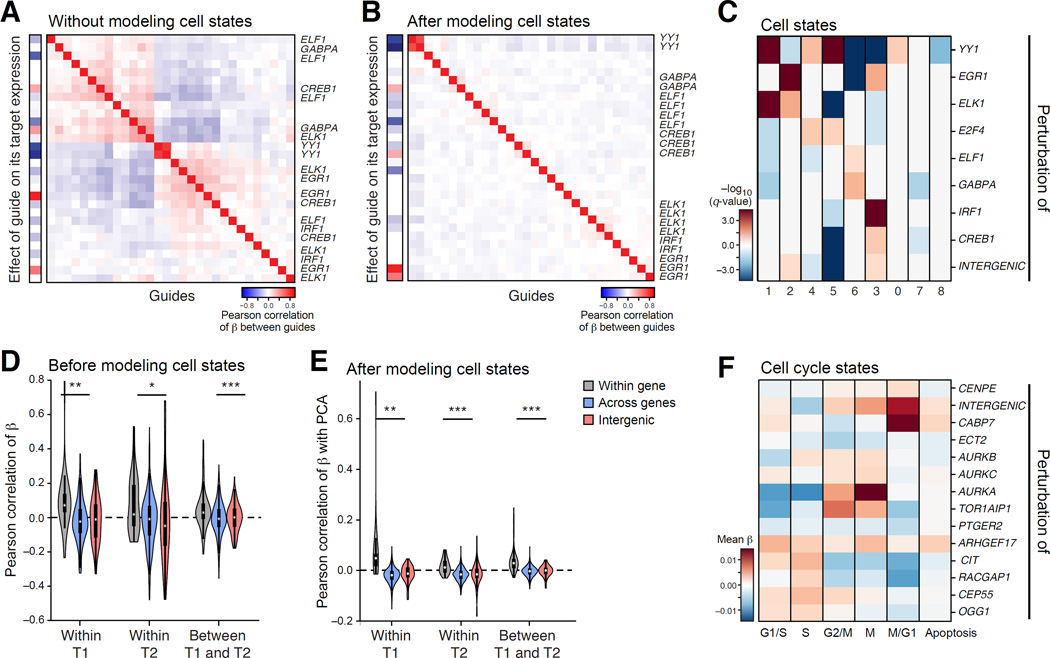
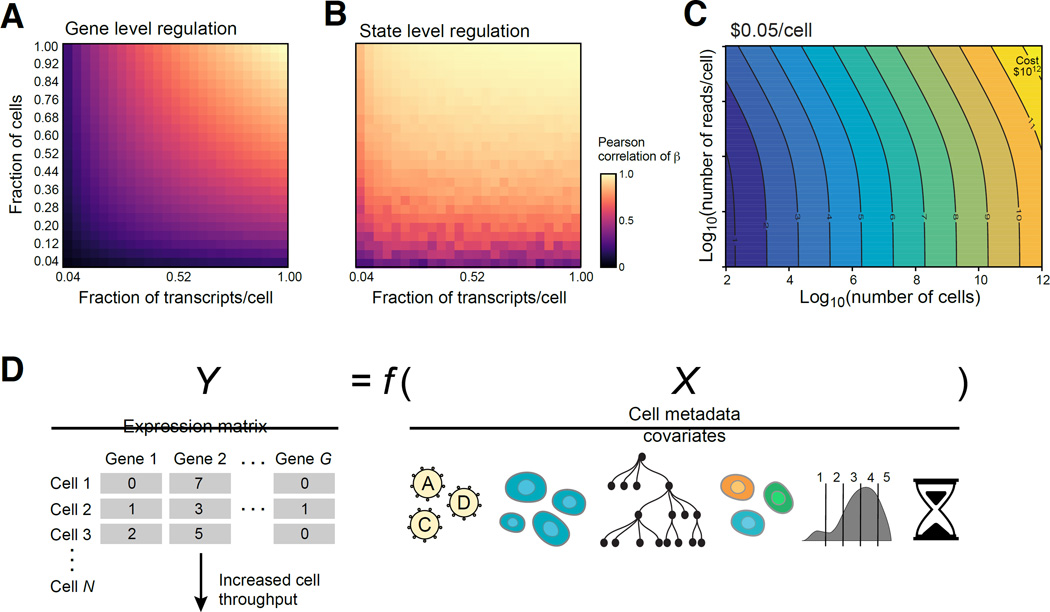
Genetic screens help infer gene function in mammalian cells, but it has remained difficult to assay complex phenotypes-such as transcriptional profiles-at scale. Here, we develop Perturb-seq, combining single-cell RNA sequencing (RNA-seq) and clustered regularly interspaced short palindromic repeats (CRISPR)-based perturbations to perform many such assays in a pool. We demonstrate Perturb-seq by analyzing 200,000 cells in immune cells and cell lines, focusing on transcription factors regulating the response of dendritic cells to lipopolysaccharide (LPS). Perturb-seq accurately identifies individual gene targets, gene signatures, and cell states affected by individual perturbations and their genetic interactions. We posit new functions for regulators of differentiation, the anti-viral response, and mitochondrial function during immune activation. By decomposing many high content measurements into the effects of perturbations, their interactions, and diverse cell metadata, Perturb-seq dramatically increases the scope of pooled genomic assays.

Keywords: CRISPR; epistasis; genetic interactions; pooled screen; single-cell RNA-seq.


Figures

Figure 1
Figure 1. Perturb-seq: pooled screening of transcriptional profiles of perturbations
(A) Overview. (B) Perturb-seq vector. (C) Perturb-seq screens in this study. (D) Distribution of number of guides detected per cell in stimulated BMDCs. (E) Distribution of the significance (−log10(P-value)) of the effect of each guide on its target (gray shaded rectangle corresponds to p<0.05 threshold). (F) Modeling framework. We fit coefficients of a (regulatory) matrix (β) to the observed expression profiles of each cell (matrix Y) given the sgRNA and other covariates in the design matrix (X). See also Figure S1.
Figure 2
Figure 2. MIMOSCA: A scalable model for Perturb-seq
(A) Model relates a continuous phenotype (arrow) to a covariate (here, guide identity). (B–D) Accounting for differences in cell quality and state. Scatter plots show for every cell (dot) the relation between the expression of Ccl17 (Y axis) or its residual after a model is fit and the number of transcripts in the cell (X axis; log (total transcripts detected)), in the original data (B), after including quality measures as covariates (C) and after also including cell state proportions (D). (E) Cell states. Cells are in either of two states (red, blue) and perturbation by sgRNA1 increases the proportion of cells in one over the other. (F,G) Accounting for cell states. Effect on Ccl17 expression (Y axis) in cells with (+) and without (−) sgRela-3, in the original model (left) and when including cell state proportions (right). Table: high Ccl17 expression in cell state 6, whose proportion changes most due to sgRela-3. (H) Distinction of cells affected or unaffected by a perturbation. Left: Distribution of number of cells with sgStat1-3 that have a given fit (X axis) to the model of the effect of this perturbation. Right: distribution of percentage of cells confidently perturbed by each guide. (I) Contribution of each model component (Y axis) to the % variance explained (X axis) by R2 values from cross-validation. (J) Correlation matrix between genes in the residuals of the model. See also Figure S2.
Figure 3
Figure 3. The role of 24 TFs in BMDCs stimulated with LPS
(A) TF modules. Pearson correlation (color bar) between the regulatory coefficients of each pair of guides (rows, columns) in a model without cell state covariates. Yellow rectangles: TF modules. Leftmost column: on-target effect. (B) Agreement between guides targeting the same gene. Distribution of correlations between guides targeting the same gene (grey) or different genes (blue). (C) Cell states. Enrichment (−log10(q-value)) of induced (red) and repressed (blue) genes with GO gene sets (rows) in each cell state (columns) defined for wild-type stimulated BMDC. (D) TF effects on cell state proportions. q-values for enrichment (red) or depletion (blue) of guides in cells in each state (columns; as in C). (E, F) TF-specific effects. Heatmap (E) as in (A) in a model with cell state covariates. Distribution of correlations (F) between guides targeting the same (grey) or different genes (blue). See also Figure S3.
Figure 4
Figure 4. A gene regulatory circuit for BMDCs balances states and responses
(A,B) TF modules controlling transcriptional programs. (A) Regulatory coefficient (β) of each guide (columns, color coded) on each gene (rows) in a model without cell state covariates. Guides and genes are clustered. Green-white: enrichment of ChIP-bound targets of each TF (columns) in each program (rows). (B) Graph, based on (A), associating TF modules (top) to programs (bottom). Blue/red arrows: module TFs activate/inhibit program (opposite of regulatory coefficient). Bottom: module TFs that are members of program (blue/red: activator/repressor of program). (C,D) TF circuit. (C) Heatmap, as in (A), but only of genes (rows) that encode TFs targeted by guides (columns). (D) Schematic of the associations in (C). Nodes: TFs; Blue/red arrows: activation/inhibition; Modules: grey shading. (E–G) Agreement with ChIP-seq. (E) Expected effects of TF perturbation. (F) Average regulatory effect of each guide (rows) on the genes bound by its target at four time points (columns). (G) Proportion of bound targets at 120 min post-LPS for each TF (rows) that are repressed (blue), activated (red) or unaffected (grey) by the TF’s perturbation. Asterisks: significant (as in F, P < 0.05). See also Figure S4.
Figure 5
Figure 5. Genetic interactions between TFs in BMDCs
(A) Model with interactions. (B) TF interactions affecting cell states in stimulated BMDCs. Enrichment (red) or depletion (blue) of single, pair and triplets of guides (rows) in cells in each state (as in Figure 3C). (C) Three-way genetic interaction reduces probability of cell state 3. Probabilities of assignment to cell state 3 of the individual, pair-wise and three-way interactions. (D) 27 genetic interaction categories between two genes (A,B), with positive (red), negative (blue) or no (white) regulatory coefficients marginally associated with each individual guide or their combination. (E) Distribution of target genes in each of the 27 categories (rows) for every pair of perturbations assayed for interaction (columns). (F) Genetic interaction between Rela and Nfkb1 associated with co-binding. Marginal regulatory coefficients for Rela, Nfkb1 and their interaction term for each gene (rows) with at least one non-zero coefficient, sorted by key categories (color code, left). Right: ChIP-seq enrichment of individually bound and co-bound targets in each group.
Figure 6
Figure 6. Perturb-seq of non-essential TFs and cell cycle regulators in K562 cells
(A–E) TFs. (A,B) Modules. As in Figure 3A, for models either without (A) or with (B) cell state covariates. (C) TFs effects on cell state proportions. As in Figure 3D, for TFs (rows) in each state (shown in Figure S6G). (D,E) Agreement of guide effects across time points. Distribution of correlations between guides targeting the same gene (grey), different genes (blue) and a gene and an intergenic region (red) within and across time points (T1=7d, T2=14d), in either a model that does not (D) or does (E) include cell state covariates. (F) Cell cycle regulators. The effect (color bar, average regulatory coefficients) of guides targeting each gene (rows) on cell cycle phase signatures (columns). See also Figure S6.
Figure 7
Figure 7. Prospects for Perturb-seq
(A,B) Saturation analysis. Effect of the number of cells (Y axis) and reads (X axis) on recovery as measured by correlation (color bar) with either the per gene (A) or cell state signature (B) effects observed in the full data. The number of cells per perturbation (1.0) is a mean of 300 and a median of 155 and the number of transcripts per cell (1.0) is a median of 5,074. (C) Tradespace of number of cells (X axis) and measurements per cell (Y axis) required for scaling Perturb-seq. (D) Future extensions, by scaling the number of cells (left) or incorporating other cell covariates (right), such as lineage (tree), marker expression (binned distribution), or time course information (timer), and a more generalized modeling of the relationship between X and Y (Y=f(X)).

Comment in

References

    1. Adamson B, Norman TM, Jost M, Cho MY, Nunez JK, Chen Y, Villalta JE, Gilbert LA, Horlbeck MA, Hein MY, et al. A multiplexed single-cell CRISPR screening platform enables systematic dissection of the unfolded protein response. Cell. 2016 - PMC - PubMed
    1. Amit I, Garber M, Chevrier N, Leite AP, Donner Y, Eisenhaure T, Guttman M, Grenier JK, Li W, Zuk O, et al. Unbiased Reconstruction of a Mammalian Transcriptional Network Mediating Pathogen Responses. Science (80-.) 2009a;326:257–263. - PMC - PubMed
    1. Amit I, Garber M, Chevrier N, Leite AP, Donner Y, Eisenhaure T, Guttman M, Grenier JK, Li W, Zuk O, et al. Unbiased reconstruction of a mammalian transcriptional network mediating pathogen responses. Science. 2009b;326:257–263. - PMC - PubMed
    1. Bassik MC, Kampmann M, Lebbink RJ, Wang S, Hein MY, Poser I, Weibezahn J, Horlbeck Ma, Chen S, Mann M, et al. A systematic mammalian genetic interaction map reveals pathways underlying ricin susceptibility. Cell. 2013;152:909–922. - PMC - PubMed
    1. Beerenwinkel N, Pachter L, Sturmfels B. Epistasis and Shapes of Fitness Landscapes. Stat. Sin. 2007;17:1317–1342.

Substances