. 2016 Dec 15;167(7):1867-1882.e21.
doi: 10.1016/j.cell.2016.11.048.

A Multiplexed Single-Cell CRISPR Screening Platform Enables Systematic Dissection of the Unfolded Protein Response

Affiliations

A Multiplexed Single-Cell CRISPR Screening Platform Enables Systematic Dissection of the Unfolded Protein Response

Britt Adamson et al. Cell. .

Abstract

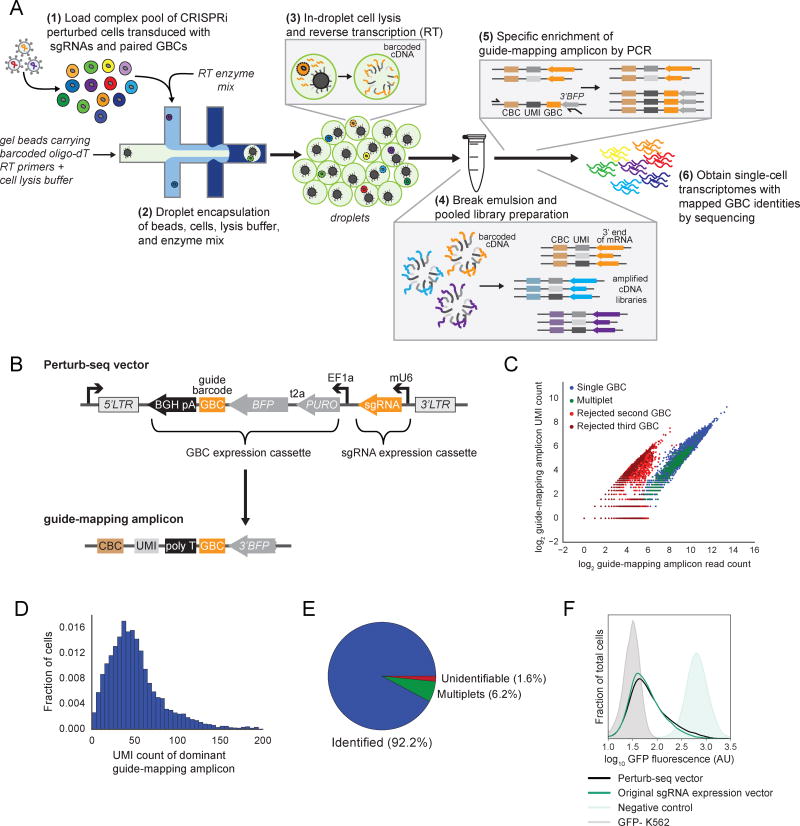
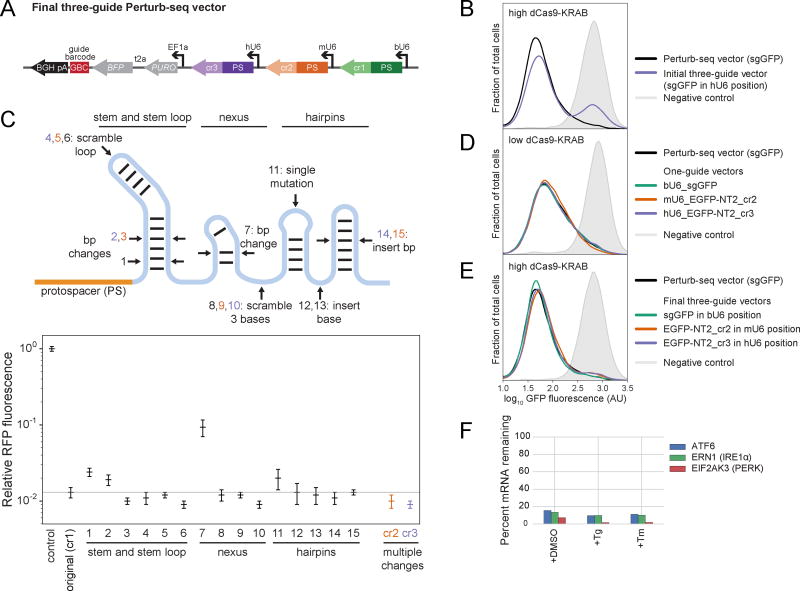
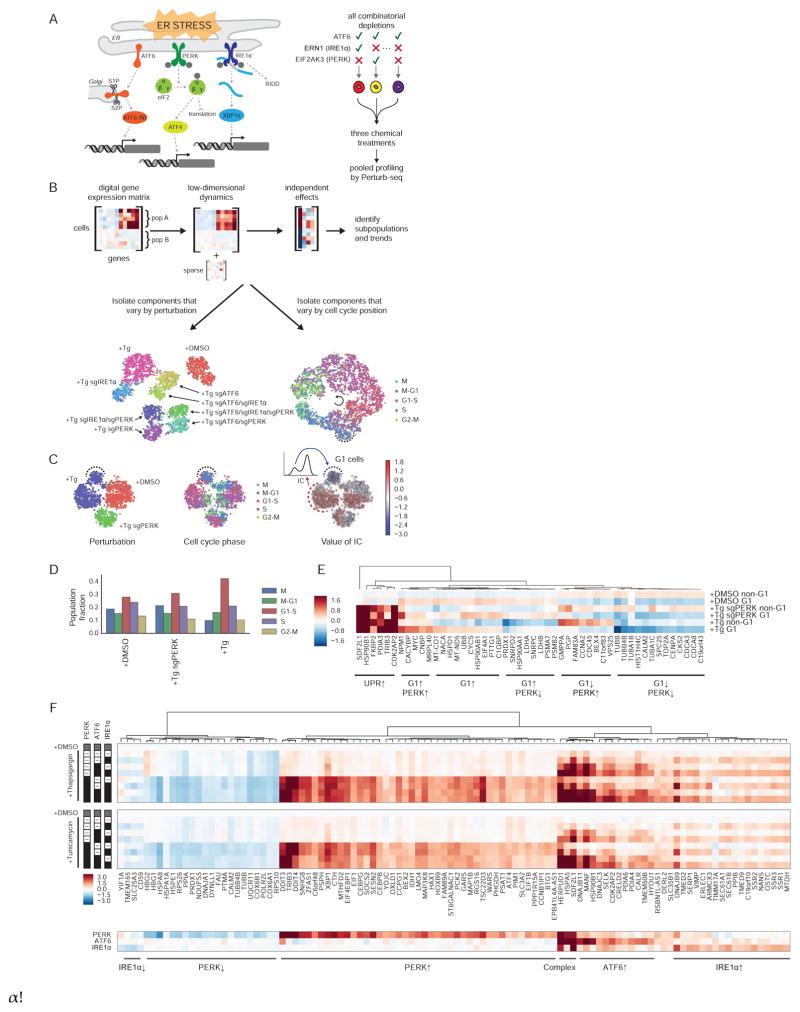
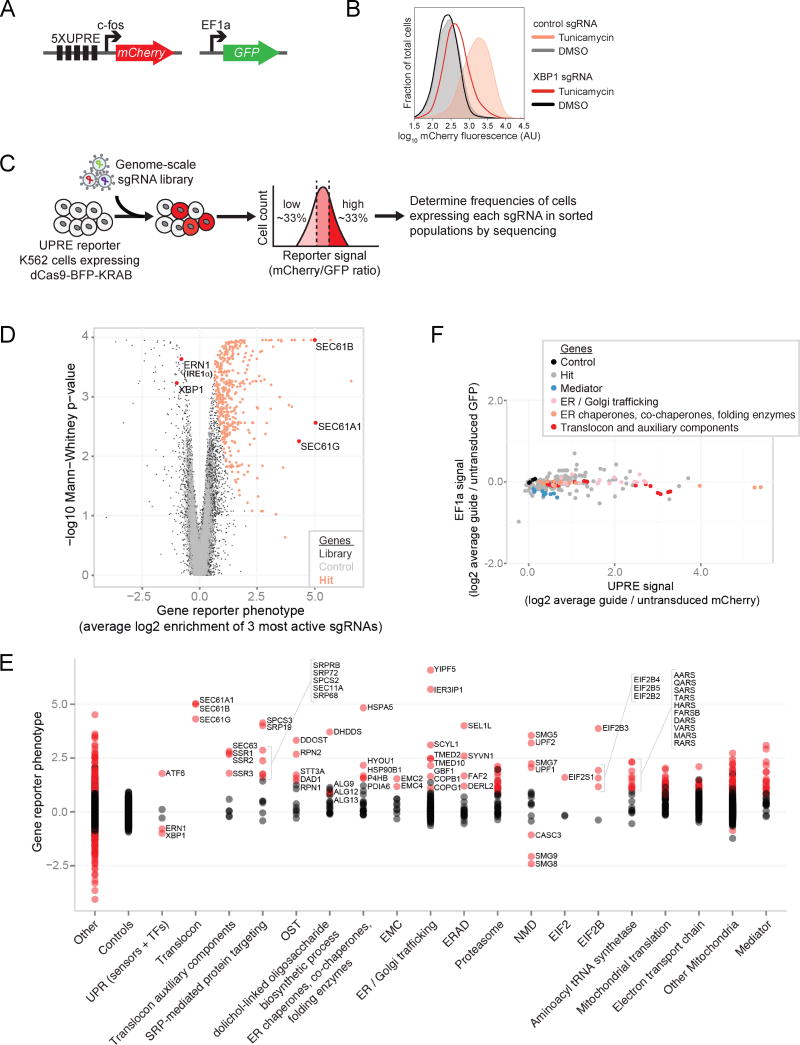
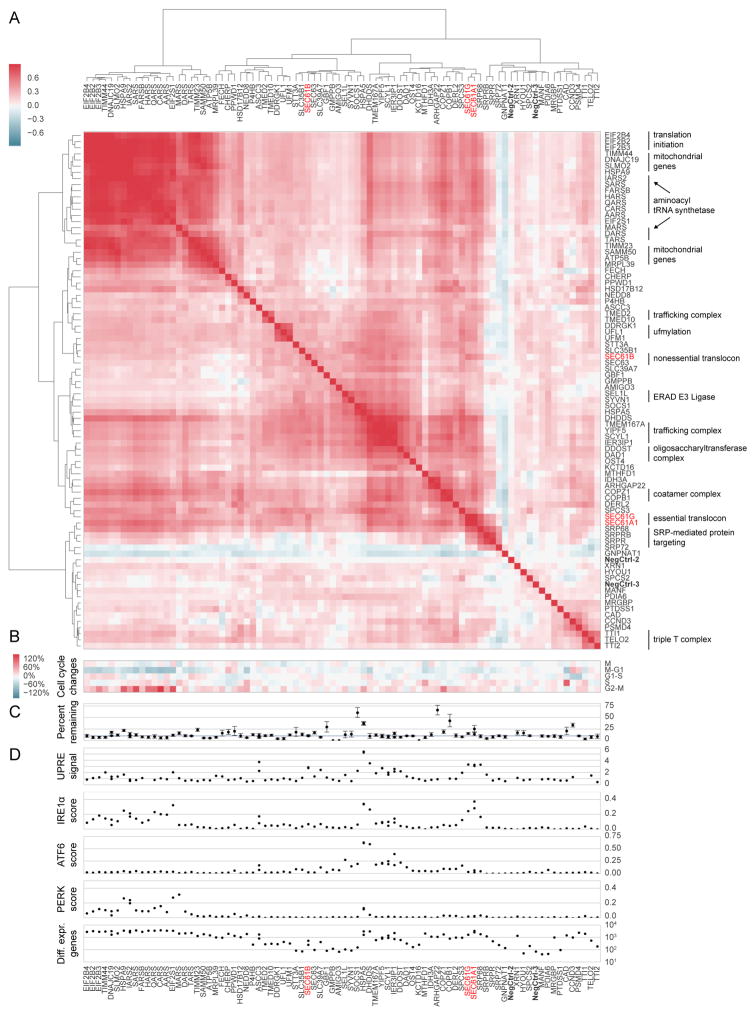
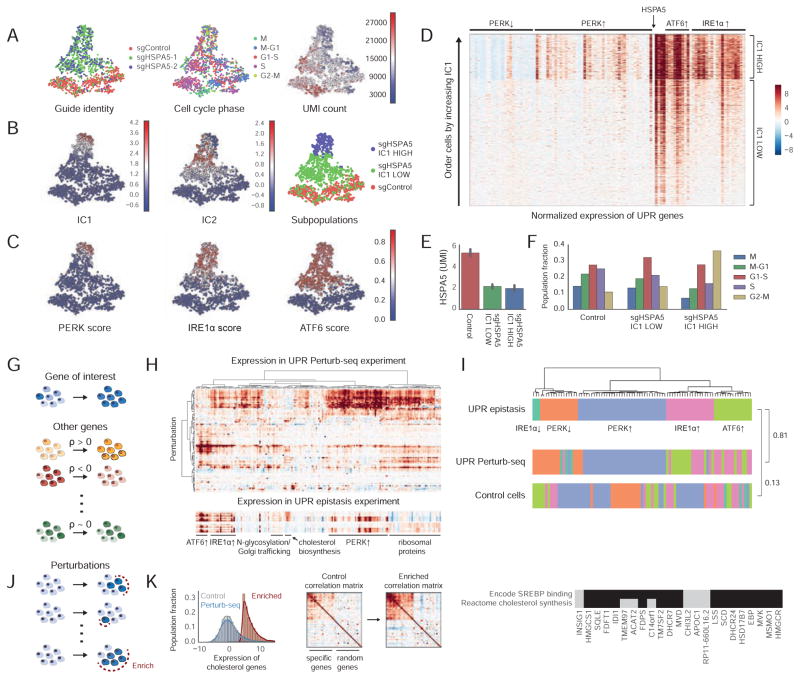
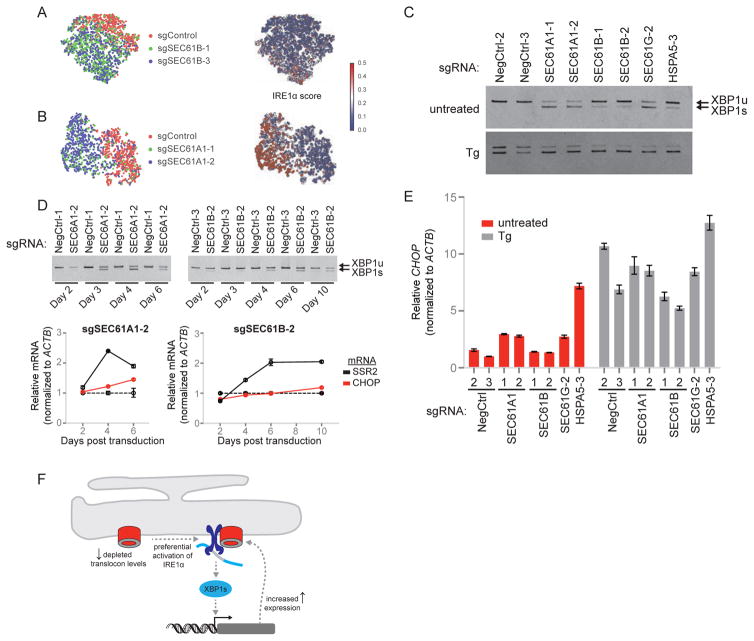
Functional genomics efforts face tradeoffs between number of perturbations examined and complexity of phenotypes measured. We bridge this gap with Perturb-seq, which combines droplet-based single-cell RNA-seq with a strategy for barcoding CRISPR-mediated perturbations, allowing many perturbations to be profiled in pooled format. We applied Perturb-seq to dissect the mammalian unfolded protein response (UPR) using single and combinatorial CRISPR perturbations. Two genome-scale CRISPR interference (CRISPRi) screens identified genes whose repression perturbs ER homeostasis. Subjecting ∼100 hits to Perturb-seq enabled high-precision functional clustering of genes. Single-cell analyses decoupled the three UPR branches, revealed bifurcated UPR branch activation among cells subject to the same perturbation, and uncovered differential activation of the branches across hits, including an isolated feedback loop between the translocon and IRE1α. These studies provide insight into how the three sensors of ER homeostasis monitor distinct types of stress and highlight the ability of Perturb-seq to dissect complex cellular responses.

Keywords: CRIPSRi; CRISPR; Single-cell RNA-seq; cell-to-cell heterogeneity; genome-scale screening; single-cell genomics; unfolded protein response.


Figures

Figure 1
Figure 1. A robust strategy for genetic screens using single-cell gene expression profiling
(A) Schematic of the Perturb-seq platform. CBC, cell barcode (index unique to each bead). UMI, unique molecular identifier (index unique to each bead oligo). GBC, guide barcode (index unique to each sgRNA). (B) Schematic of the Perturb-seq vector and guide-mapping amplicon. (C) Performance of GBC capture. Top 3 possible GBCs for each CBC. CBC identity was assigned to sgRNA identity when a single GBC dominated (blue dots) and any lower abundance GBCs were rejected (red dots). CBC was identified as a “multiplet” when a second or third GBC also had good coverage (green dots). Compare with (D,E). (D) Distribution of captured UMIs from dominant guide-mapping amplicons. (E) Performance of perturbation (sgRNA) identification. Data also represented in Figure S1B. (F) Kernel density estimates of normalized flow cytometry counts representing GFP expression and knockdown achieved from the indicated sgRNA expression constructs. See also Figure S1.
Figure 2
Figure 2. Strategy for multiplexed delivery of CRISPR sgRNAs in a single expression vector
(A) Schematic of the final three-guide Perturb-seq vector. “PS” denotes protospacer. (B) Kernel density estimates of normalized flow cytometry counts representing GFP expression and knockdown achieved from the indicated sgRNA expression constructs. (C) Top: Schematic of sgRNA constant region with indicated changes. Orange, cr2 changes. Purple, cr3 changes. Bottom: Relative RFP from an E. coli CRISPRi reporter strain expressing an sgRNA with the indicated constant region variant and an mRFP-targeting protospacer. Data represent mean fluorescence of replicates normalized to negative control sgRNA ± standard deviations (n = 3). (D) Kernel density estimates of normalized flow cytometry counts representing GFP expression and knockdown achieved from the indicated sgRNA expression constructs. For details on one-guide vectors see Figure S2F and Methods. (E) Kernel density estimates of normalized flow cytometry counts representing GFP expression and knockdown achieved from the indicated sgRNA expression constructs. Data for the Perturb-seq vector is the same as in panel (B). (F) Average percent mRNA remaining after simultaneous gene repression of ERN1 (IRE1α), EIF2AK3 (PERK), and ATF6 using a final three-guide Perturb-seq vector determined via Perturb-seq. See also Figure S2.
Figure 3
Figure 3. Defining the three arms of the unfolded protein response using Perturb-seq
(A) Schematics of the unfolded protein response (UPR) and Perturb-seq UPR epistasis experiment. (B) Unbiased identification and decoupling of single-cell behaviors via low rank independent component analysis (LRICA) in UPR epistasis experiment. Gene expression in cells (dots) is reduced to components identifying major trends in the population. Plots show t-sne projections of components that vary across genetic perturbations and chemical treatments (bottom left) or cell cycle position (bottom right). Tg, thapsigargin. DMSO-treated control cells (+DMSO) contain non-targeting control sgRNAs (throughout Figure 3). (C) Plots (t-sne) of perturbation subpopulations (indicated GBC/treatment pairs: +DMSO and Tg-treated cells with or without PERK) from UPR epistasis experiment. LRICA identified a component (IC) that is bimodal within each of these subpopulations and marks G1 cells. (D) Cell cycle composition of perturbation subpopulations from panel (C). (E) Perturbation subpopulations from panel (C) were further divided into G1 and non-G1 cells based on IC value. Heatmap displays normalized expression of the 50 genes that most influenced IC, exposing both synergistic and antagonistic interactions. (F) Genetic interactions among the three branches of the UPR. Top: Heatmap displays average expression profiles of 104 genes that strongly varied within the UPR epistasis experiment for each perturbation (i.e. indicated GBC/treatment pairs). Genes were clustered by their expression pattern within the entire population (i.e. all cells in all conditions). These patterns determine the branch specificity of each gene. Bottom: Unbiased decomposition of the total response into three components obtained via ICA. See also Figure S3.
Figure 4
Figure 4. Genome-scale CRISPRi screening to identify gene depletion events that induce the IRE1α branch of the UPR
(A) Schematic of UPRE and constitutive EF1a reporter cassettes. (B) K562 reporter (cBA011) cells were transduced with the indicated sgRNAs and treated with 2 μg/mL tunicamycin or DMSO after 4 days. Approximately 12 hr later, these cells were evaluated by flow cytometry. Data are representative of two independent experiments. (C) Schematic of CRISPRi screens. (D) Volcano plot of gene reporter phenotypes and p-values from CRISPRi-v2 screen. Gray indicates data generated from negative control sgRNAs. Pink indicates screen hits. (E) Gene reporter phenotypes from CRISPRi-v2 screen (as in D) by functional category. Red indicates screen hits. See also Table S7. (F) Comparison of UPRE and EF1a signals from K562 reporter (cBA011) cells transduced with 257 sgRNAs targeting 152 hit genes from the CRISPRi-v2 screen and 3 distinct negative controls. Data represent log2 averages of background-adjusted fluorescence medians (normalized to untransduced cells) collected from four separate experiments (n = 2–7 replicates). See also Figure S4.
Figure 5
Figure 5. A large-scale Perturb-seq experiment interrogating ER homeostasis
(A) Functional clustering of genes from UPR Perturb-seq experiment. Heatmap displays correlations between hierarchically clustered average expression profiles from all cells bearing sgRNAs targeting the same gene (identified by GBCs). Functional annotations are indicated. (B) Change in cell cycle composition induced by indicated genetic perturbations (identified by GBC) relative to control (NegCtrl-2) cells. (C) Average percent target mRNA remaining from each subpopulation (identified by GBC). Genes targeted by multiple sgRNAs have multiple, possibly overlapping dots. Error bars are 95% CI estimated by bootstrapping. (D) Individually evaluated UPRE signal phenotypes (data for hit genes also represented in Figure 4F) and scores measuring activation of the three UPR branches for each genetic perturbation. Final panel represents the log10 number of genes differentially expressed relative to control cells measured by the Kolmogorov-Smirnov test at P < 0.01. See also Figure S5.
Figure 6
Figure 6. Single-cell information reveals a bifurcated UPR within a population and allows unbiased discovery of UPR-controlled genes
(A) Single-cell projections (t-sne) of sgRNA identity, cell cycle position, and UMI count per cell in HSPA5-perturbed and control cells (containing the NegCtrl-3 guide). We note that the HSPA5-targeting sgRNAs indicated differ by only 1-nt (Table S1). (B) LRICA analysis of HSPA5-perturbed cells identifies two subpopulation-defining independent components. Right panel: subpopulations defined by thresholding IC1. (C) Branch activation scores in HSPA5-perturbed cells. (D) Normalized expression of UPR genes in HSPA5-perturbed cells. Each row is a cell, ordered by increasing IC1, and each column is a gene in the same order as Figure 3F. (E) Mean expression of HSPA5 across subpopulations. Error bars are 95% CI. (F) Cell cycle composition of HSPA5-perturbed cells. (G) Strategy for using correlated expression to identify functionally related genes. (H) Unbiased identification of induced gene expression programs. Top: Normalized expression of 200 genes with significantly altered expression in UPR Perturb-seq experiment clustered based on co-expression. Bottom: Normalized expression in UPR epistasis experiment, to assess UPR dependence. Full version in Figure S6A. (I) UPR-responsive genes with altered expression in the UPR Perturb-seq experiment clustered by co-expression in the UPR epistasis experiment, the UPR Perturb-seq experiment, and control cells. Cophenetic correlation coefficients between dendrograms along with a visual guide to the movement of major groups included. Full version in Figure S6B. (J) Strategy for enriching cells perturbed for a trait of interest. (K). Within cells enriched for a set of bait cholesterol biosynthesis genes, a group of genes clustered with the bait genes and had more correlated expression than in control cells. Reactome annotations and SREBP binding data for the group included (right panel). See also Figure S6.
Figure 7
Figure 7. Translocon Gene Repression Preferentially Activates IRE1α UPR Signaling
(A) Single-cell analysis of SEC61B-perturbed cells in UPR Perturb-seq experiment. Control cells contain the NegCtrl-3 guide. (B) Analysis of SEC61A1-perturbed cells (as in A). (C) XBP1 mRNA splicing from cells transduced with the indicated sgRNAs and treated ± thapsigargin (0.5 μM Tg for 1.5 hr). (D) XBP1 mRNA splicing (top) and SSR2 and CHOP mRNA expression (bottom) from cells transduced with the indicated sgRNAs. Graphical data represent means relative to ACTB mRNA and normalized to cells transfected with NegCtrl-1 sgRNA (dotted lines) ± standard error of technical replicates (n = 3). (E) Relative CHOP mRNA in cells described in (C). Data represent means relative to ACTB mRNA and normalized to cells transfected with NegCtrl-3 sgRNA ± standard error of technical replicates (n = 3). (F) Model of translocon feedback signaling through IRE1α. See also Figure S7.

Comment in

Similar articles

Cited by

References

    1. Acosta-Alvear D, Zhou Y, Blais A, Tsikitis M, Lents NH, Arias C, Lennon CJ, Kluger Y, Dynlacht BD. XBP1 controls diverse cell type- and condition-specific transcriptional regulatory networks. Mol Cell. 2007;27:53–66. - PubMed
    1. Boettcher M, McManus MT. Choosing the right tool for the job: RNAi, TALEN, or CRISPR. Mol Cell. 2015;58:575–585. - PMC - PubMed
    1. Candès EJ, Li X, Ma Y, Wright J. Robust principal component analysis? Journal of the ACM (JACM) 2011;58:11.
    1. Carbon S, Ireland A, Mungall CJ, Shu S, Marshall B, Lewis S. AmiGO: online access to ontology and annotation data. Bioinformatics. 2009;25:288–289. - PMC - PubMed
    1. Friedman J, Hastie T, Tibshirani R. Springer series in statistics. Springer; Berlin: 2001. The elements of statistical learning.

Substances