. 2017 Mar;124(3):359-373.
doi: 10.1016/j.ophtha.2016.10.022. Epub 2016 Dec 13.

Natural History of the Central Structural Abnormalities in Choroideremia: A Prospective Cross-Sectional Study

Affiliations

Natural History of the Central Structural Abnormalities in Choroideremia: A Prospective Cross-Sectional Study

Tomas S Aleman et al. Ophthalmology. 2017 Mar.

Abstract

Purpose: To describe in detail the central retinal structure of a large group of patients with choroideremia (CHM).

Design: A prospective, cross-sectional, descriptive study.

Participants: Patients (n = 97, age 6-71 years) with CHM and subjects with normal vision (n = 44; ages 10-50 years) were included.

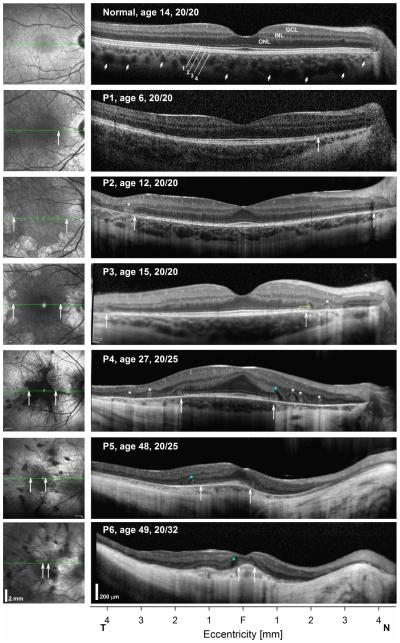
Methods: Subjects were examined with spectral-domain optical coherence tomography (SD OCT) and near-infrared reflectance imaging. Visual acuity (VA) was measured during their encounter or obtained from recent ophthalmic examinations. Visual thresholds were measured in a subset of patients (n = 24) with automated static perimetry within the central regions (±15°) examined with SD OCT.

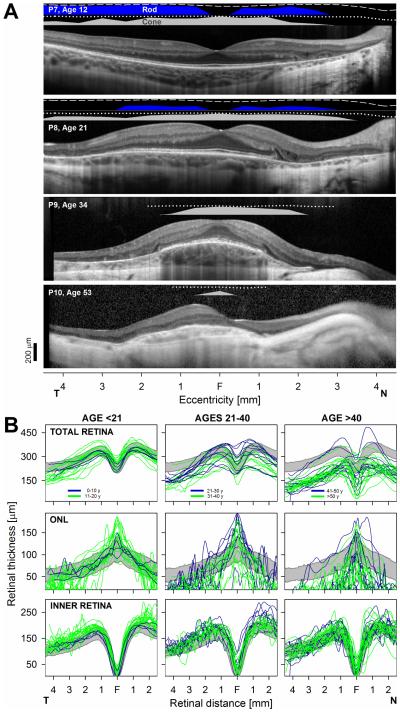
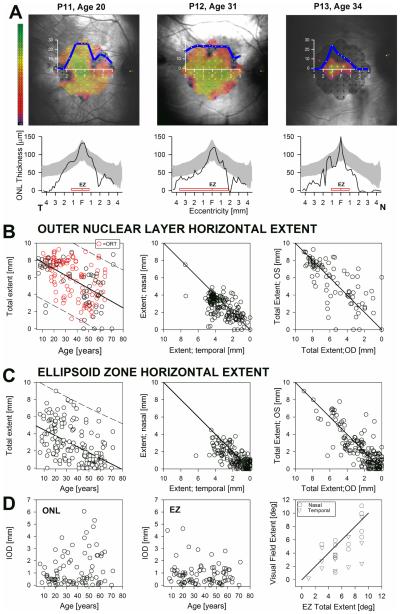
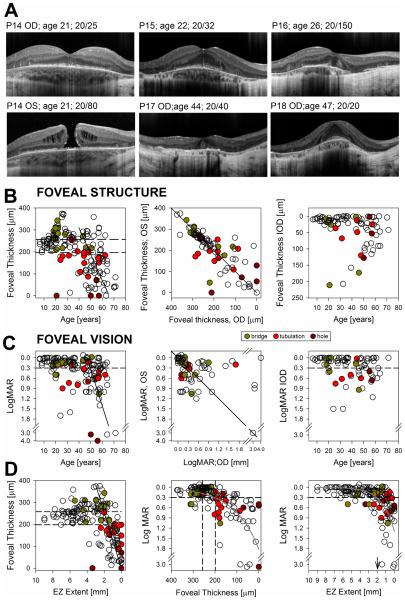
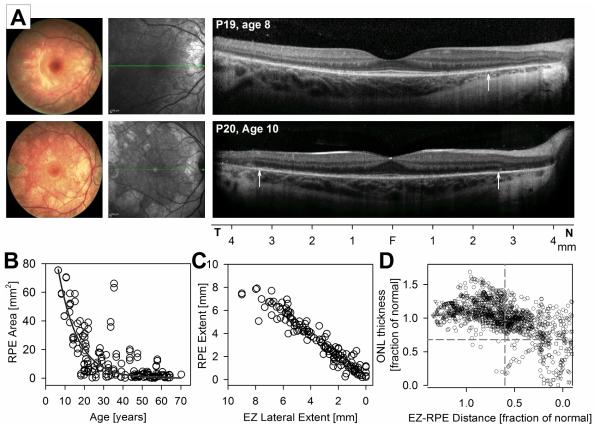
Main outcome measures: Visual acuity and visual thresholds; total nuclear layer, inner nuclear layer (INL), and outer nuclear layer (ONL) thicknesses; and horizontal extent of the ONL and the photoreceptor outer segment (POS) interdigitation zone (IZ).

Results: Earliest abnormalities in regions with normally appearing retinal pigment epithelium (RPE) were the loss of the POS and ellipsoid zone associated with rod dysfunction. Transition zones (TZs) from relatively preserved retina to severe ONL thinning and inner retinal thickening moved centripetally with age. Most patients (88%) retained VAs better than 20/40 until their fifth decade of life. The VA decline coincided with migration of the TZ near the foveal center. There were outer retinal tubulations in degenerated, nonatrophic retina in the majority (69%) of patients. In general, RPE abnormalities paralleled photoreceptor degeneration, although there were regions with detectable but abnormally thin ONL co-localizing with severe RPE depigmentation and choroidal thinning.

Conclusions: Abnormalities of the POS and rod dysfunction are the earliest central abnormalities observed in CHM. Foveal function is relatively preserved until the fifth decade of life. Migration of the TZs to the foveal center with foveal thinning and structural disorganization heralded central VA loss. The relationships established may help outline the eligibility criteria and outcome measures for clinical trials for CHM.


Figures

FIGURE 1
FIGURE 1
Progression of central structural changes in CHM. Shown are 9 mm-long horizontal SD-OCT cross-sections (right panels) through the fovea in a normal subject compared with five CHM patients representing different disease stages. Nuclear layers are labeled on the normal subject; outer photoreceptor/RPE laminae are numbered (1, ELM; 2, EZ; 3 IZ; 4, RPE), following conventional terminology. Patient’s ages and VA at time of examination are shown. NIR-REF images are shown to the left of the SD-OCT cross sections; green lines superimposed on the images indicate the location of the scan. All eyes are shown as right eyes scanning following a temporal to nasal direction. Asterisks positioned near the OPL denote locations with outer retinal tubulations (white asterisks) or with intraretinal hyperreflectivities (blue). Vertical arrows demarcate lateral extent of uninterrupted EZ at the edge of TZs. The distal outward evagination of the ELM at the nasal TZ of P2 is highlighted in yellow.
FIGURE 2
FIGURE 2
Structure and function correlations in CHM. A. 9 mm-long, non-straightened, SD-OCT cross-sections along the horizontal meridian through the fovea in patients with the earliest central abnormalities (top two panels) are compared with patients (bottom two panels) with the later abnormalities. Nuclear layers are labeled in Fig 1. Bars above the scans show psychophysically determined rod (blue bar: dark-adapted, 500-nm stimulus) and cone (gray bar: light-adapted, white stimulus) sensitivities. Lines above bars define lower limit (mean-2SD) of sensitivity for the dark-adapted (dashed lines) and light-adapted (dotted lines) conditions in normal subjects. T, temporal retina; N, nasal retina. Calibration bar to the bottom left. B. Overall retinal (total), inner retinal and ONL thicknesses along the horizontal meridian from all patients grouped by age segments roughly representing early (left panels), intermediate (middle panels) and late stages (right panels) of the disease. Within each age segment measurements are further subdivided into a first decade (blue traces) and second decade (green traces). Gray bands: normal limits (mean ± 2SD; n = 44, age range, 11-49). Only one eye shown for clarity.
FIGURE 3
FIGURE 3
Spatial progression of the central structural and functional changes in CHM. A. Top panels: sensitivity values determined with microperimetry using a 10-2 protocol (dark-adapted) and a 0.45°diameter white stimuli in representativ e patients with limited extents of viable central retina and steady foveal fixation. Sensitivity values are coded to a pseudocolor scale (left; 0 to 36 dB; mean normal = 30 dB = mid-range green) and shown overlaid an IR-REF image of the fundus obtained during the test. Superimposed is an average horizontal sensitivity profile (blue line) obtained by averaging sensitivities for locations above and below (±1°) the horizontal meridian of the 10-2 protocol grid. Bottom panels: ONL thickness plotted as a function of eccentricity for the patients shown in top panels. Gray bands: normal limits (mean ± 2SD; n = 44, age range, 11-49). Horizontal red bars: lateral extent of uninterrupted the EZ. B,C Total horizontal extent (temporal+nasal) of the ONL (B) and EZ (C) layers plotted as a function of age (left panels), as plots of the nasal versus the temporal extent (middle panel) of the right eye plotted against the contralateral eye (right panels) extent for both retinal layers. Solid lines are the linear regression fit to the data with 95% prediction intervals (dashed lines) (left panels) or equality lines (center and right). (D) Intraocular differences (IOD) for ONL and EZ total horizontal extent plotted as a function of age (left and center) and microperimetric visual field extent (right panel) as analyzed in (A) from both eyes of a subset of patients (n = 16) with CHM plotted against EZ horizontal extent. Solid line is a linear regression fit to the data. EZ extent is expressed in degrees for ease of comparison with data in 10-2 protocol grid of (A).
FIGURE 4
FIGURE 4
Foveal structure and function in CHM. A. SD-OCT horizontal cross-sections through the fovea in patients with CHM. Patients illustrate stages or orderly progression to end stage foveal thinning (top panels) similar to examples shown in Fig. 1 and snapshots of less frequent foveal changes that depart from the norm (bottom panels) in this large cross-sectional group of patients with CHM. B,C Foveal thickness (B) and visual acuity (C) plotted as a function of age (left panels), as values from the right eye plotted against the contralateral eye (middle panels) and as interocular differences (right panels) graphed as a function of age for both foveal thickness and visual acuity. Solid black lines are the manual linear fit to the data for ages >40 years (left panels) or equality line (center panels). Dashed lines represent normal limits (mean ± 2SD) for foveal thickness and 0.3 LogMAR (20/40) for visual acuity. Occurrence of foveal remodeling with the presence of intraretinal bridges or tracks, of foveal outer retina tubulations and of macular hole are denoted in each graph following legend. D. Foveal thickness plotted as a function of EZ lateral extent (left panels) and LogMAR plotted independently against these two variables (middle and right panels). Dashed lines are as in (B, C). Gray smooth curves are overlaid on data to better visualize the relationships. Black line (left panel) is a manual linear fit to the region of faster VA change as a function of EZ extent. Vertical arrow (right panel) points to the EZ extent where VA drops below the 0.3 LogMAR for most eyes.
FIGURE 5
FIGURE 5
Earliest structural change in CHM. A. Color fundus photography (left panels), NIR-REF en-face imaging (middle panels) and horizontal 9 mm SD-OCT cross-sections through the fovea in two young patients with CHM exemplifying earliest abnormalities. Vertical arrows on the SD-OCT images point to locations outside of which increased back-scattering from RPE demelanization can be appreciated. B. Area of apparent normal pigmentation of the fundus by NIR-REF plotted against age (left panel). An exponential decay function (dark gray trace) describes the data well. C. EZ lateral extent plotted as a function of the lateral extent of RPE with apparently preserved melanization. D. ONL thickness as a function of EZ-to-RPE distance. Values are specified as a fraction of the mean normal value for each retinal location. Dashed lines are the lower limit (normal mean minus 2SD) for each parameter.

References

    1. Kurstjens JH. Choroideremia and gyrate atrophy of the choroid and retina. Doc Ophthalmol. 1965;19:1–122.
    1. McCulloch C. Choroideremia: a clinical and pathologic review. Trans Am Ophthalmol Soc. 1969;67:142–195. - PMC - PubMed
    1. MacDonald IM, Hume S, Chan S, Seabra MC, Pagon RA, Adam MP, Ardinger HH, Wallace SE, Amemiya A, Bean LJH, Bird TD, Ledbetter N, Mefford HC, Smith RJH, Stephens K. GeneReviews® [Internet] University of Washington, Seattle; Seattle (WA): 1993-2016. Choroideremia. Available from: http://www.ncbi.nlm.nih.gov/books/NBK1337/ - PubMed
    1. Kärnä J, Choroideremia A clinical and genetic study of 84 Finnish patients and 126 female carriers. Acta Ophthalmol Suppl. 1986;176:1–68. - PubMed
    1. McCulloch C, McCulloch RJ. A hereditary and clinical study of choroideremia. Trans Am Acad Ophthalmol Otolaryngol. 1948;52:160–190. - PubMed