. 2017 Jan;29(1):5-19.
doi: 10.1105/tpc.16.00551. Epub 2016 Dec 16.

easyGWAS: A Cloud-Based Platform for Comparing the Results of Genome-Wide Association Studies

Affiliations

easyGWAS: A Cloud-Based Platform for Comparing the Results of Genome-Wide Association Studies

Dominik G Grimm et al. Plant Cell. 2017 Jan.

Abstract

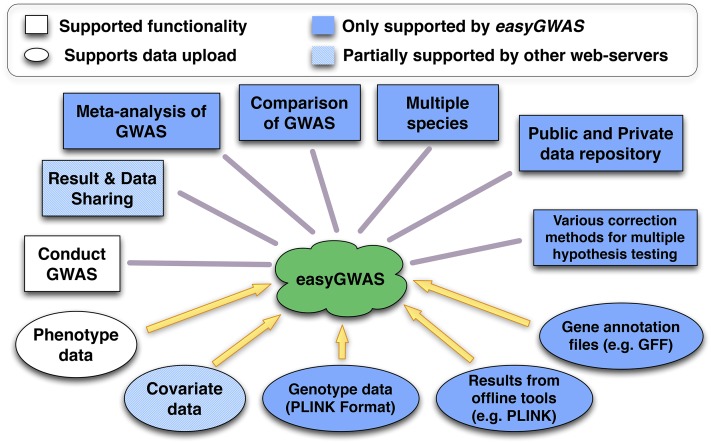
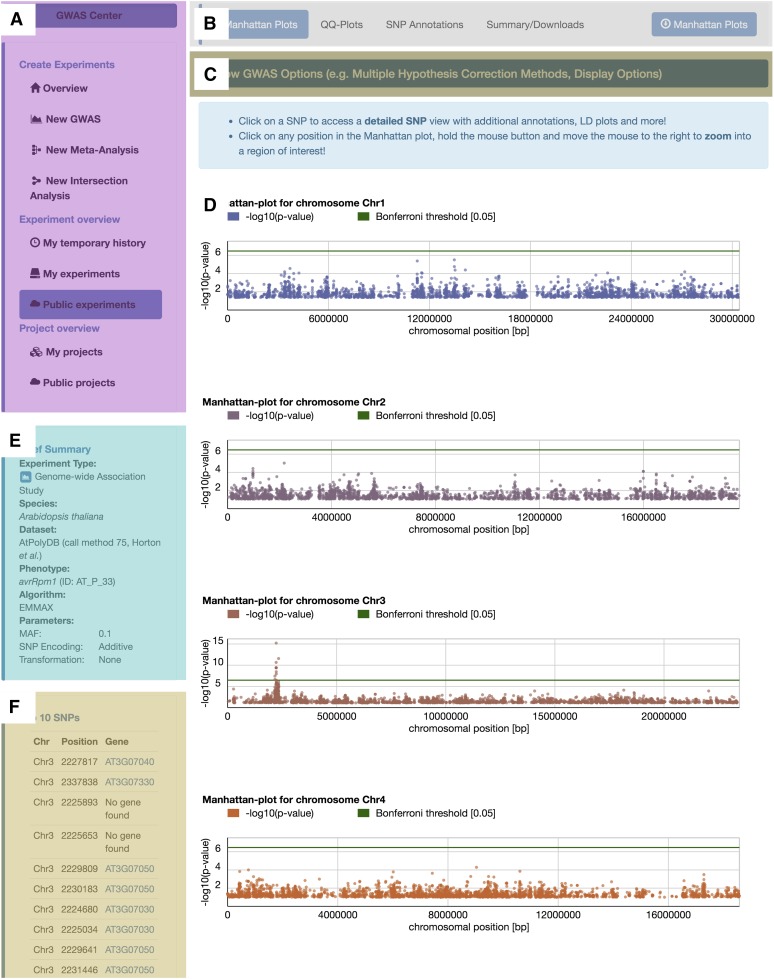
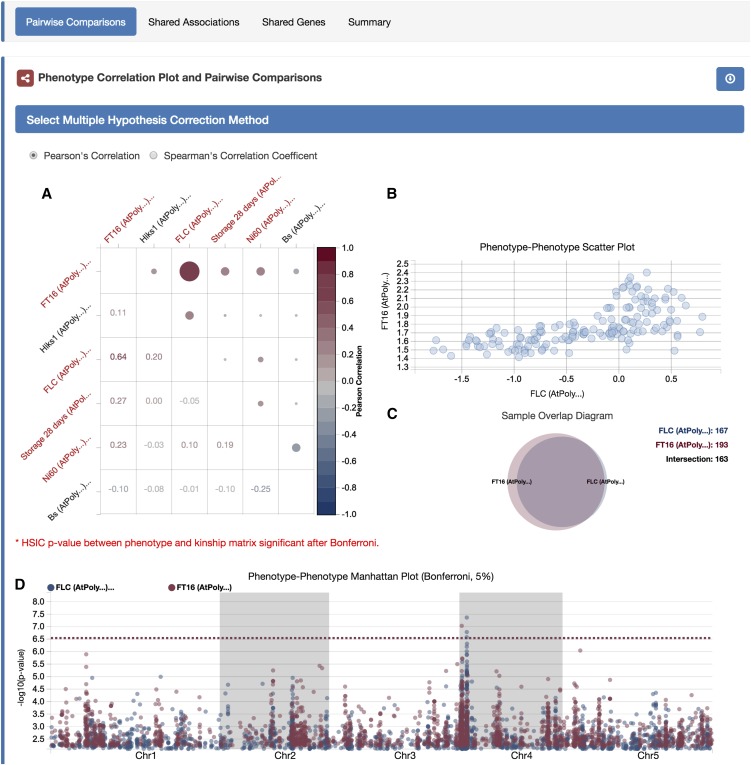
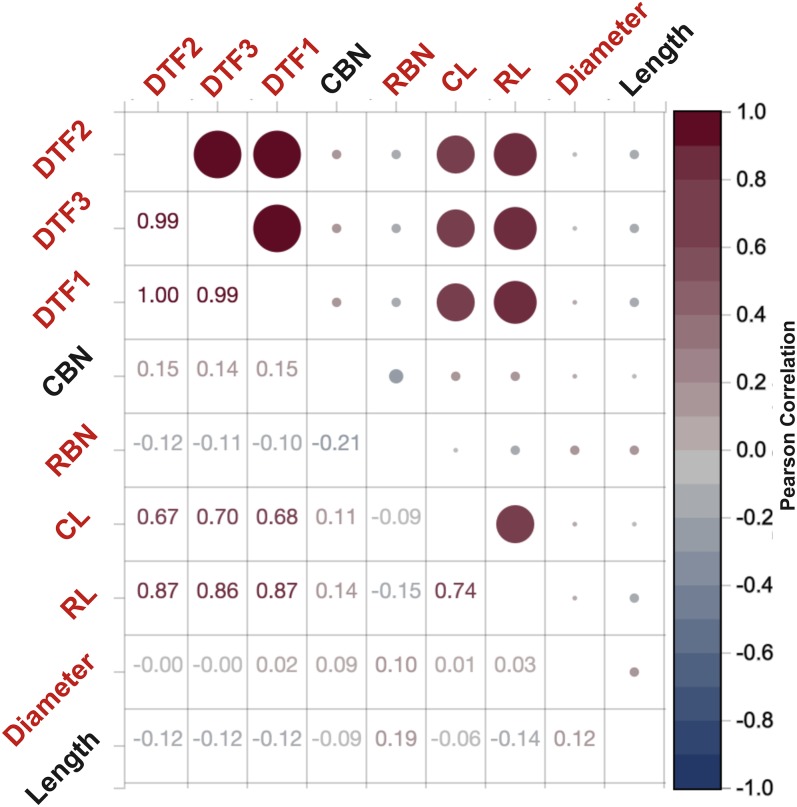
The ever-growing availability of high-quality genotypes for a multitude of species has enabled researchers to explore the underlying genetic architecture of complex phenotypes at an unprecedented level of detail using genome-wide association studies (GWAS). The systematic comparison of results obtained from GWAS of different traits opens up new possibilities, including the analysis of pleiotropic effects. Other advantages that result from the integration of multiple GWAS are the ability to replicate GWAS signals and to increase statistical power to detect such signals through meta-analyses. In order to facilitate the simple comparison of GWAS results, we present easyGWAS, a powerful, species-independent online resource for computing, storing, sharing, annotating, and comparing GWAS. The easyGWAS tool supports multiple species, the uploading of private genotype data and summary statistics of existing GWAS, as well as advanced methods for comparing GWAS results across different experiments and data sets in an interactive and user-friendly interface. easyGWAS is also a public data repository for GWAS data and summary statistics and already includes published data and results from several major GWAS. We demonstrate the potential of easyGWAS with a case study of the model organism Arabidopsis thaliana, using flowering and growth-related traits.


Figures

Figure 1.
Figure 1.
Illustration of the Functionalities of easyGWAS in Comparison with Other Current Online GWAS Tools. Squares illustrate supported functionalities, and ovals illustrate supported data types that can be uploaded to easyGWAS. White objects are supported by all available web servers, but hatched objects are only partially supported. Blue objects are only supported by easyGWAS.
Figure 2.
Figure 2.
Screenshot of the easyGWAS Result Layout. The screenshot shows the general layout of the easyGWAS result view. (A) The “GWAS Center” menu with links to different wizards and experiment tables, e.g., to create new GWAS, meta-analysis, or comparative intersection experiments. (B) A sub-menu for the GWAS results to navigate between Manhattan plots, QQ-plots, SNP annotations, or an experiment summary. (C) General options to dynamically adjust the multiple hypothesis testing method or various different plotting options. (D) The main results of a GWAS, meta-analysis, or intersection analysis. In this screenshot, Manhattan plots are shown. (E) and (F) A brief summary of the most important experimental parameters is shown (E). This can be either a summary of a regular GWAS experiment, a meta-analysis, or a comparison of several GWAS. If available, the top 10 associated hits of a GWAS are shown in (F).
Figure 3.
Figure 3.
Screenshot of the easyGWAS Detailed SNP View. The “Detailed SNP” view of a SNP gives more detailed information and annotation about the selected SNP and its close neighborhood, illustrated in this screenshot. (A) A donut diagram with the allele distribution of the selected SNP. (B) A box plot with the trait values for each allele is shown. (C) The distribution of genes and the LD pattern around the focal SNP. The panel at the bottom shows more detailed annotations for the focal SNP, e.g., if a SNP is a missense variant, frameshift, or stop codon.
Figure 4.
Figure 4.
Screenshot of the easyGWAS Pairwise Comparison View. The screenshot illustrates the general layout of the pairwise comparison view of different GWAS. (A) A phenotype-phenotype correlation plot is shown, while phenotype names highlighted in red are significantly associated with population structure. (B) Hovering over any correlation point in the plot will dynamically update the phenotype-phenotype scatterplot. The phenotype-phenotype scatter diagram plots the measurements of both phenotypes against each other. (C) A Venn diagram is shown to illustrate the sample overlap between the two phenotypes. (D) The Manhattan plots for both GWAS on top of each other.
Figure 5.
Figure 5.
Phenotype-Phenotype Correlation Plot for Case Study. Phenotype-phenotype correlation plot showing the pairwise Pearson’s correlation coefficients between all phenotypes for the case study in Arabidopsis. Five of the phenotypes are highly correlated to each other: flowering time as days until emergence of visible flowering buds in the center of the rosette from time of sowing (DTF1); flowering time as days until the inflorescence stem elongated to 1 cm (DTF2); flowering time as days until first open flower (DTF3); rosette leaf number (RL); and cauline leaf number (CL). Phenotypes highlighted in red are significantly associated with population structure.
Figure 6.
Figure 6.
Linkage Disequilibrium Plot for SNP Chr1:24338990 for Phenotype RL. Three SNPs for the phenotype RL are significantly associated using Storey and Tibshirani’s correction for multiple hypothesis testing. These hits are in close proximity to the FT gene.

References

    1. 1001 Genomes Consortium (2016). 1,135 Genomes reveal the global pattern of polymorphism in Arabidopsis thaliana. Cell 166: 481–491. - PMC - PubMed
    1. Abdi H. (2007). The Bonferonni and Šidák corrections for multiple comparisons. Encycl. Meas. Stat. 3: 103–107.
    1. Aho K., Derryberry D., Peterson T. (2014). Model selection for ecologists: the worldviews of AIC and BIC. Ecology 95: 631–636. - PubMed
    1. Andreassen O.A., et al. ;. International Consortium for Blood Pressure GWAS; Diabetes Genetics Replication and Meta-analysis Consortium; Psychiatric Genomics Consortium Schizophrenia Working Group (2013). Improved detection of common variants associated with schizophrenia by leveraging pleiotropy with cardiovascular-disease risk factors. Am. J. Hum. Genet. 92: 197–209. - PMC - PubMed
    1. Ariel F., Jegu T., Latrasse D., Romero-Barrios N., Christ A., Benhamed M., Crespi M. (2014). Noncoding transcription by alternative RNA polymerases dynamically regulates an auxin-driven chromatin loop. Mol. Cell 55: 383–396. - PubMed

Publication types

LinkOut - more resources