. 2017 Jan 4;93(1):33-47.
doi: 10.1016/j.neuron.2016.11.045. Epub 2016 Dec 15.

AAV-Mediated Anterograde Transsynaptic Tagging: Mapping Corticocollicular Input-Defined Neural Pathways for Defense Behaviors

Affiliations

AAV-Mediated Anterograde Transsynaptic Tagging: Mapping Corticocollicular Input-Defined Neural Pathways for Defense Behaviors

Brian Zingg et al. Neuron. .

Abstract

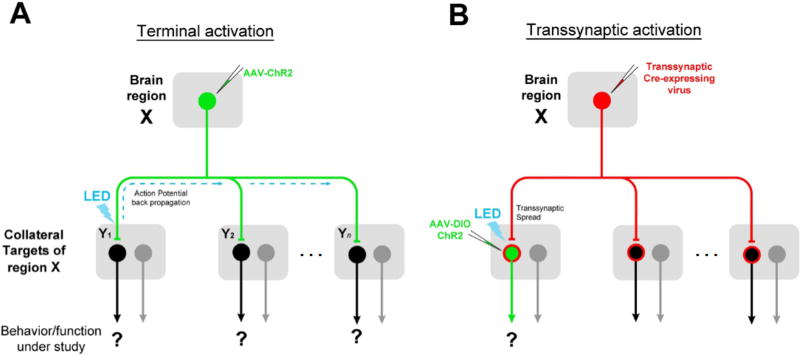
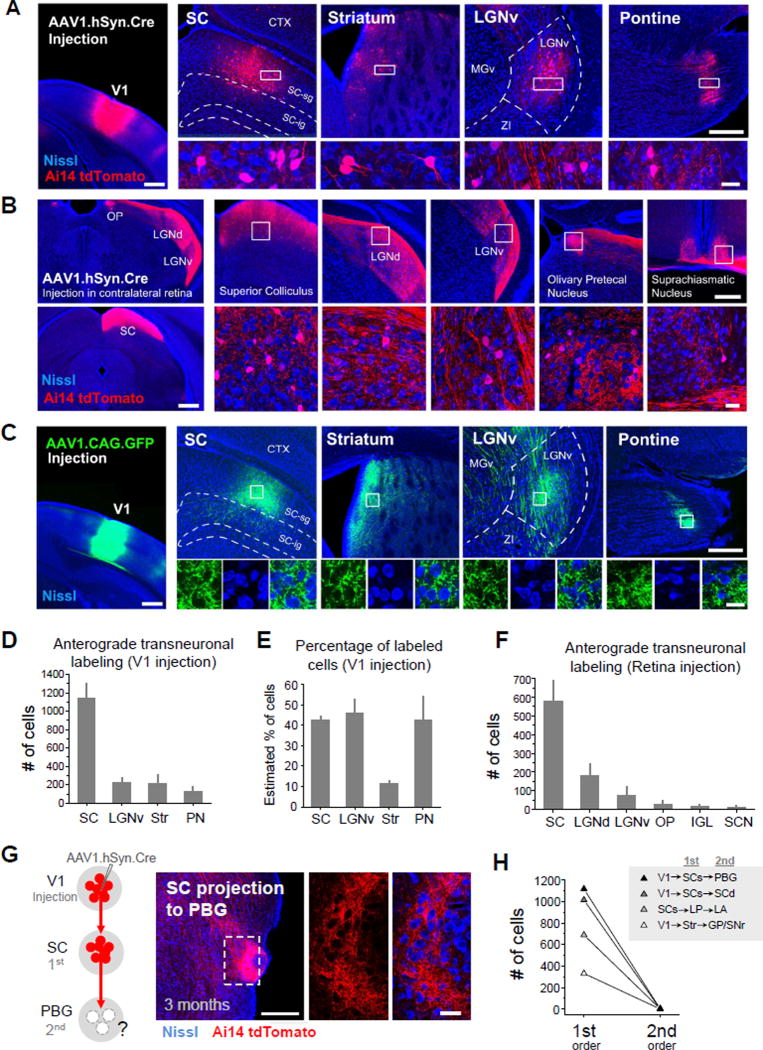
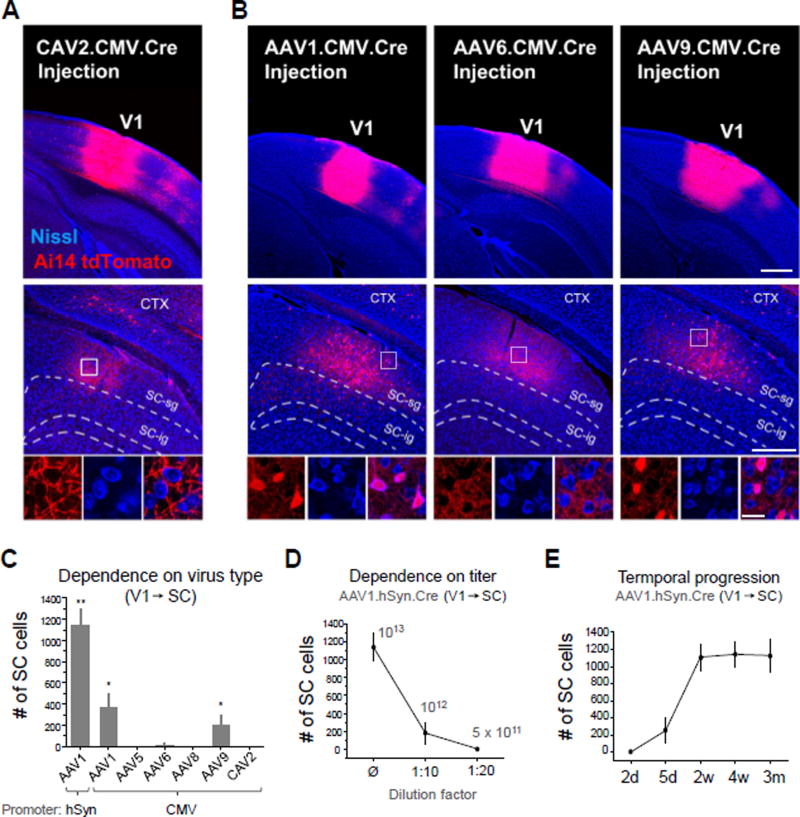
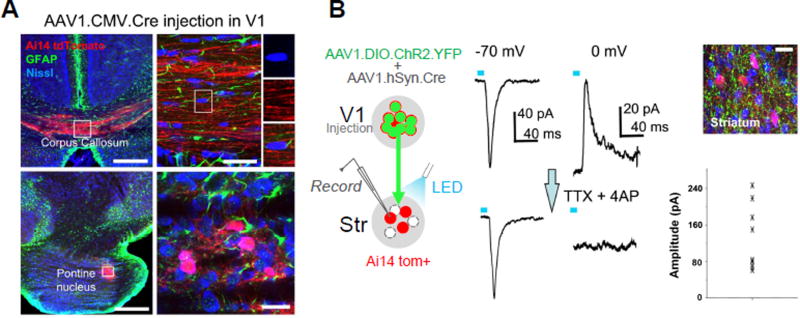
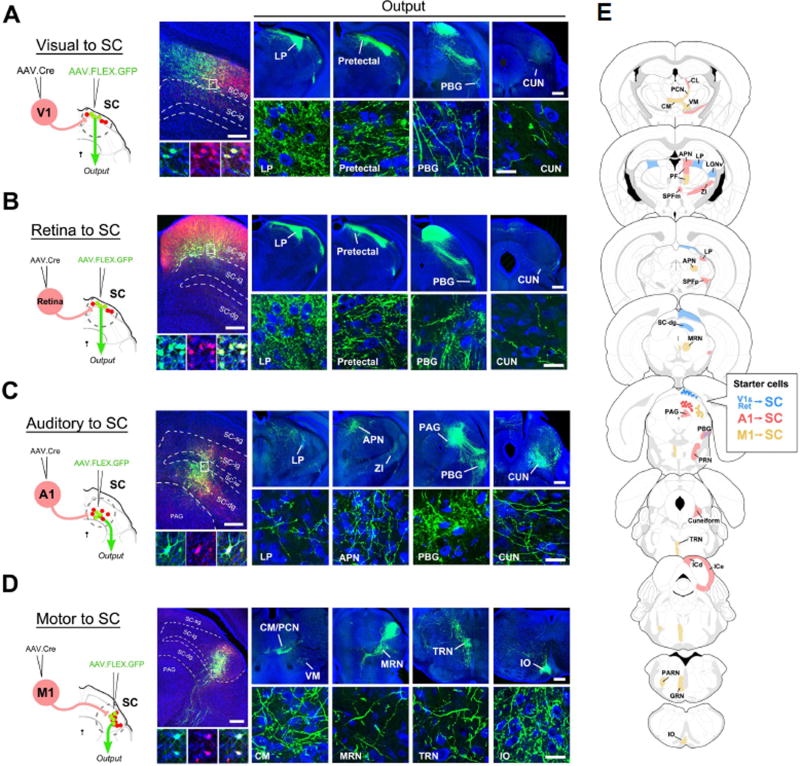
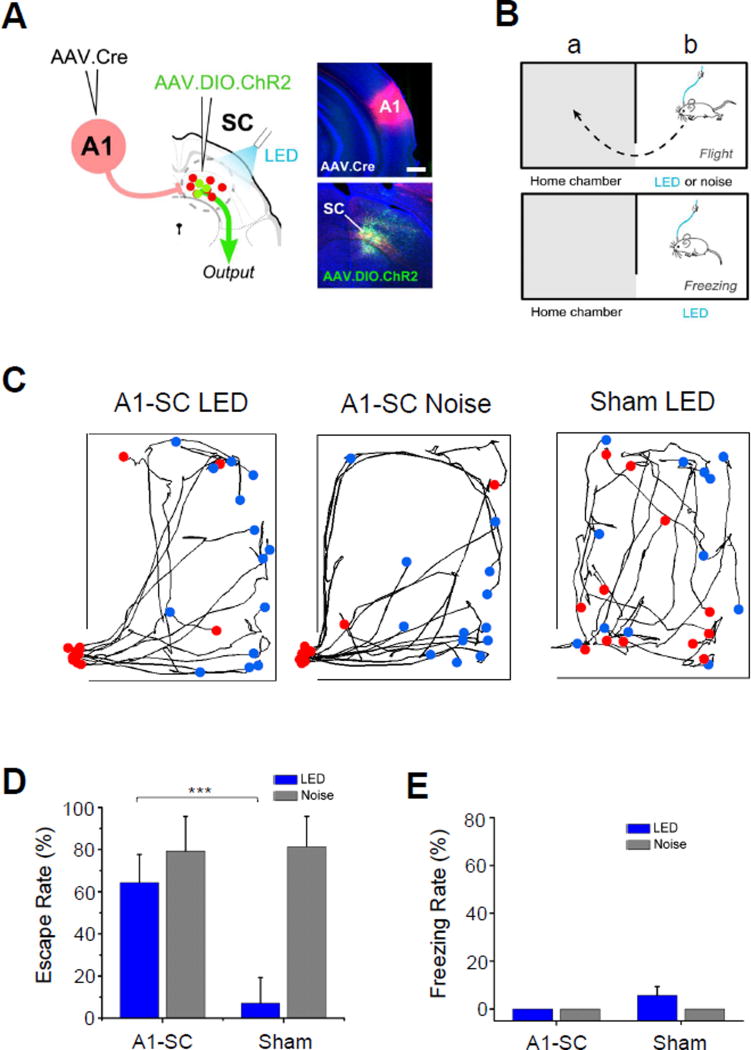
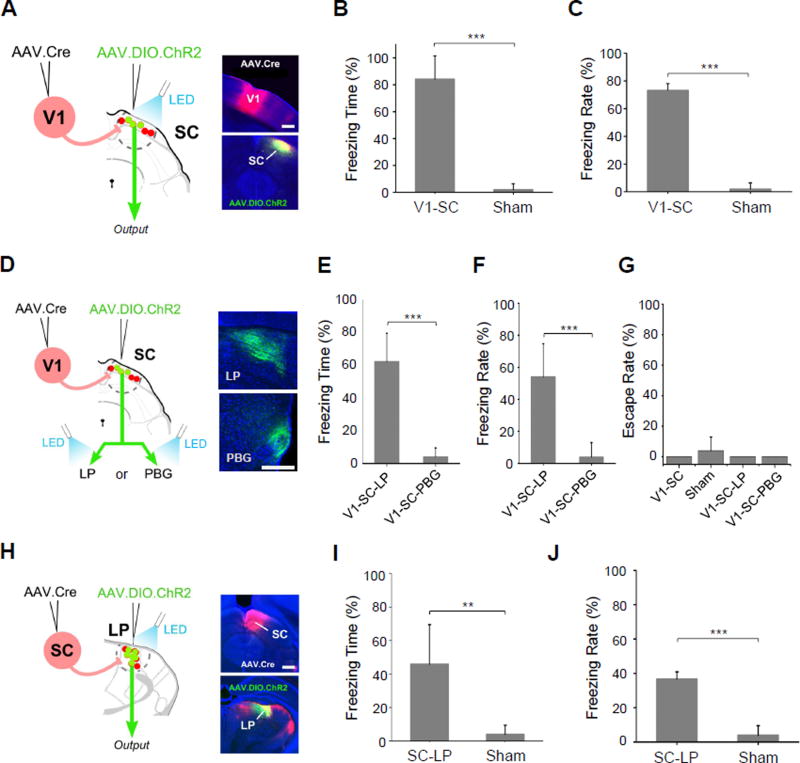
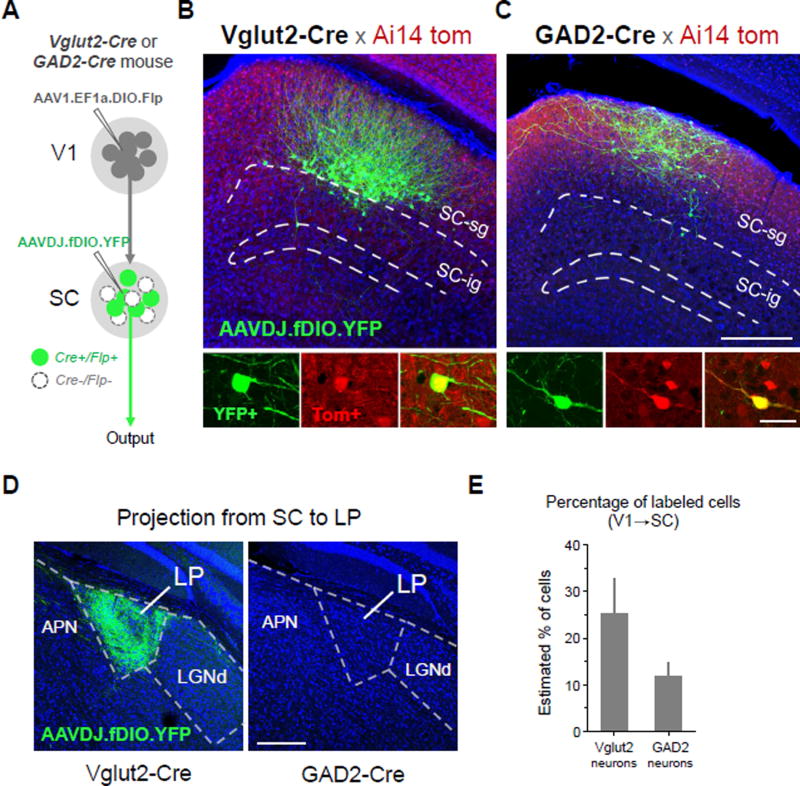
To decipher neural circuits underlying brain functions, viral tracers are widely applied to map input and output connectivity of neuronal populations. Despite the successful application of retrograde transsynaptic viruses for identifying presynaptic neurons of transduced neurons, analogous anterograde transsynaptic tools for tagging postsynaptically targeted neurons remain under development. Here, we discovered that adeno-associated viruses (AAV1 and AAV9) exhibit anterograde transsynaptic spread properties. AAV1-Cre from transduced presynaptic neurons effectively and specifically drives Cre-dependent transgene expression in selected postsynaptic neuronal targets, thus allowing axonal tracing and functional manipulations of the latter input-defined neuronal population. Its application in superior colliculus (SC) reveals that SC neuron subpopulations receiving corticocollicular projections from auditory and visual cortex specifically drive flight and freezing, two different types of defense behavior, respectively. Together with an intersectional approach, AAV-mediated anterograde transsynaptic tagging can categorize neurons by their inputs and molecular identity, and allow forward screening of distinct functional neural pathways embedded in complex brain circuits.

Keywords: AAV serotypes; Cre and Flp system; corticofugal projection; defensive behavior; flight and freezing; intersectional strategy; mapping neural circuits; superior colliculus; transsynaptic/transneuronal tracer.


Figures

Figure 1
Figure 1. Advantages of anterograde transsynaptic mapping of functional circuits
(A) A brain region “X” is known to mediate a behavior/function of interest. Neurons in X project to multiple target nuclei (“Y”). To map the relevant downstream circuit, conventional method relies on activation of ChR2-expressing X axon terminals in a given target nucleus. This may result in unwanted activation of collateral targets via antidromic stimulation (marked by dash lines). (B) A virus capable of anterograde transsynaptic spread would allow direct activation of postsynaptic cells in a target region that specifically receive input from region X, by enabling Cre-dependent transgene expression (green) in a Y nucleus.
Figure 2
Figure 2. Anterograde transneuronal transport of AAV1-Cre
(A) Left, tdTomato (red) expression in the injection site following injection of AAV1-hSyn-Cre into V1 of an Ai14 reporter mouse. Blue is Nissl staining. Right four panels, tdTomato fluorescence in regions downstream of V1 (SC, striatum, LGNv, pontine nucleus). High-magnification images (bottom) show tdTomato-labeled cell bodies in the region indicated by the white box. Scale bars: 500 µm, left panel; 250 µm, right top panels; 25 µm, right bottom panels. The same scales apply to (B) and (C) below correspondingly. (B) Anterograde transneuronal labeling in the SC, LGNd, LGNv, olivary pretectal nucleus (OP), and suprachiasmatic nucleus (SCN) following injection of AAV1-hSyn-Cre into the contralateral retina. High-magnification images (bottom panels) show tdTomato-labeled cell bodies in boxed regions. (C) Similar experiment as in (A) except that AAV1-CAG-GFP was injected. Note that no GFP-labeled cell bodies were found in regions downstream of V1 (4 week post-injection survival time). (D) Quantification of total number of tdTomato-labeled cells in selected structures downstream of V1 following injection of AAV1-hSyn-Cre (4 week post-injection survival time, n = 4 mice, Error bar = SD). (E) Estimated percentage of tdTomato-labeled cells as compared with the total number of cells within a defined local region in each downstream structure (D) that includes the majority of transneuronally labeled neurons (see Figure S2 and Experimental Procedures). N = 4. Error bar = SD. (F) Quantification of total number of labeled cells found in structures downstream of the contralateral retina following injection of AAV1-hSyn-Cre (4 week post-injection survival, n = 4 mice, Error bar = SD). (G) Left, injection of AAV1-hSyn-Cre in V1 of Ai14 reporter mice labels neurons in SC (1st order connection), which in turn project strongly to PBG (2nd order connection). Middle and right, dense tdTomato+ axons (red) were observed in PBG, but no tdTomato+ cell bodies (right panels) after 3 month post-injection survival time. Scale bar: 250 µm, middle panel; 25 µm, right panels. (H) Quantification of number of labeled cells in the first and second order downstream regions in four different mice. No second order spread was observed after 3 month post-injection survival time. Abbreviations: GP, globus pallidus; LA, lateral amygdala; LP, lateral posterior nucleus of thalamus; PBG, parabigeminal nucleus; SCs, superior colliculus, superficial layer; SCd, superior colliculus, deep layer; SNr, substantia nigra reticulate.
Figure 3
Figure 3. Serotype specificity of transneuronal transport
(A) CAV2-CMV-Cre injection in V1 (upper panel). No anterograde transneuronal labeling was observed in regions downstream of V1 such as the SC (middle and bottom panels). High-magnification images (bottom) of the boxed region are shown (4 week post-injection survival). (B) Comparison of AAV1, AAV6, and AAV9. Injection into V1 resulted in robust anterograde transneuronal labeling in SC with AAV1 (left) and AAV9 (right), but not AAV6 (middle) (4 week post-injection survival, 60 nl injection each). Scale bars: 500 µm, top panels; 250 µm, middle panels; 25 µm, bottom panels. The same scales also apply to (A) correspondingly. (C) Quantification of total number of cells labeled in SC for different Cre-expressing viruses injected into V1 of Ai14 mice (4 week post-injection survival, 60 nl injection, n = 4 mice each). Error bar = SD. **, p < 0.01, different from all other groups; *, p < 0.05, different from AAV5, AAV6, AAV8 and CAV2 groups (one-way ANOVA and post hoc test). (D) Dependence of transneuronal labeling on viral concentration. Number of labeled cells in SC following injection of undiluted AAV1-hSyn-Cre in V1, 1:10 dilution, or 1:20 dilution (4 week post-injection survival, 60 nl injection, n = 4 each). Error bar = SD. (E) Quantification of transneuronal labeling in SC following different post-injection survival times: 2 days, 5 days, 2 weeks, 4 weeks, and 3 months (60 nl injections of AAV1-hSyn-Cre in V1, n = 4 each). Error bar = SD.
Figure 4
Figure 4. Synaptic specificity of anterograde viral spread
(A) TdTomato expression (red) and GFAP labeling (green) in the corpus callosum (upper) and pontine nucleus (lower) following injection of AAV1-CMV-Cre into V1 of an Ai14 mouse. High-magnification images (right panels) show that Nissl stained cell bodies (blue) within the corpus callosum were negative for tdTomato (upper), and that tdTomato-positive cell bodies within PN were negative for GFAP staining (lower). Scale bars: 250 µm, left panels; 25 µm, right panels. (B) Slice recording from transneuronally labeled neurons in the striatum (red) following co-injection of AAV1-hSyn-Cre and AAV1-EF1a-DIO-ChR2-YFP into V1 (left panel). Top right image shows ChR2-expressing axons (green) surrounding tdTomato-labeled striatal neurons. Scale: 25 µm. Middle panel, average LED-evoked excitatory (−70 mV) and inhibitory (0 mV) currents in an example tdTomato+ striatal neuron before and after perfusing in TTX and 4AP. LED stimulation is marked by a blue bar. Right bottom, a summary of amplitudes of average monosynaptic excitatory currents evoked by LED in 9 recorded striatal cells.
Figure 5
Figure 5. Mapping of axonal outputs of input-defined neuronal populations in SC
(A) Left, AAV1-hSyn-Cre was injected into V1 of Ai14 mice, followed by a second injection of AAV1-CAG-FLEX-GFP into SC. Middle, GFP-labeled neurons in SC-sg were also tdTomato+. Right four panels, GFP-labeled axons in various regions (LP, pretectal area, PBG, cuneiform nucleus (CUN)) downstream of SC. High-magnification images (bottom) reveal ramified axons and their terminal and bouton structures. Blue, Nissl staining. Scale bars: 250 µm, middle top panel; 500 µm, right top panels; 25 µm, bottom panels. The scales also apply to (B), (C), (D) correspondingly. (B) Axonal outputs of SC-sg neurons that receive input from the contralateral retina. Data are displayed in a similar way as in (A). (C) Axonal outputs of SC neurons that receive input from A1, which are located mainly in SC-dg and sparsely in SC-ig. (D) Axonal outputs of SC neurons that receive input from M1, which are located mainly in the lateral aspect of SC-ig. (E) Summary of observed target regions for SC neuron subpopulations receiving input from V1/retina (blue), from A1 (red), and from M1 (yellow) respectively. Abbreviations: CL, central lateral nucleus of thalamus; PCN, paracentral nucleus; VM, ventral medial nucleus of thalamus; CM, central medial nucleus of thalamus; APN, anterior pretectal nucleus; PF, parafascicular nucleus; SPFm and SPFp, subparafascicular nucleus, magnocellular and parvicellular; ZI, zona incerta; MRN, midbrain reticular nucleus; PRN, pontine reticular nucleus; TRN, tegmental reticular nucleus; ICd and ICe, inferior colliculus, dorsal and external; PARN, parvicellular reticular nucleus; GRN, gigantocellular reticular nucleus; IO inferior olivary complex.
Figure 6
Figure 6. A1-recipient SC neurons drive an innate escape behavior
(A) Schematic illustration of paired injections in A1 and SC, as well as LED illumination applied (A1-SC). Right panels, images of injection sites (red for tdTomato; green for ChR2) in an example animal. Scale bar: 500 µm. (B) Schematic illustration of two-chamber behavior setup for testing freezing or escape. (C) Movement tracking for an example A1-SC mouse under LED stimulation (left), A1-SC mouse under noise stimulation (middle) and sham mouse under LED stimulation (right) in the novel chamber during 5 s LED activation or 5 s noise stimulation. Each curve represents one trial. Blue dot indicates the starting location at the initiation of LED or noise stimulus, and red dot indicates the location at the end of the stimulus. Red dot beyond the novel chamber boundary indicates that the animal has returned to the adjacent home chamber within 5 sec (bottom left). For “sham”, AAV1-FLEX-GFP was injected in SC. (D) Summary of percentage of trials that induced escape behavior (n = 7 mice for A1-SC group, n = 5 mice for sham). Error bar = SD. ***, p < 0.001, t test. (E) Percentage of trials that induced freezing behavior. Error bar = SD.
Figure 7
Figure 7. V1-recipent SC neurons drive freezing behavior
(A) Paired injections labeling SC neurons receiving V1 input. LED illumination was applied to cell bodies in SC (V1-SC). Scale bar: 500 µm. (B) Percentage of time spent freezing within the time window of LED illumination (n = 5 mice for each group). Error bar = SD. ***, p < 0.001, t test. (C) Percentage of trials that induced freezing. ***, p < 0.001, t test. (D) LED illumination was applied to ChR2+ SC axon terminals in either LP (V1-SC-LP) or PBG (V1-SC-PBG). Right, images showing ChR2 labeled SC axons in LP or PBG. Scale bar: 250 µm. (E) Percentage of time spent freezing within the time window of LED illumination (n = 5 mice for each group). ***, p < 0.001, t test. (F) Percentage of trials that induced freezing. ***, p < 0.001, t test. (G) Percentage of trials that induced escape behavior. (H) Paired injections labeling LP neurons that receive input from SC. LED illumination was applied to LP (SC-LP). Right panel, images showing injection sites in SC and LP. Scale bar: 500 µm. (I) Percentage of time spent freezing within the time window of LED illumination (n = 6 mice for SC-LP, n = 5 mice for sham). Error bar = SD. **, p < 0.05, t test. (J) Percentage of trials that induced freezing behavior. Error bar = SD. ***, p < 0.001, t test.
Figure 8
Figure 8. Cell-type specific anterograde transneuronal labeling
(A) Strategy for labeling glutamatergic (Vglut2-Cre+) or GABAergic (GAD2-Cre+) subpopulations of SC neurons that receive input from V1. (B) Selective labeling of V1-recipient glutamatergic neurons in superficial layers of SC. Anterograde transneuronal transport of AAV1-EF1a-DIO-Flp enables Cre-dependent expression of Flp in glutamateric neurons (Ai14 tdTomato+) receiving input from V1. A second injection of AAVDJ-fDIO-YFP into SC enables Flp-dependent expression of YFP specifically in V1-recipient glutamatergic neurons (green), filling soma, dendrites, and axons. YFP+ neurons co-localize with Ai14 tdTomato expression in Vglut2-Cre+ neurons (bottom panels, enhanced with anti-RFP immunostaining). (C) Selective labeling of V1-recipient GABAergic neurons using same strategy as in (B) but with injections in a GAD2-Cre mouse. Scale: 250 µm, top panel; 25 µm bottom panel. The scales also apply to (B) correspondingly. (D) Long range axonal projection to LP from glutamatergic, but not GABAergic, V1-recipient SC neurons. Scale: 250 µm. (E) Percentage of YFP+/Tomato+ cells out of total Tomato+ cells quantified for local regions expressing YFP in Vglut2-Cre and GAD2-Cre mice (4 week post-injection survival, 60 nl injections, n = 4 each). Error bar = SD.

Comment in

References

    1. Aboitiz F, Montiel J. One hundred million years of interhemispheric communication: The history of the corpus callosum. Brazilian J. Med. Biol. Res. 2003;36:409–420. - PubMed
    1. Aschauer DF, Kreuz S, Rumpel S. Analysis of transduction efficiency, tropism and axonal transport of AAV serotypes 1, 2, 5, 6, 8 and 9 in the mouse brain. PLoS One. 2013;8:e76310. - PMC - PubMed
    1. Beier KT, Saunders A. Anterograde or retrograde transsynaptic labeling of CNS neurons with vesicular stomatitis virus vectors. Proc. Natl. Acad. Sci. USA. 2011;108:15414–15419. - PMC - PubMed
    1. Callaway XEM, Luo L. Monosynaptic Circuit Tracing with Glycoprotein-Deleted Rabies Viruses. J. Neurosci. 2015;35:8979–8985. - PMC - PubMed
    1. Castle MJ, Gershenson ZT, Giles AR, Holzbaur ELF, Wolfe JH. Adeno-associated virus serotypes 1, 8, and 9 share conserved mechanisms for anterograde and retrograde axonal transport. Hum. Gene Ther. 2014;25:705–720. - PMC - PubMed

Publication types

MeSH terms