. 2017 Jan 4;93(1):194-210.
doi: 10.1016/j.neuron.2016.11.026. Epub 2016 Dec 15.

Bidirectional Control of Generalized Epilepsy Networks via Rapid Real-Time Switching of Firing Mode

Affiliations

Bidirectional Control of Generalized Epilepsy Networks via Rapid Real-Time Switching of Firing Mode

Jordan M Sorokin et al. Neuron. .

Abstract

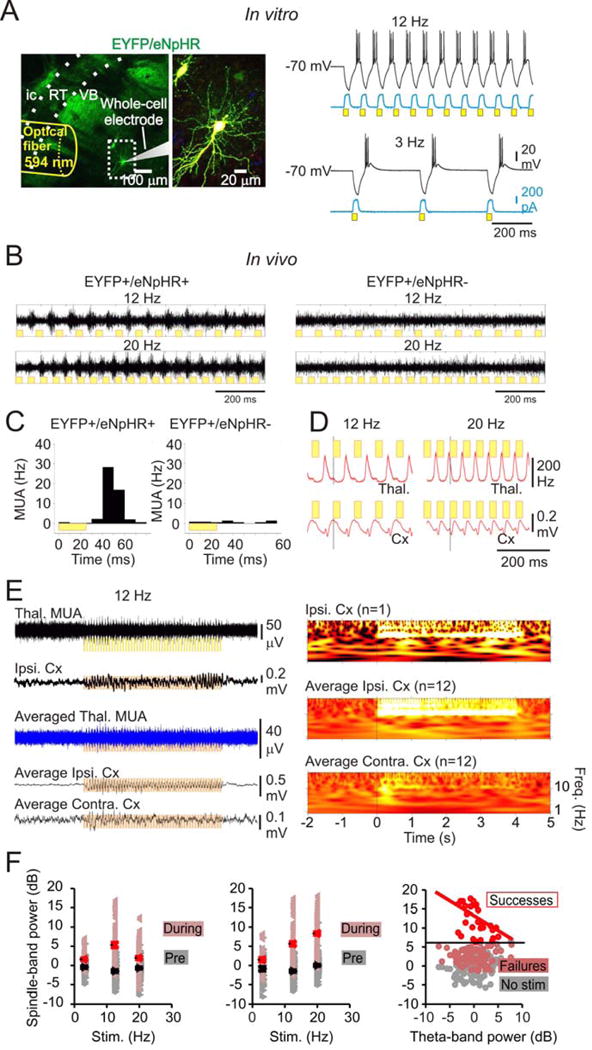
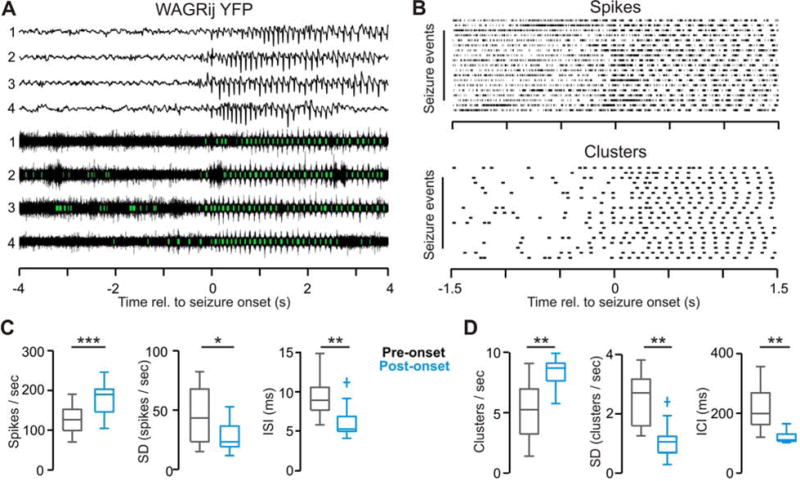
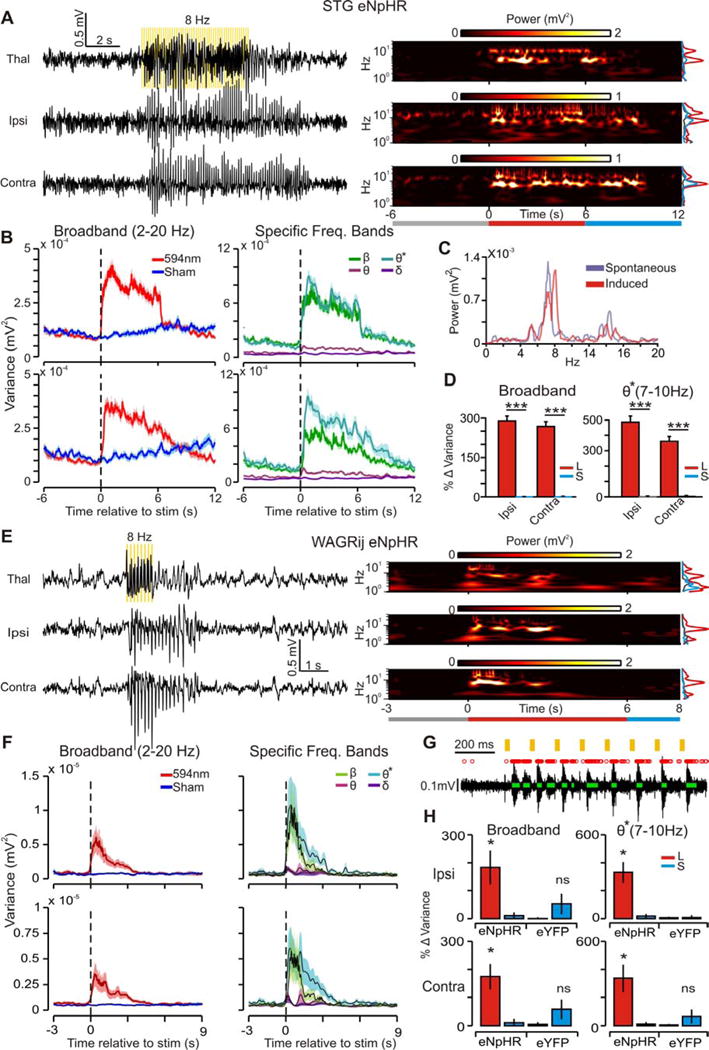
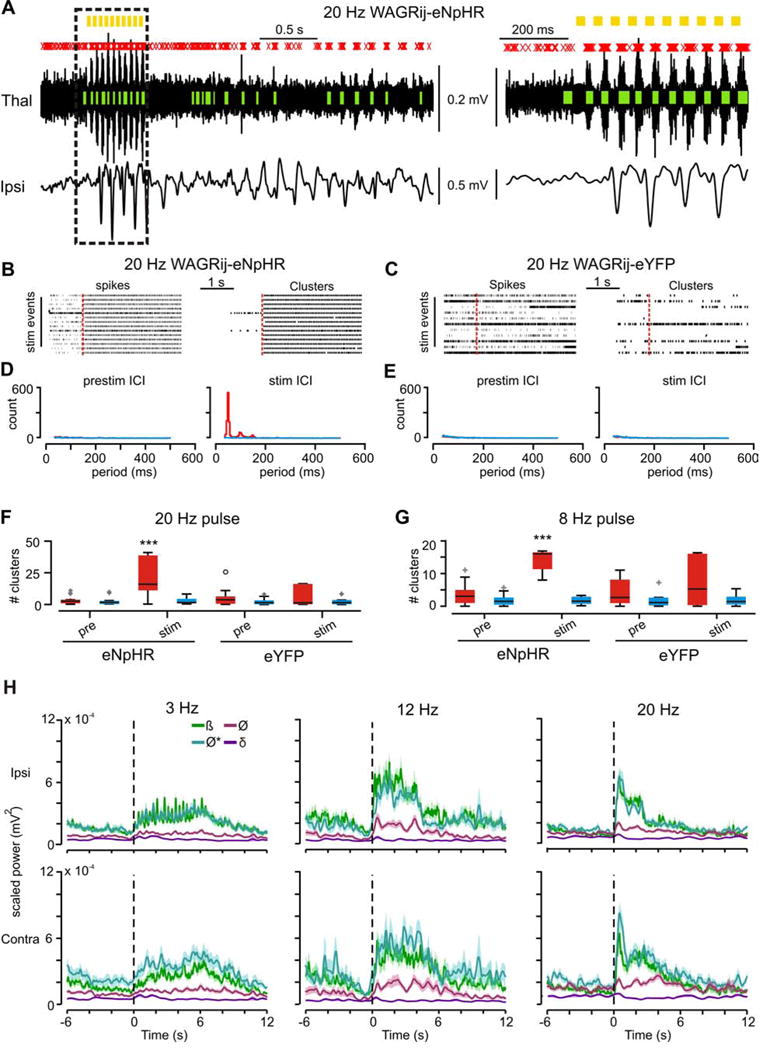
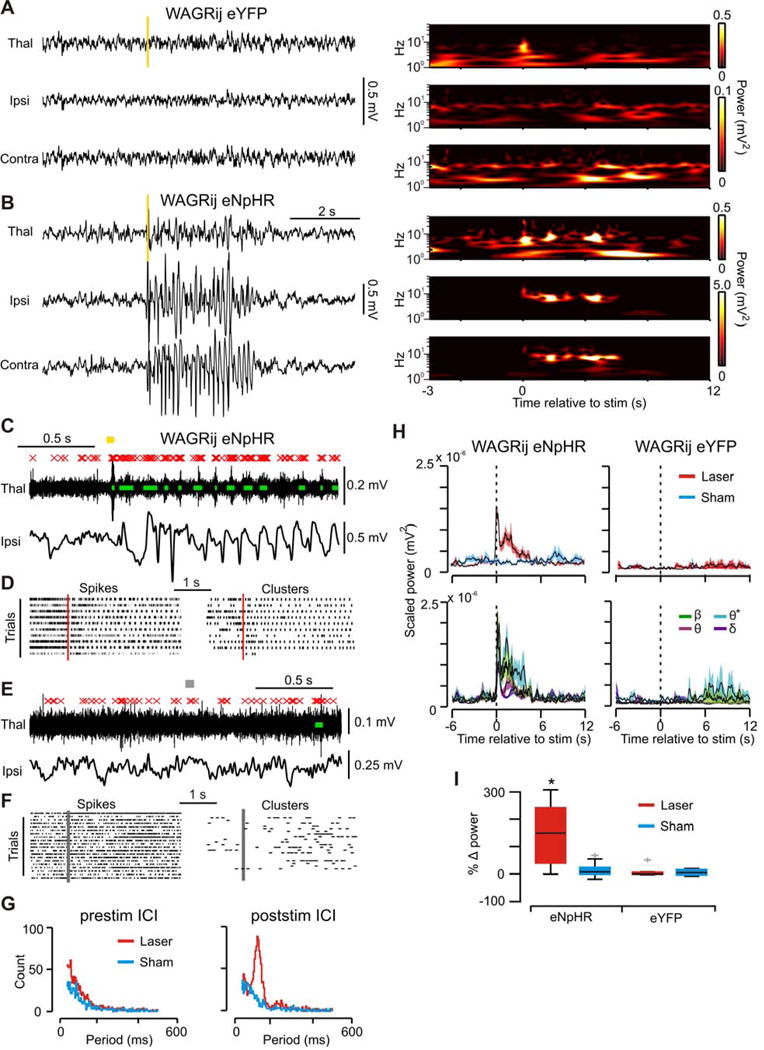
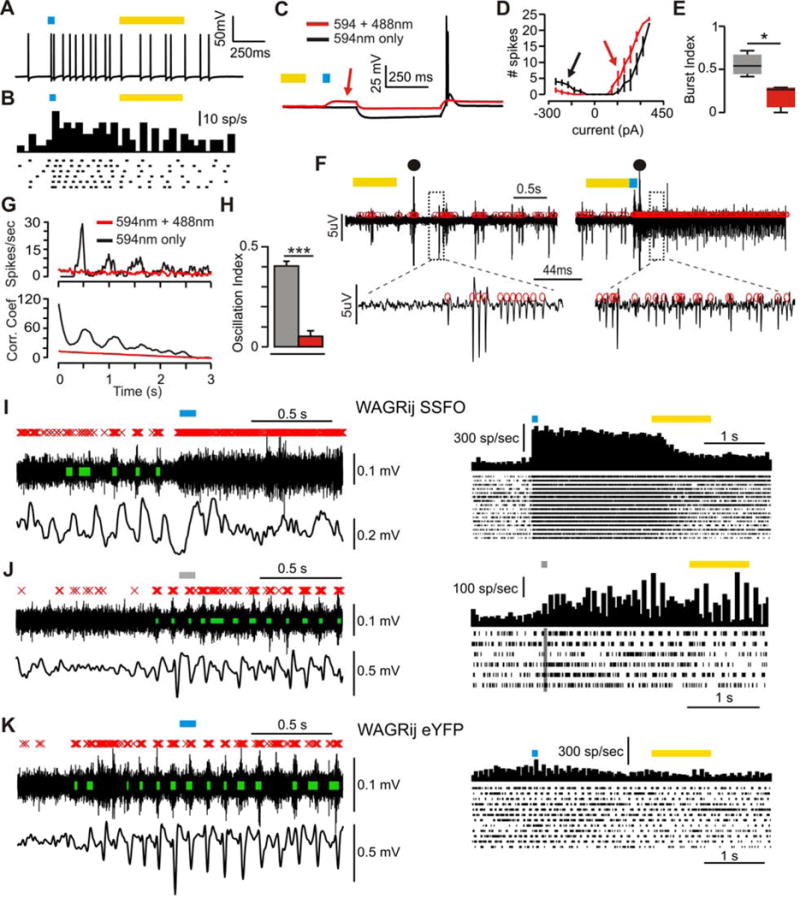
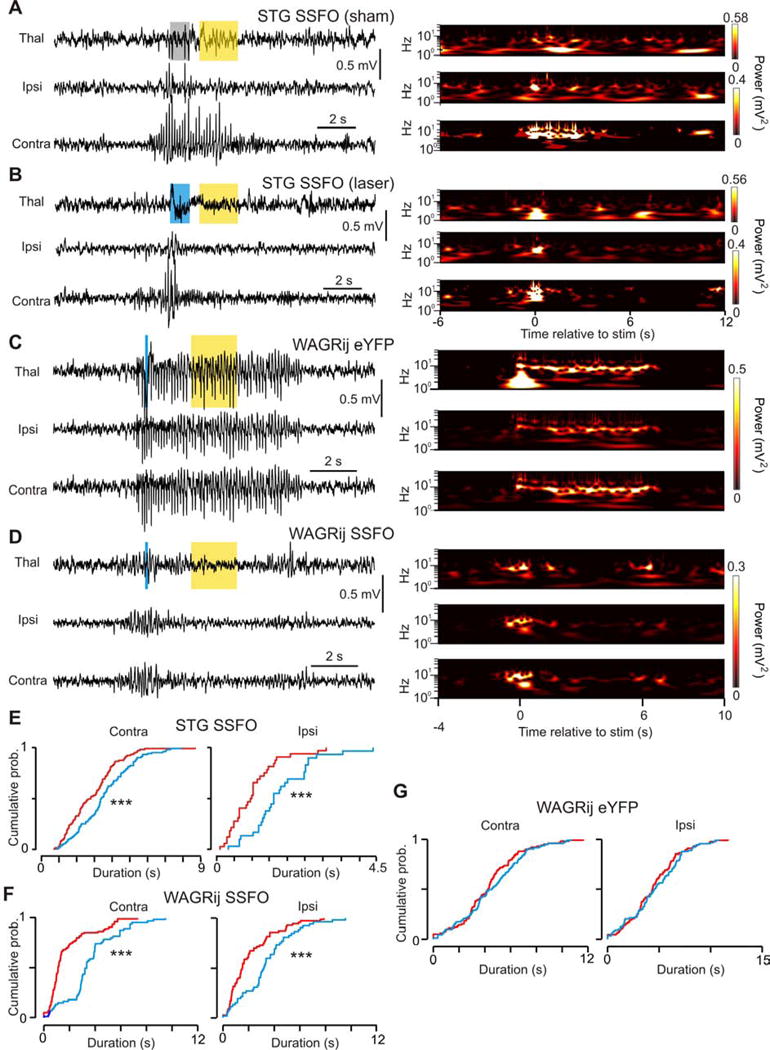
Thalamic relay neurons have well-characterized dual firing modes: bursting and tonic spiking. Studies in brain slices have led to a model in which rhythmic synchronized spiking (phasic firing) in a population of relay neurons leads to hyper-synchronous oscillatory cortico-thalamo-cortical rhythms that result in absence seizures. This model suggests that blocking thalamocortical phasic firing would treat absence seizures. However, recent in vivo studies in anesthetized animals have questioned this simple model. Here we resolve this issue by developing a real-time, mode-switching approach to drive thalamocortical neurons into or out of a phasic firing mode in two freely behaving genetic rodent models of absence epilepsy. Toggling between phasic and tonic firing in thalamocortical neurons launched and aborted absence seizures, respectively. Thus, a synchronous thalamocortical phasic firing state is required for absence seizures, and switching to tonic firing rapidly halts absences. This approach should be useful for modulating other networks that have mode-dependent behaviors.

Keywords: SSFO; bursts; closed-loop; electrophysiology; epilepsy; optogenetics; oscillations; thalamocortical.


Figures

Figure 1
Figure 1. 12 Hz train of 594nm light drives sleep-like spindles in normal rats
(a) In vitro 594nm trains induced eNpHR currents (blue) and rhythmic hyperpolarizations (black) followed by PIR bursts in TC neurons (right) expressing eNpHR-EYFP (left, image of recorded slice showing eYFP fluorescence in VB). (b) in vivo 12 Hz 594nm trains delivered via optrodes induced synchronized oscillatory TC firing in animals expressing EYFP-eNpHR (left) but not in controls (right). (c) Quantification of multi-unit activity (MUA) following the light pulse in eNpHR+ and eNpHR- TC neurons in vivo. (d) Superimposed average thalamic MUA rate and averaged cortical ECoG during 594nm pulses. (e) Representative single and average traces (left) and spectrograms (right) showing in vivo 594nm-induced TC clusters drive 12 Hz cortical oscillations. (f) 594nm trains fail to produce cortical oscillations during theta rhythm. Left: Ipsilateral cortical spindle power (dark red triangles) induced by thalamic optical stimulation. Bright red triangles: mean + SE. Grey: pre-stim cortical spindle power. Black triangles: mean + SE. Middle: Contralateral cortical spindle power (dark red triangles) induced by thalamic optical stimulation. Right: 12 Hz light train is more likely to evoke strong cortical spindles (bright red circles) in the absence of cortical theta activity. After eliminating stimuli not inducing spindle power > 2 S.D above the mean power (dark red circles), the evoked spindle power and cortical theta power are negatively correlated (bright red line). Grey: power in the spindle band immediately prior to the stimulus. S.D. ~3dB. Pearson’s R2 = 0.22 for the linear fit. p = 0.008, 10 trials, 3 animals.
Figure 2
Figure 2. related to Fig. S5, Table S1: VB displays rhythmic, high firing-rate output throughout the duration of naturally occurring seizures
(a) Example ipsilateral ECoG (top) and thalamic multi-unit activity (bottom) with detected clusters (green) from four consecutive spontaneous seizures in a WAGRij-YFP rat. (b) Rasters of detected spikes (top) and spike clusters (bottom) from the same animals/trial as in (a). (c) The population spike rate (left), intra-trial s.d. of the spike rate (middle), and the inter-spike interval (right) averaged over 2-second windows prior to the seizure onset (gray) and following the seizure onset (blue) across all WAGRij-YFP animals. Note that the population spike rate actually increases during seizures, though becomes highly organized and phasic. (d) The cluster rate (left), intra-trial s.d. of the cluster rate (middle), and the inter-cluster interval (right) across all WAGRij-YFP animals. n = 13 trials, three animals; Wilcoxon Signed-Rank test; * p < 0.05, ** p < 0.01, *** p < 0.001
Figure 3
Figure 3. related to Fig. S1–3, Table S1: Rhythmic activation of eNpHR in TC drives SWD seizures in STG mice and WAGRij rats
(a) Left: example induced seizure from STG-eNpHR mouse with thalamic LFP (top), ipsilateral (middle), and contralateral (bottom) ECoG. Yellow bars indicate 8 Hz pulses of 594nm light, delivered to the right VB. Right: time-frequency wavelet decomposition of traces. Right Inset: Average prestim, stim, and postsim power (times indicated by the colored bars below). (b) Left: trial-averaged broadband (BB, 2–20 Hz) power (variance in this and all subsequent figures) over time for all laser (red) and sham (blue) trials. Right: trial-averaged power for laser-induced seizures, decomposed into different frequency bands (ß=10–20 Hz; Ø*=7–10 Hz; Ø=4–7 Hz; ∂=2–4 Hz). (c) Contralateral ECoG from spontaneous (purple) and induced (red) seizures; note the peak power at ~7 Hz and harmonics at ~15 Hz in both conditions. (d) Left: median BB power percent change + s.e.m.) from prestim → stim periods for induced (red) and sham (blue) trials across STG mice. Right: median Ø* power percent change. (107/195 laser/sham events, seven trials, three animals; p < 0.001, Wilcoxon-ranksum). (e–f) Same as a–b, but for 1s 8 Hz pulse in WAGRij-eNpHR. (g) Response of thalamic multi-unit (MU) activity in vivo to 594nm pulses. Red X’s = detected spikes, green bars = detected clusters (see online methods). Note that clusters time-lock to 594nm pulses. (h) Median % change in BB (left) and Ø* (right) power +.s.e.m) for WAGRij-eNpHR and WAGRij-eYFP from prestim → stim for ipsilateral (top) and contralateral (bottom) ECoG. Red = laser, blue = sham (p < 0.05, Wilcoxon-ranksum; eNpHR: seven trials, four animals; eYFP: four trials, four animals; see also Video S1).
Figure 4
Figure 4. related to Fig. S1–3, Table S1: In vivo clusters from eNpHR rodents follow various pulse-train frequencies, yet seizure-specific ECoG power is maximally elevated
(a) TC Multi-unit (MU) activity (top) and contralateral ECoG (bottom) from a WAGRij-eNpHR animal. MU spikes (red x’s) cluster into phasic bouts (green bars) that consistently follow the 20 Hz pulses (yellow bars). Right: expanded trace from the highlighted region. Note that ECoG spike-wave dischages rapidly converge to ~ 8 Hz despite the 20 Hz pulse frequency. (b) In vivo spike (left) and cluster (right) rasters from WAGRij-eNpHR before and during a 20 Hz train of 594nm light (red bar = 594nm onset). (c) Same as b, but for a WAGRij-eYFP control. (d) Prestim (left) and during-stim (right) inter-cluster interval (ICI) across all laser (red) and sham (blue) pulses for same animal as in b, showing that bursts organize around ~50 ms. (e) Same as d, but for WAGRij-eYFP, demonstrating lack of cluster organization during the stim. (f) Boxplots of the # of prestim (left) and stim (right) clusters during a 20 Hz pulse train across all recording trials for all animals, averaged on a per-trial basis for laser (red) and sham (blue) conditions. Only WAGRij-eNpHR show an elevated # of clusters during the laser stim period (p < .001, ANOVA, eNpHR: 10 trials, 4 animals; eYFP: 7 trials, 4 animals). (g) Same as f, but for 8 Hz (p < .001, ANOVA, eNpHR: 21 trials, four animals; eYFP: 11 trials, 5 animals). (h) Average power across different frequency bands (ß=10–20Hz; Ø*=7–10 Hz; Ø=4–7 Hz; ∂=2–4 Hz) separated by pulse-frequency (columns) for ipsilateral (top row) and contralateral (bottom row) ECoG. Note the preferential increase in Ø* and ß ECoG power regardless of the pulse frequency. Shaded error represents + s.e.m. (n=76/77, (3Hz), 107/195, (8Hz), 33/38, (12Hz), and 78/55 (20Hz) laser/sham events, from 5 trials (3Hz, 12Hz, 20Hz), or 7 trials (8Hz), 3 STG animals. See also Video S3).
Figure 5
Figure 5. related to Fig. S3, Table S1: Single 50ms 594nm pulse induces 8 Hz TC clusters and bilateral seizures
(a) Left: Thalamic LFP (top) and cortical ECoG (middle, bottom) from WAGRij-eYFP demonstrating no effect of 50ms 594nm pulse (yellow bar) on cortical ECoG. Right: wavelet transformations of traces. Notice the transient increase in power in the thalamic LFP due to the light artifact. (b) Same as a, but for WAGRij-eNpHR. The 50ms light pulse induces a seizure that almost instantly generalizes bilaterally. (c) In vivo thalamic MU activity during the same event as in b (red X’s = detected spikes, green bars = detected clusters, yellow bar = 594nm light). Bottom: ipsilateral ECoG from b. Note that ECoG spikes phase and time-lock to clusters. (d) Spike (left) and cluster (right) rasters of all 594nm events from same animal/trial as in b (red bar = 594nm onset). (e,f) Same as c,d, but for sham pulses. (g) Inter-cluster interval (ICI) histograms across all pulses/animals for laser/sham pulses 2 seconds before (left) or after (right) the pulse onset. Poststim ICI peaks at ~125ms, or 8 Hz. (h) Top: mean + s.e.m. BB power across laser/sham pulses for WAGRij-eNpHR (left) and WAGRij-eYFP (right). Bottom: mean + s.e.m. band-specific power across laser pulses. Note that Ø* power remains elevated longer compared to other bands. (i) Percent change in BB power from prestim → stim periods for all WAGRij-eNpHR and WAGRij-eYFP (red = laser, blue = sham). 594nm pulses produced a change in BB power, but only in eNpHR rats (p < .05, ANOVA; eNpHR: 15 trials, four animals; eYFP: 13 trials, four animals).
Figure 6
Figure 6. related to Fig. S4–5: SSFO activation in TC neurons increases tonic firing, reduces phasic clusters
(a) Example in vitro whole-cell patch recording from an SSFO-expressing TC neuron demonstrating increased firing rate with SSFO activation (blue bar). (b) Raster and PSTH of same experiment as a over many sweeps. (c) −150pA current pulse in SSFO-inactive (594nm light, black) or SSFO-active (594nm + 488nm light, red) sweeps. SSFO activation depolarizes the cell (red arrow) and abolishes the rebound burst. (d) Total # spikes vs. injected current for SSFOs and SSFOa sweeps. SSFO activation increases the rebound-spike threshold and reduces # of rebound spikes (black arrow), but inversely affects tonic spiking (red arrow). (e) Burst index (BI) for SSFOs and SSFOa cells (p < .05, Wilcoxon-ranksum, n = 3 cells). (f) Extracellular multi-unit activity (red circles = spikes) from thalamic slice showing oscillatory multi-unit clusters following electrical stimulation (●) without SSFO activation (left), and non-oscillatory, desynchronized multi-unit tonic firing with SSFO activation (right). (g) Top: average PSTHs of extracellular multi-unit activity across SSFO active and inactive sweeps. Bottom: autocorrelations of the PSTHs. (h) Average oscillatory index (OI), for each condition (p < .001, T-test, n = 17 slices). (i) Left: in vivo thalamic multi-unit activity (top; red X’s = spikes, green bars = clusters), and cortical ECoG (bottom) during a closed-loop experiment in WAGRij-SSFO. Clusters and ECoG oscillations at the seizure start are abolished with SSFO activation. Right: PSTH and raster of spikes across all detected seizures with laser activation from same trial. (j) Same as i, but for sham pulses. (k) Same as i, but for WAGRij-eYFP control.
Figure 7
Figure 7. related to Fig. S4–5, Table S2: SSFO activation in TC cells aborts automatically detected SWD seizures in STG and WAGRij
(a) Left: example seizure from an SSFO-expressing STG mouse showing thalamic LFP (top), ipsilateral (middle) and contralateral (bottom) ECoG. Gray/yellow bars: sham/594nm light. Right: wavelet transformations of the channels. (b) Same as a, but with a 488nm pulse that interrupts the seizure. Blue/yellow bars: 488nm/594nm light. Right: wavelet transformations; note the silence following the blue pulse. (c) Detected seizure from WAGRij-eYFP control + 488nm/594nm light. Blue light has no effect on the seizure. Note the light artifact in the thalamic wavelet power. (d) Detected seizure from WAGRij SSFO + 488nm/594nm light. Like b, the wavelet power is abolished following blue light. (e) Contralateral (left) and ipsilateral (right) empirical cumulative distributions of ECoG total seizure durations across all laser (red) and sham (blue) pulses for STG-SSFO. Laser seizure durations for ipsi- and contralateral cortices were significantly shortened (p < 0.001, Kolmogorov-Smirnov test; 110/112 laser/sham seizures, four trials, four animals). (f–g) Same as e, but for WAGRij-SSFO (f, p < 0.001, 155/111 laser/sham seizures, 10 trials, three animals) and WAGRij-eYFP (g, ns, 96/98 laser/sham seizures, 13 trials, three animals. See also Vid. S4–5).

Similar articles

Cited by

References

    1. Adams NC. Complexities in the thalamocortical and corticothalamic pathways. European Journal of Neuroscience. 1997;9(2):204–209. - PubMed
    1. Anikeeva P, et al. Optetrode: a multichannel readout for optogenetic control in freely moving mice. Nature Neuroscience. 2011;15(1):163–170. - PMC - PubMed
    1. Armstrong C, et al. Closed-loop optogenetic intervention in mice. Nature protocols. 2013;8(8):1475–93. Available at: http://www.pubmedcentral.nih.gov/articlerender.fcgi?artid=3988315&tool=p.... - PMC - PubMed
    1. Avanzini G, et al. Calcium-dependent regulation of genetically determined spike and waves by the reticular thalamic nucleus of rats. Epilepsia. 1993;34(1):1–7. - PubMed
    1. Avanzini G, et al. Cortical versus thalamic mechanisms underlying spike and wave discharges in GAERS. Epilepsy Research. 1996:37–44. - PubMed

Publication types