. 2017 Jan 9;31(1):21-34.
doi: 10.1016/j.ccell.2016.11.005. Epub 2016 Dec 15.

Nerve Growth Factor Promotes Gastric Tumorigenesis through Aberrant Cholinergic Signaling

Affiliations

Nerve Growth Factor Promotes Gastric Tumorigenesis through Aberrant Cholinergic Signaling

Yoku Hayakawa et al. Cancer Cell. .

Abstract

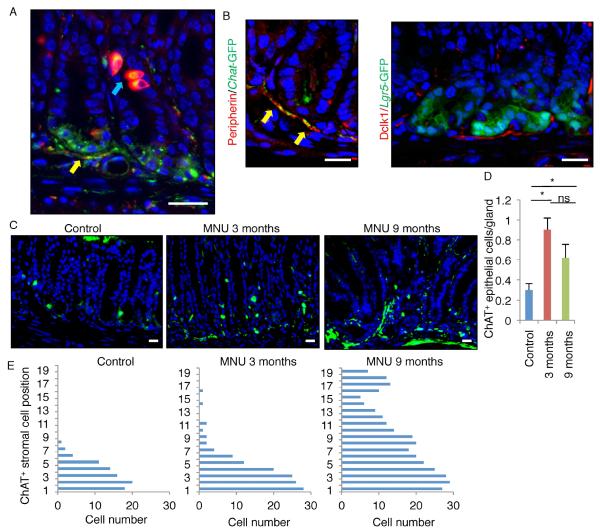
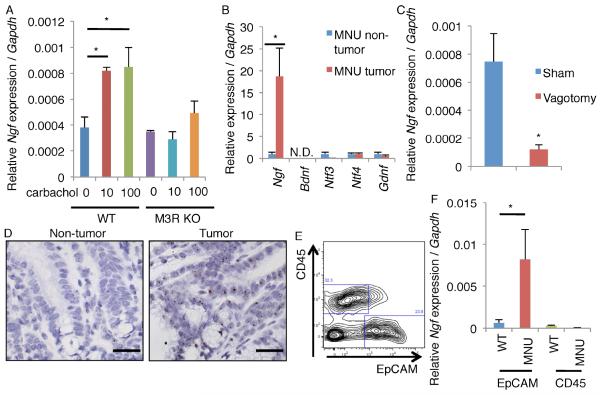
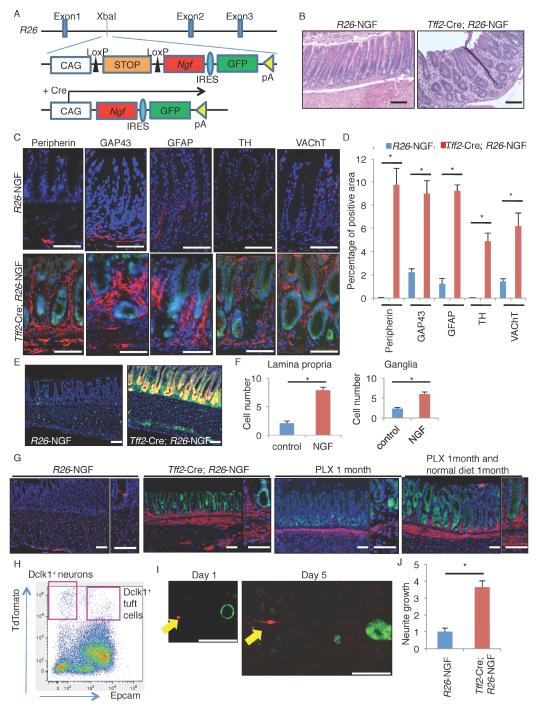
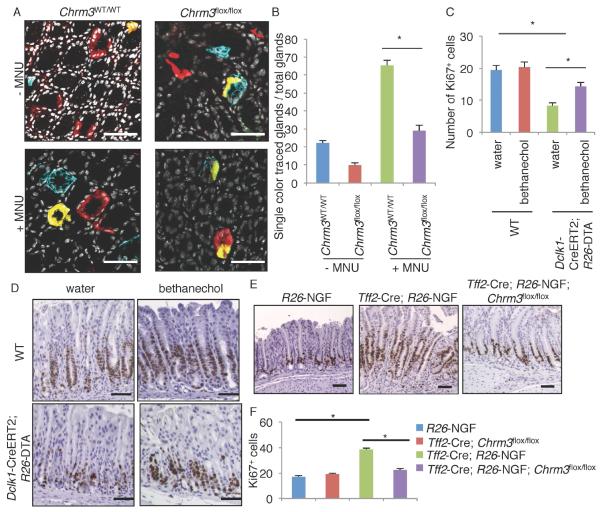
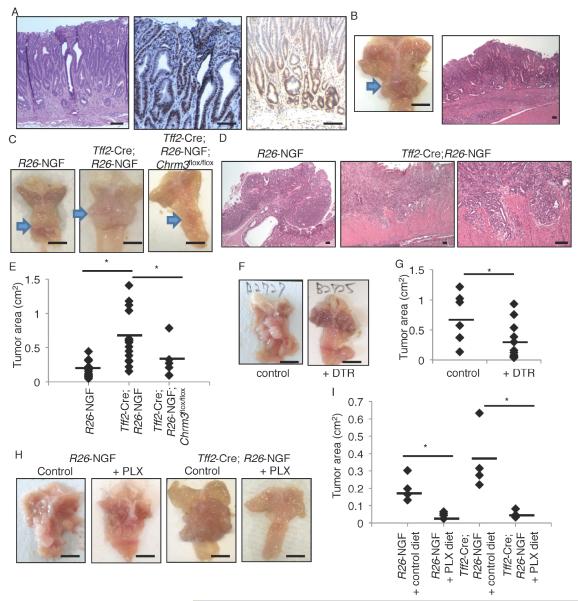
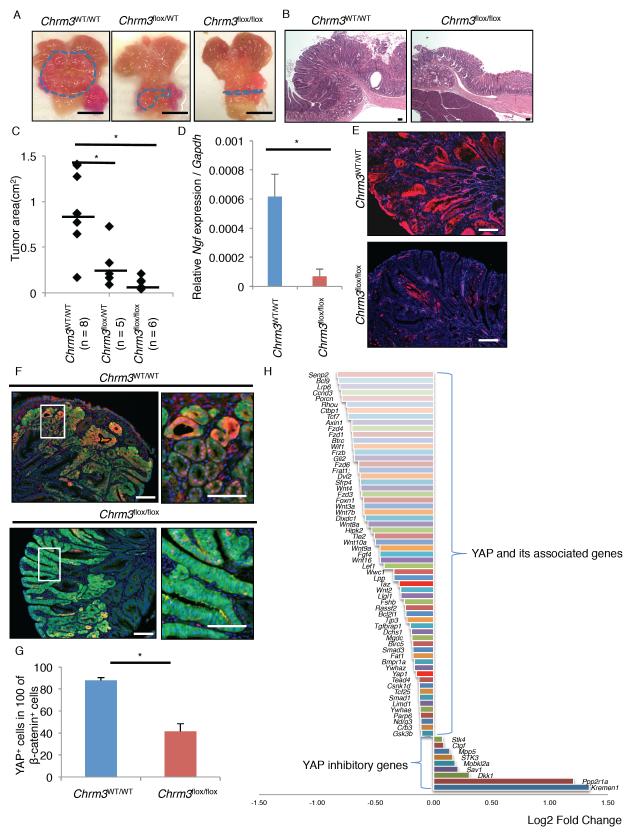
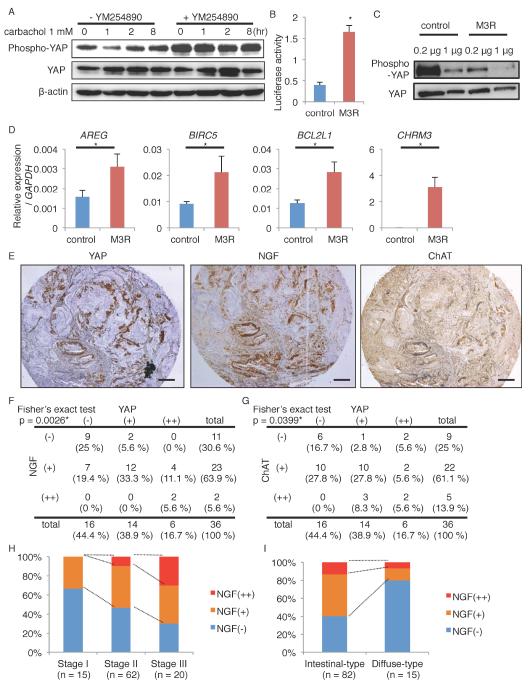
Within the gastrointestinal stem cell niche, nerves help to regulate both normal and neoplastic stem cell dynamics. Here, we reveal the mechanisms underlying the cancer-nerve partnership. We find that Dclk1+ tuft cells and nerves are the main sources of acetylcholine (ACh) within the gastric mucosa. Cholinergic stimulation of the gastric epithelium induced nerve growth factor (NGF) expression, and in turn NGF overexpression within gastric epithelium expanded enteric nerves and promoted carcinogenesis. Ablation of Dclk1+ cells or blockade of NGF/Trk signaling inhibited epithelial proliferation and tumorigenesis in an ACh muscarinic receptor-3 (M3R)-dependent manner, in part through suppression of yes-associated protein (YAP) function. This feedforward ACh-NGF axis activates the gastric cancer niche and offers a compelling target for tumor treatment and prevention.

Keywords: Dclk1; Lgr5; NGF; YAP; acetylcholine; gastric cancer; muscarinic acetylcholine receptor type 3; stem cell; tuft cell; wnt.


Figures

Figure 1
Figure 1. ChAT+ tuft cells and nerves expand during carcinogenesis
(A) Dclk1 staining (red) in Chat-GFP (green) mice antrum. Blue arrow indicates tuft cells, and yellow arrow indicates nerves. (B) (Left) Peripherin staining (red) in Chat-GFP mice antrum. Arrows indicate GFP+ nerves. (Right) Dclk1 staining (red) in Lgr5-GFP mice antrum. (C) Chat-GFP expression with or without MNU treatment (3 months and 9 months after the beginning of MNU). (D) The number of ChAT+ epithelial cells per gland in MNU-treated or untreated stomachs. Total 100 glands per group are analyzed. (E) Cell position of ChAT+ stromal cells in MNU-treated or untreated stomachs. Total 50 glands per group are analyzed. Means ± SEM. *p < 0.05 (ANOVA). DAPI = blue. Bars = 20 m. See also Figure S1.
Figure 2
Figure 2. ACh signaling stimulates NGF production
(A) Ngf expression in cultured gastric orgnoids from WT and Chrm3 knockout (M3R KO) mice. Organoids were treated with carbachol for 7 days. n = 4/group. (B) Relative expression per Gapdh of neurotrophin family in MNU-treated mouse non-tumor and tumor tissues. The average expression of each gene in non-tumor tissues is set as 1.0. n = 4/group. N.D. means “not detected”. (C) Relative Ngf expression per Gapdh in MNU tumors isolated from mice which have taken vagotomy or sham treatment. n = 3/group. (D) In situ hybridyzation of Ngf in MNU-treated non-tumor and tumor area. (E) FACS plot of EpCAM and CD45 from MNU tumors. (F) Relative Ngf expression per Gapdh in EpCAM+ cells and CD45+ cells isolated from WT and MNU-treated mice. n = 3/group. Means ± SEM. *p < 0.05 (ANOVA in A, t-test in B, C and F). Bars = 20 m. See also Figure S2.
Figure 3
Figure 3. NGF/Trk signaling regulates mucosal innervation
(A) Gene construct of R26-LSL-Ngf-IRES-EGFP mice. (B) H&E staining of R26-NGF and Tff2-Cre; R26-NGF mouse stomach. (C-D) Neuron and glial marker staining (C, red) and quantification (D) in R26-NGF and Tff2-Cre; R26-NGF (green) mice. The percentages of positive area per total mucosal area are quantified in 4 images per group. (E-F) Nes-GFP expression (E) and the cell number of GFP+ cells (F) in lamina propria (per stromal gap between 2 glands) and ganglia (per ganglia) in 6-week-old R26-NGF; Nes-GFP and Tff2-Cre; R26-NGF; R26-TdTomato; Nes-GFP mice. Total 20 glands and 20 ganglia are analyzed. Both NGF+ Tff2-Cre lineage cells and Nes-GFP+ cells are colored by green. (G) Dclk1 staining (red) of R26-NGF mice, Tff2-Cre; R26-NGF (green) mice, Tff2-Cre; R26-NGF mice treated with PLX for 1 month, and Tff2-Cre; R26-NGF mice treated with PLX for 1 month and subsequently treated with normal diet for another 1 month. (H-J) Co-culture experiment of sorted Dclk1+ stromal cells (red) and Tff2-Cre; R26-NGF gastric organoids (green). (H) FACS plot of Dclk1-CreERT; R26-TdTomato mouse stomach with EpCAM staining 1 day after tamoxifen induction. (I) Day 1 and 5 neurite growth image in NGF+ organoid (green) co-culture. Arrows indicate Dclk1+ neurons (red). (J) Quantification of length of neurite growth. The length with WT organoid co-culture is set as 1.0. n = 20/group. Means ± SEM. *p < 0.05 (t-test). DAPI = blue. Bars = 100 m. See also Figure S3.
Figure 4
Figure 4. ACh/M3R signaling regulates mucosal proliferation and stem cell expansion
(A-B) Cross sectional images (A) of Lgr5-CreERT2; R26-Confetti mice (Chrm3WT/WT) and Lgr5-CreERT; Chrm3flox/flox; R26-Confetti mice. Mice were treated with tamoxifen, following with or without 5 cycles of MNU. DAPI = white. (B) Percentages of the glands that were fully traced by single color per total glands where recombination occurs. Total 80 glands from 4 mice per group are analyzed. (C-D) The number of Ki67+ cells per gland (C) and Ki67 staining (D) in WT and Dclk1-CreERT; R26-DTA mice. Mice were treated with tamoxifen on day 1, and given bethanechol for 5 days. Total 90 glands from 3 mice per group are analyzed. (E-F) Ki67 staining (E) and the number of Ki67+ cells per gland (F) in R26-NGF, Tff2-Cre; Chrm3flox/flox, Tff2-Cre; R26-NGF, and Tff2-Cre; R26-NGF; Chrm3flox/flox mice. Total 90 glands from 3 mice per group are analyzed. Means ± SEM. *p < 0.05 (ANOVA). Bars = 100 m. See also Figure S4.
Figure 5
Figure 5. Initiating the ACh-NGF axis is sufficient to cause gastric cancer
(A) H&E (left), Ki67 (middle), and CD44 (right) staining of 8-month-old Tff2-Cre; R26-NGF mice. (B) Gross picture and H&E staining of 18-month-old Tff2-Cre; R26-NGF mice stomach. Arrow indicates tumor. (C-E) MNU-induced tumors in R26-NGF (n = 19), Tff2-Cre; R26-NGF (n = 16), and Tff2-Cre; R26-NGF; Chrm3flox/flox (n = 6) mice. Mice were sacrificed at 48 weeks after the beginning of MNU. Gross picture (C), H&E image (D), and tumor area (cm2) (E) are shown. Arrows indicate tumors. (F-G) MNU-treated Dclk1-CreERT; R26-DTR mice were treated with vehicle (n = 7) or DT (10 g/kg, n = 13). Vehicle or DT and tamoxifen were given once a week from 28 weeks to 52 weeks after the beginning of MNU. Representative tumor image (F) and tumor area (G) are shown. (H-I) Gross images (H) and tumor area (I) of MNU-treated R26-NGF and Tff2-Cre; R26-NGF mice with or without PLX treatment. PLX was given from 24 weeks to 36 weeks after the beginning of MNU. n = 4/group. Average tumor area is indicated by black bars. Means ± SEM. *p < 0.05 (ANOVA in E, t-test in G and I). Bars = 100 m (A, B right), 5 mm (B left, C, F, H). See also Figure S5.
Figure 6
Figure 6. M3R signaling regulates Apc-dependent tumor growth through YAP activation
(A-C) Gross pictures (A) and H&E images (B) of Mist1-CreERT; Apcflox/flox, Mist1-CreERT; Apcflox/flox; Chrm3flox/WT, and Mist1-CreERT; Apcflox/flox; Chrm3flox/flox mouse tumors. Lines indicate tumor area. Tumor area (cm2) is quantified in (C). Average tumor area is indicated by black bars. (D-G) Ngf gene expression per Gapdh (D, n = 3) and immunofluorescence of NGF (E, red) and doublestaining of YAP (F, red) and β-catenin (green) in Mist1-CreERT; Apcflox/flox and Mist1-CreERT; Apcflox/flox; Chrm3flox/flox mouse tumors. Bottom panels in F are enlarged images of white box area in top panels. Numbers of YAP+ cells in 100 nuclear β-catenin+ cells are shown in (G). Total 500 nuclear β-catenin+ cells per group are analyzed. (H) Fold changes of YAP-related gene expression in mouse gastric tumor on the vagotomized side compared to tumor on the non-vagotomized side. Means ± SEM. *p < 0.05 (ANOVA in C, t-test in D and G). DAPI = blue. Bars = 100 m (B, E, F), 5 mm (A). See also Figure S6.
Figure 7
Figure 7. M3R activates YAP signaling in human gastric cancer cells
(A) Immunoblotting of TMK-1 cells treated with 1 mM carbachol for the indicated times. Cells were pretreated with vehicle or 10 m YM254890. β-actin was used as a loading control. (B-D) Relative YAP luciferase activity (B, n = 3/group), immunoblotting (C), and relative gene expression (D, n = 3/group) in AGS cells transfected with control or M3R-expressing vectors. Samples are collected 24 hours after transfection. (E) Representative images of YAP, NGF, ChAT staining in human gastric cancers. (F-G) Correlation between the expression levels of YAP and NGF (F), and of YAP and ChAT (G) in 36 gastric cancer cases. (H-I) NGF positivity in different cancer stages (H) and histological forms (I) in 97 gastric cancer cases. Means ± SEM. *p < 0.05 (t-test in B and D, Fisher in F and G). Bars = 200 m. See also Figure S7, Table S1, and Table S2.

Comment in

Similar articles

Cited by

References

    1. Aihara T, Fujishita T, Kanatani K, Furutani K, Nakamura E, Taketo MM, Matsui M, Chen D, Okabe S. Impaired gastric secretion and lack of trophic responses to hypergastrinemia in M3 muscarinic receptor knockout mice. Gastroenterology. 2003;125:1774–1784. - PubMed
    1. Aihara T, Nakamura Y, Taketo MM, Matsui M, Okabe S. Cholinergically stimulated gastric acid secretion is mediated by M(3) and M(5) but not M(1) muscarinic acetylcholine receptors in mice. Am J Physiol Gastrointest Liver Physiol. 2005;288:G1199–1207. - PubMed
    1. Albo D, Akay CL, Marshall CL, Wilks JA, Verstovsek G, Liu H, Agarwal N, Berger DH, Ayala GE. Neurogenesis in colorectal cancer is a marker of aggressive tumor behavior and poor outcomes. Cancer. 2011;117:4834–4845. - PubMed
    1. Azzolin L, Panciera T, Soligo S, Enzo E, Bicciato S, Dupont S, Bresolin S, Frasson C, Basso G, Guzzardo V, et al. YAP/TAZ incorporation in the beta-catenin destruction complex orchestrates the Wnt response. Cell. 2014;158:157–170. - PubMed
    1. Bailey JM, Alsina J, Rasheed ZA, McAllister FM, Fu YY, Plentz R, Zhang H, Pasricha PJ, Bardeesy N, Matsui W, et al. DCLK1 marks a morphologically distinct subpopulation of cells with stem cell properties in preinvasive pancreatic cancer. Gastroenterology. 2014;146:245–256. - PMC - PubMed

MeSH terms