. 2016 Dec 1:10:276.
doi: 10.3389/fncel.2016.00276. eCollection 2016.

A Novel Striated Muscle-Specific Myosin-Blocking Drug for the Study of Neuromuscular Physiology

Affiliations

A Novel Striated Muscle-Specific Myosin-Blocking Drug for the Study of Neuromuscular Physiology

Dante J Heredia et al. Front Cell Neurosci. .

Abstract

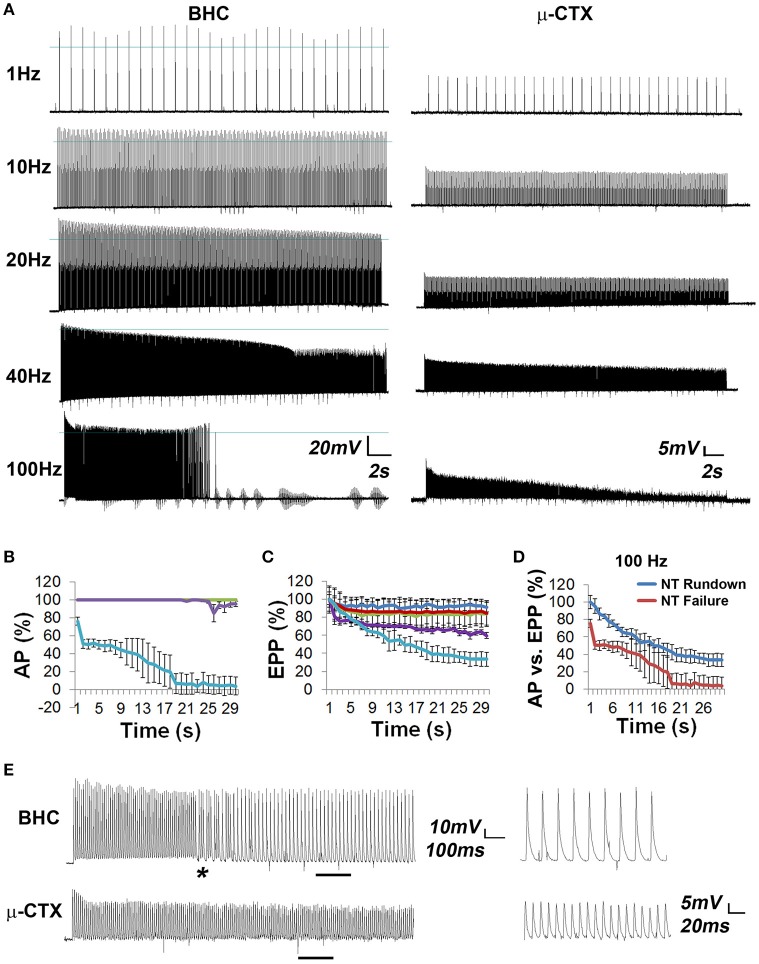
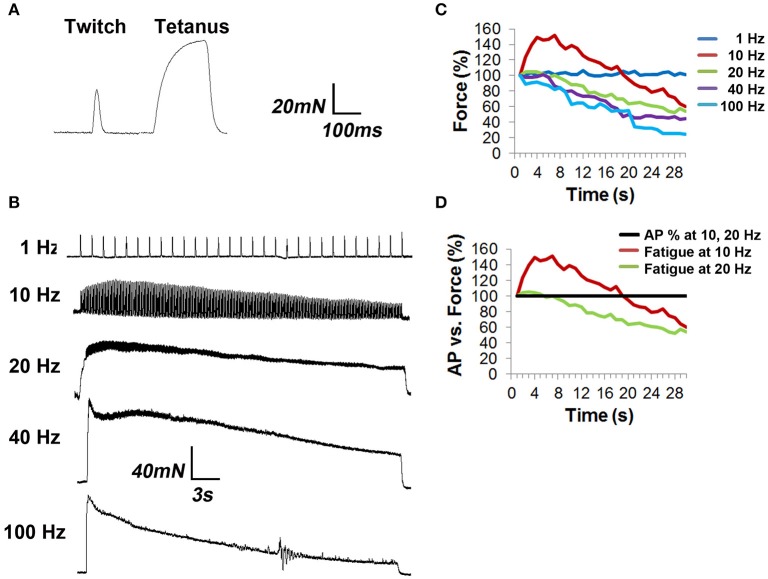
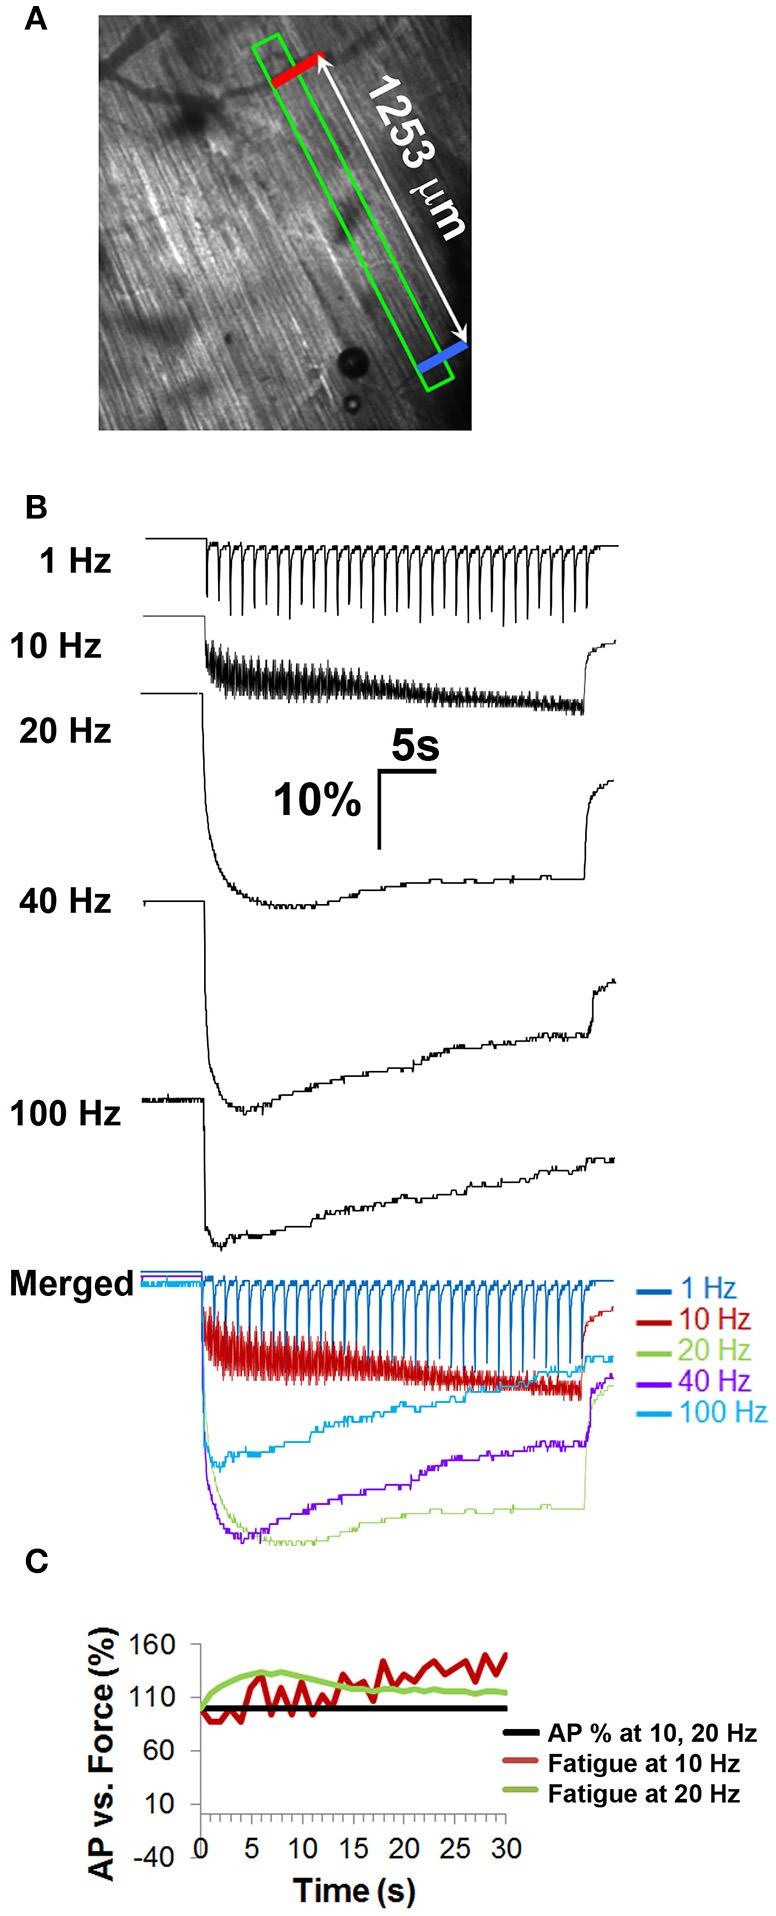
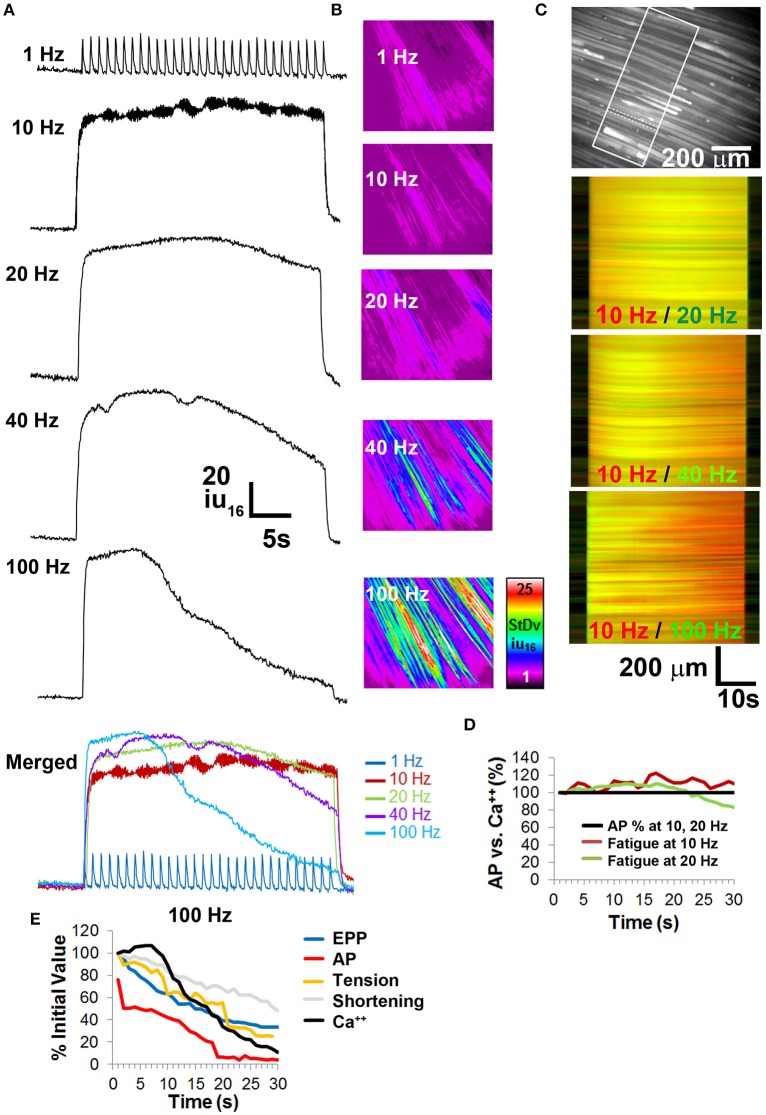
The failure to transmit neural action potentials (APs) into muscle APs is referred to as neuromuscular transmission failure (NTF). Although synaptic dysfunction occurs in a variety of neuromuscular diseases and impaired neurotransmission contributes to muscle fatigue, direct evaluation of neurotransmission by measurement of successfully transduced muscle APs is difficult due to the subsequent movements produced by muscle. Moreover, the voltage-gated sodium channel inhibitor used to study neurotransmitter release at the adult neuromuscular junction is ineffective in embryonic tissue, making it nearly impossible to precisely measure any aspect of neurotransmission in embryonic lethal mouse mutants. In this study we utilized 3-(N-butylethanimidoyl)-4-hydroxy-2H-chromen-2-one (BHC), previously identified in a small-molecule screen of skeletal muscle myosin inhibitors, to suppress movements without affecting membrane currents. In contrast to previously characterized drugs from this screen such as N-benzyl-p-toluene sulphonamide (BTS), which inhibit skeletal muscle myosin ATPase activity but also block neurotransmission, BHC selectively blocked nerve-evoked muscle contraction without affecting neurotransmitter release. This feature allowed a detailed characterization of neurotransmission in both embryonic and adult mice. In the presence of BHC, neural APs produced by tonic stimulation of the phrenic nerve at rates up to 20 Hz were successfully transmitted into muscle APs. At higher rates of phrenic nerve stimulation, NTF was observed. NTF was intermittent and characterized by successful muscle APs following failed ones, with the percentage of successfully transmitted muscle APs diminishing over time. Nerve stimulation rates that failed to produce NTF in the presence of BHC similarly failed to produce a loss of peak muscle fiber shortening, which was examined using a novel optical method of muscle fatigue, or a loss of peak cytosolic calcium transient intensity, examined in whole populations of muscle cells expressing the genetically-encoded calcium indicator GCaMP3. Most importantly, BHC allowed for the first time a detailed analysis of synaptic transmission, calcium signaling and fatigue in embryonic mice, such as in Vamp2 mutants reported here, that die before or at birth. Together, these studies illustrate the wide utility of BHC in allowing stable measurements of neuromuscular function.

Keywords: fatigue; neurodegenerative; neuromuscular.


Figures

Figure 1
Figure 1
BHC permits the measurement of nerve-evoked muscle action potentials (APs). (A) Representative image of an AP recorded in the presence of 50 μM BHC with a sharp intracellular electrode from the motor endplate of an adult mouse diaphragm muscle fiber in response to a single suprathreshold square wave phrenic nerve impulse. Note overshoot. Average amplitudes are lower (E15.5 AP amp = 65.5 ± 1.6 vs. adult AP amp = 75.3 ± 2.2 mV; P < 0.001; n = 55 from 10 mice; B), and 10–90% rise-to-peak (E15.5 R2P = 2.7 ± 0.7 vs. adult R2P = 1.6 ± 0.2 ms; P < 0.001; n = 55 from 10 mice; C), 100–50% decay (E15.5 T2D = 37.8 ± 1.6 vs. adult T2D = 2.4 ± 0.2 ms; P < 0.001; n = 55 from 10 mice; D), and 50–50% halfwidth (E15.5 HW = 30.2 ± 2.7 vs. adult HW = 1.2 ± 0.1 ms; P < 0.001; n = 55 from 10 mice; E) of muscle APs are significantly longer at E15.5 (E15.5) than postnatal stages. (F) Average resting membrane potential (RMP) is less negative at E15.5 vs. postnatal ages (E15.5 RMP = −64.8 ± 4.3 vs. adult RMP = −70 ± 2.6 mV; P < 0.05; n = 5 from three mice; F). The RMP is similar in the presence or absence of 10 μm BHC in the adult; (−72.4 ± 2.3 vs. −72.2 ± 3.6 mV; P = 0.46; n = 5 from three mice; G). The frequency of miniature endplate potentials (mEPPs; 0.27 ± 0.04 vs. 0.38 ± 0.03 mEPPs/s; P = 0.06; 10 s analyzed; n = 8 from five mice; H), as well as the amplitude of mEPPs (1.6 ± 0.3 vs. 1.5 ± 0.2 mV; P = 0.1; n = 22 from five mice; I) and EPPs (26.2 ± 1.1 vs. 26.7 ± 1.3 mV; P = 0.06; n = 22 from five mice; J) are similar in the presence or absence of BHC in the adult. All values expressed in means ±SD.
Figure 2
Figure 2
Comparison of EPPs vs. muscle APs in whole diaphragm in response to high-frequency nerve stimulation (HFS) shows that muscle APs fail intermittently, whereas neurotransmitter release falls gradually. (A) Left panels show representative muscle AP traces, recorded in the presence of 50 μM BHC, in response to 30-s trains of tonic phrenic nerve stimulation at different frequencies. Overshoots are portions of the muscle AP above 0 mV, which is demarcated by a blue line in each trace. Right panels show representative EPP traces, recorded in the presence of 2.3 μM μ-CTX, in response to the same stimuli. Note the presence of muscle AP failure in response to 100 Hz. (B) The percent of successfully transmitted muscle APs per second (AP %), over time, in response to different frequencies of HFS (blue = 1 Hz; red = 10 Hz; green = 20 Hz; purple = 40 Hz; light blue = 100 Hz. The straight line at 100% for 1, 10, and 20 Hz reflects the lack of failure in response to 30 s of stimulation at these frequencies. (C) Synaptic rundown of released neurotransmitter (NT), measured by EPP amplitude, in response to the same trains of stimuli. (D) Comparison of NT release rundown (in presence of μ-CTX) and neural transmission failure (NTF) in presence of BHC. (E) Left panel shows a comparison of the first few seconds of AP (BHC) and EPP (μ-CTX) traces in response to 100 Hz stimulation. Asterisk represents first failed AP. Underlined areas are enlarged in right panel and show the pattern of APs and EPPs after a corresponding period of HFS. For every muscle AP, there are two, nearly equal-sized EPPs.
Figure 3
Figure 3
The percentage of muscle APs with defined times to neural transmission failure coincides with the percentage of muscle fibers expressing fatigue-conferring myosin isoforms. (A) Representative trace of a muscle fiber exhibiting only intermittent failure for the entire 30-s period in response to 100 Hz stimulation. Note the difference between this cell and that in Figure 2A. (B) When cells were plotted individually according to when they exhibited NTF, three subpopulations emerged, those exhibiting failure near 10 s (blue), those near 20 s (green), and those only displaying partial failure even after 30 s, similar to the trace in (A); (blue line). (C) Fresh-frozen cross sections of muscle stained with antibodies recognizing Type I, slow, oxidative MHC (blue), Type IIA fast fatigue-resistant, glycolytic/oxidative MHC (green), and Type IIB fast-fatiguable glycolytic MHC (red), or no antibody labeling (Type IIx). Scalebar = 100 μm. The relative percentage of these myosin-expressing subpopulations is similar to the relative percentage of muscle subpopulations fatiguing in response to 100 Hz at different times, as shown in (B).
Figure 4
Figure 4
Tension studies in diaphragm strips show fatigue in response to frequencies of nerve stimulation that fail to show neural transmission failure. (A) Diaphragm strips with intact phrenic nerve were excited with single suprathreshold square wave nerve pulses (twitch) or 330 ms of nerve stimulation at 70 Hz (tetanus). (B) Representative traces of diaphragm strip responses to 30 s trains of tonic nerve stimulation at different frequencies. Note the several-second buildup to peak tension in response to 10 Hz stimulation, followed by fatigue, as well as the progressively enhanced fatigue in response to 20, 40, and 100 Hz stimulation. (C) The percent specific force (Force %), over time, in response to different frequencies of HFS, shows that all frequencies above 1 Hz produce fatigue. Error bars left off for clarity. (D) Comparison of force to AP success rate in response to 10 and 20 Hz shows that peak tension declines in the absence of NTF at these frequencies.
Figure 5
Figure 5
Fiber shortening studies in whole diaphragm fail to show fatigue in response to frequencies of nerve stimulation that fail to show neural transmission failure. (A) Field of view from which optical measurements were taken and distance between the two contrasted regions (indicated by red, blue bars) that were tracked in response to nerve stimulation. (B) Representative percent control traces of fiber shortening in response to different frequencies of tonic nerve stimulation. Note the change to tetanus in response to 10 Hz. Note also the lack of fatigue in response to 10 and 20 Hz stimulation, in contrast to tension studies. (C) Comparison of force to AP success rate in response to 10 and 20 Hz shows that peak fiber shortening does not decline in the absence of NTF at these frequencies.
Figure 6
Figure 6
Calcium imaging studies in whole diaphragm show no fatigue in response to frequencies of nerve stimulation that show no neural transmission failure. (A) Representative standard deviation (SD) of calcium intensity changes (16-bit intensity units; iu16) within BHC-treated muscle fibers from the diaphragm of CAGGS-GCaMP3 mice in response to different frequencies of tonic nerve stimulation. (B) Spatio-temporal (ST) maps of the standard deviation (SD) of intensity represent the loss of intensity over time as a signal that increases with nerve stimulation frequency. (C) Top image illustrates the region of the costal diaphragm, the dotted lines surround a muscle fiber from which the intensity changes in (A) were generated. Boxed region shows population of muscle fibers whose intensities signals were tracked over time for SD maps in (B) or intensity map subtractions in (lower three images in C). Lower images represent differential ST maps of calcium intensity over time in response to different frequencies of nerve stimulation. In the 10/20 Hz comparison, the yellow signal from left to right indicates that the 10 and 20 Hz ST intensity maps (red, green) are equally maintained over the 30 s duration, whereas the red signal in the bottom two comparisons indicates a loss of signal in the green 40 or 100 Hz ST intensity maps over time. (D) No significant loss of calcium signal is observed over time at frequencies that fail to induce NTF. (E) Comparison of EPP rundown, AP transmission success rate, muscle force via tension or shortening, and calcium intensity, in response to 100 Hz nerve stimulation.
Figure 7
Figure 7
Characterization of HFS in embryonic wild-type (WT) and Vamp2 mutant mice. (A) Representative merged percent control traces of fiber shortening in E15.5 WT mice. Note the progressive change in length (shortening) of embryonic muscle fibers in response to increasing nerve stimulation frequency. Note also the loss in maintenance of peak length change in response to 20 Hz (green). (B) In contrast, HFS produces profoundly less fiber shortening in E15.5 Vamp2 mutants. Images to the right of each graph in (A,B) show the field of view from which data was obtained, including the distance between the two contrasted regions (indicated by red, blue bars) that were tracked in response to nerve stimulation. (C) Representative recordings from the diaphragms of E15.5 WT (top trace) or Vamp2 mutant (bottom trace) in the presence of BHC show that although nerve stimulation can produce muscle APs in Vamp2 mutants, even low frequencies result in NTF, illustrated by subthreshold muscle potentials (asterisk).

Similar articles

Cited by

References

    1. Agbulut O., Noirez P., Beaumont F., Butler-Browne G. (2003). Myosin heavy chain isoforms in postnatal muscle development of mice. Biol. Cell 95, 399–406. 10.1016/S0248-4900(03)00087-X - DOI - PubMed
    1. Albantakis L., Lohmann C. (2009). A simple method for quantitative calcium imaging in unperturbed developing neurons. J. Neurosci. Methods 184, 206–212. 10.1016/j.jneumeth.2009.08.004 - DOI - PubMed
    1. Aldrich T. K., Appel D. (1985). Diaphragm fatigue induced by inspiratory resistive loading in spontaneously breathing rabbits. J. Appl. Physiol. 59, 1527–1532. - PubMed
    1. Allen D. G., Lamb G. D., Westerblad H. (2008). Skeletal muscle fatigue: cellular mechanisms. Physiol. Rev. 88, 287–332. 10.1152/physrev.00015.2007 - DOI - PubMed
    1. Allen M. D., Kimpinski K., Doherty T. J., Rice C. L. (2015). Decreased muscle endurance associated with diabetic neuropathy may be attributed partially to neuromuscular transmission failure. J. Appl. Physiol. 118, 1014–1022. 10.1152/japplphysiol.00441.2014 - DOI - PMC - PubMed

LinkOut - more resources