Review
. 2016 May 27:10:15-23.
doi: 10.1016/j.bdq.2016.05.002. eCollection 2016 Dec.

Fundamentals of multiplexing with digital PCR

Affiliations
Review

Fundamentals of multiplexing with digital PCR

Alexandra S Whale et al. Biomol Detect Quantif. .

Abstract

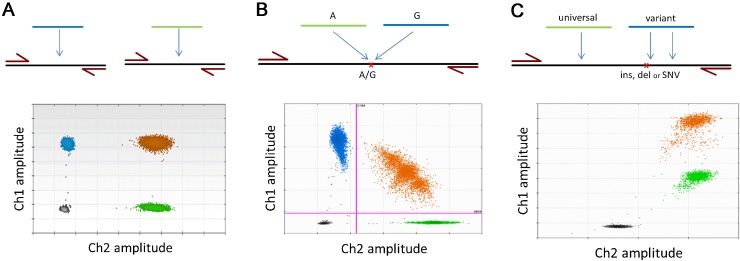
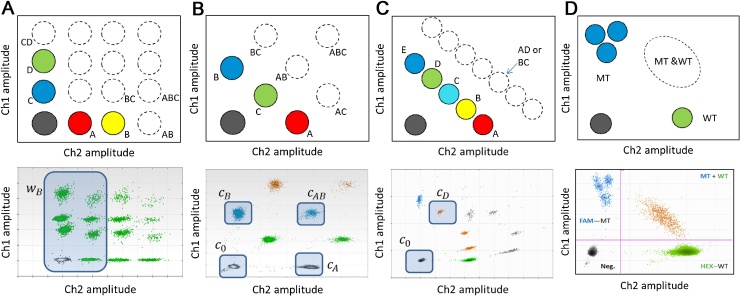
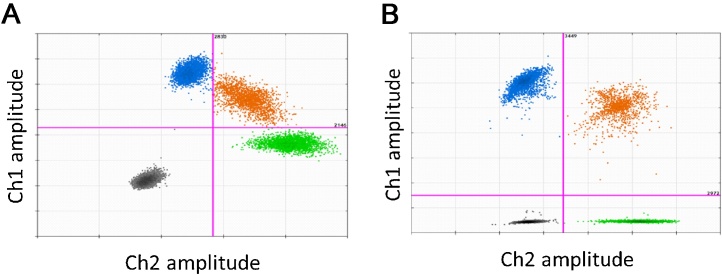
Over the past decade numerous publications have demonstrated how digital PCR (dPCR) enables precise and sensitive quantification of nucleic acids in a wide range of applications in both healthcare and environmental analysis. This has occurred in parallel with the advances in partitioning fluidics that enable a reaction to be subdivided into an increasing number of partitions. As the majority of dPCR systems are based on detection in two discrete optical channels, most research to date has focused on quantification of one or two targets within a single reaction. Here we describe 'higher order multiplexing' that is the unique ability of dPCR to precisely measure more than two targets in the same reaction. Using examples, we describe the different types of duplex and multiplex reactions that can be achieved. We also describe essential experimental considerations to ensure accurate quantification of multiple targets.

Keywords: Digital PCR; Duplex; Higher order multiplexing; Multiplexing; dPCR.


Figures

Fig. 1
Fig. 1
Graphical outputs for duplexing strategies. All illustrative examples given here used the QX200™ Droplet Digital™ PCR System (Bio-Rad). A schematic is given for the primer and probe hybridisation arrangements with an example of the configuration of clusters in the 2D plot underneath. For each plot, the amplitude in channel 1 (ch1) is represented on the y-axis with the amplitude in channel 2 (ch2) represented on the x-axis. Four clusters are identified as single-positive for Ch1 (blue) and Ch2 (green), double-positive (orange) and double-negative (grey). (A) For non-competing duplex reactions, a rectangular conformation is observed between the four clusters. The amplitude of the double-positive cluster is approximately equal to that of the two single-positive clusters. (B) For competing duplex reactions, the four clusters have been pulled out of the rectangular conformation observed in (A). The double-positive cluster has dropped inwards and formed an arc across the scatter plot. (C) For non-competing (hybrid) duplex reactions, only three clusters are visible. Discrimination of the variant and double-positive clusters is not possible (all partitions are coloured orange).
Fig. 2
Fig. 2
Graphical outputs for higher order multiplexing strategies. All illustrative examples given here used the QX200™ Droplet Digital™ PCR System (Bio-Rad). For each multiplexing strategy a schematic and worked example of the configuration of clusters in the 2D plot is given with the amplitude in channel 1 (ch1) is represented on the y-axis with the amplitude in channel 2 (ch2) is represented on the x-axis. For each schematic the approximate location of the single target positive clusters are identified as solid coloured circles with the double or triple target positive clusters are shown as dotted circles. For the worked examples, the clusters are not pseudocoloured according to the target due to the limitations of the software. (A) For amplitude-based multiplexing, four independent targets are being quantified: targets A (100% Ch2-labelled probe), B (100% Ch2), C (50% Ch1) and D (100% Ch1) giving 16 possible clusters in the 2D amplitude space. For the worked example, all the clusters containing partitions that do not contain target B are lassoed (wB). (B) For ratio-based multiplexing, three independent targets are being quantified: targets A (100% Ch2), B (100% Ch1) and C (50% Ch2 and 50% Ch1) giving 8 possible clusters in the 2D amplitude space. For the worked example, the four clusters used in the quantification are lassoed and labelled: negative cluster for all targets (c0), single-positive for target B (cB), single-positive for target A (cA), and double-positive for targets A and B (cAB). (C) For ratio-based non-discriminating multiplexing, five targets are being quantified: targets A (100% Ch2), B (75% Ch2/25%Ch1), C (50% Ch2/50% Ch1), D (25% Ch2/75% Ch1) and E (100% Ch1). A total of 32 combinations of clusters are possible, however, due to the ratios of the probes for the different targets, most are not uniquely identifiable. For example, a cluster containing both targets A and D (125% Ch2/75% Ch1) would not be distinguishable from a cluster containing both targets B and C (also 125% Ch2/75% Ch1). Therefore only the single-positive clusters can be used in the quantification. For the worked example, the two clusters used for the quantification of target D are lassoed: negative cluster for all targets (c0) and single-positive cluster for target D (cD). (D) For non-discriminating multiplexing the example of the KRAS mutations in codons 12 and 13 is shown. The 7 probes for the mutant SNVs are all conjugated with the Ch1-labelled probe and the WT probe is conjugated with the Ch2-labelled probe. Three diffuse clusters are visible in the mutant probe channel with a single cluster in the WT channel. The double-positive cluster is also visible. It is not possible to discriminate between the 3 mutant clusters and so this set up allows quantification of the total number of mutant sequences only.
Fig. 3
Fig. 3
Considerations for accurate quantification. All illustrative examples given here used the QX200™ Droplet Digital™ PCR System (Bio-Rad) using duplex reactions; however, all of these are relevant for higher order multiplexing strategies. (A) For the analysis of a probe-competing duplex reactions to quantify a transition mutation. Cross-hybridisation of the probes caused by either mismatched binding of the probes or filter bleed-though can be visualised as a ‘leaning’ (blue) or ‘lifting’ (green) of the single-positive clusters. This can impact on positioning the thresholds to separate the four clusters. (B) Analysis of a probe-competing duplex reaction to detect a 3 amino acid deletion mutation to illustrate that mismatched binding of the probes does not cause the ‘leaning’ or ‘lifting’ of the clusters compared with that observed in (A).

References

    1. Vogelstein B., Kinzler K.W. Digital PCR. Proc. Natl. Acad. Sci. U. S. A. 1999;96:9236–9241. - PMC - PubMed
    1. Sykes P.J., Neoh S.H., Brisco M.J., Hughes E., Condon J., Morley A.A. Quantitation of targets for PCR by use of limiting dilution. Biotechniques. 1992;13:444–449. - PubMed
    1. Huggett J.F., Foy C.A., Benes V., Emslie K., Garson J.A., Haynes R., Hellemans J., Kubista M., Mueller R.D., Nolan T. The digital MIQE guidelines: minimum information for publication of quantitative digital PCR experiments. Clin. Chem. 2013;59:892–902. - PubMed
    1. Weaver S., Dube S., Mir A., Qin J., Sun G., Ramakrishnan R., Jones R.C., Livak K.J. Taking qPCR to a higher level: analysis of CNV reveals the power of high throughput qPCR to enhance quantitative resolution. Methods. 2010;50:271–276. - PubMed
    1. Sanders R., Huggett J.F., Bushell C.A., Cowen S., Scott D.J., Foy C.A. Evaluation of digital PCR for absolute DNA quantification. Anal. Chem. 2011;83:6474–6484. - PubMed