Review of mesoscopic optical tomography for depth-resolved imaging of hemodynamic changes and neural activities
- PMID: 27990452
- PMCID: PMC5108095
- DOI: 10.1117/1.NPh.4.1.011009
Review of mesoscopic optical tomography for depth-resolved imaging of hemodynamic changes and neural activities
Abstract
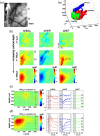
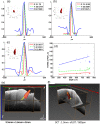
Understanding the functional wiring of neural circuits and their patterns of activation following sensory stimulations is a fundamental task in the field of neuroscience. Furthermore, charting the activity patterns is undoubtedly important to elucidate how neural networks operate in the living brain. However, optical imaging must overcome the effects of light scattering in the tissue, which limit the light penetration depth and affect both the imaging quantitation and sensitivity. Laminar optical tomography (LOT) is a three-dimensional (3-D) in-vivo optical imaging technique that can be used for functional imaging. LOT can achieve both a resolution of 100 to [Formula: see text] and a penetration depth of 2 to 3 mm based either on absorption or fluorescence contrast, as well as large field-of-view and high acquisition speed. These advantages make LOT suitable for 3-D depth-resolved functional imaging of the neural functions in the brain and spinal cords. We review the basic principles and instrumentations of representative LOT systems, followed by recent applications of LOT on 3-D imaging of neural activities in the rat forepaw stimulation model and mouse whisker-barrel system.
Keywords: angled fluorescence laminar optical tomography; functional brain mapping; imaging three-dimensional neural activity; laminar optical tomography; mesoscopic fluorescence molecular tomography; voltage-sensitive dye.
Figures


Similar articles
-
In vivo voltage-sensitive dye imaging of mouse cortical activity with mesoscopic optical tomography.Neurophotonics. 2020 Oct;7(4):041402. doi: 10.1117/1.NPh.7.4.041402. Epub 2020 Dec 2. Neurophotonics. 2020. PMID: 33274250 Free PMC article.
-
In Vivo Mesoscopic Voltage-Sensitive Dye Imaging of Brain Activation.Sci Rep. 2016 Apr 29;6:25269. doi: 10.1038/srep25269. Sci Rep. 2016. PMID: 27125318 Free PMC article.
-
Sub-millimeter resolution 3D optical imaging of living tissue using laminar optical tomography.Laser Photon Rev. 2009 Feb 1;3(1-2):159-179. doi: 10.1002/lpor.200810031. Laser Photon Rev. 2009. PMID: 19844595 Free PMC article.
-
Towards Depth-Resolved Optical Imaging of Cardiac Electrical Activity.Adv Exp Med Biol. 2015;859:405-23. doi: 10.1007/978-3-319-17641-3_16. Adv Exp Med Biol. 2015. PMID: 26238062 Review.
-
Wide-field optical mapping of neural activity and brain haemodynamics: considerations and novel approaches.Philos Trans R Soc Lond B Biol Sci. 2016 Oct 5;371(1705):20150360. doi: 10.1098/rstb.2015.0360. Philos Trans R Soc Lond B Biol Sci. 2016. PMID: 27574312 Free PMC article. Review.
Cited by
-
In vivo voltage-sensitive dye imaging of mouse cortical activity with mesoscopic optical tomography.Neurophotonics. 2020 Oct;7(4):041402. doi: 10.1117/1.NPh.7.4.041402. Epub 2020 Dec 2. Neurophotonics. 2020. PMID: 33274250 Free PMC article.
-
Improving mesoscopic fluorescence molecular tomography via preconditioning and regularization.Biomed Opt Express. 2018 May 23;9(6):2765-2778. doi: 10.1364/BOE.9.002765. eCollection 2018 Jun 1. Biomed Opt Express. 2018. PMID: 30258689 Free PMC article.
-
Monte Carlo-Based Optical Simulation of Optical Distribution in Deep Brain Tissues Using Sixteen Optical Sources.Bioengineering (Basel). 2024 Mar 7;11(3):260. doi: 10.3390/bioengineering11030260. Bioengineering (Basel). 2024. PMID: 38534534 Free PMC article.
-
Depth-resolved imaging of colon tumor using optical coherence tomography and fluorescence laminar optical tomography.Biomed Opt Express. 2016 Nov 21;7(12):5218-5232. doi: 10.1364/BOE.7.005218. eCollection 2016 Dec 1. Biomed Opt Express. 2016. PMID: 28018738 Free PMC article.
-
High-dynamic-range fluorescence laminar optical tomography (HDR-FLOT).Biomed Opt Express. 2017 Mar 9;8(4):2124-2137. doi: 10.1364/BOE.8.002124. eCollection 2017 Apr 1. Biomed Opt Express. 2017. PMID: 28736659 Free PMC article.
References
Publication types
Grants and funding
LinkOut - more resources
Full Text Sources
Other Literature Sources

