. 2016 Dec 19:6:39191.
doi: 10.1038/srep39191.

Quantitative assessment of the regenerative and mineralogenic performances of the zebrafish caudal fin

Affiliations

Quantitative assessment of the regenerative and mineralogenic performances of the zebrafish caudal fin

João Cardeira et al. Sci Rep. .

Abstract

The ability of zebrafish to fully regenerate its caudal fin has been explored to better understand the mechanisms underlying de novo bone formation and to develop screening methods towards the discovery of compounds with therapeutic potential. Quantifying caudal fin regeneration largely depends on successfully measuring new tissue formation through methods that require optimization and standardization. Here, we present an improved methodology to characterize and analyse overall caudal fin and bone regeneration in adult zebrafish. First, regenerated and mineralized areas are evaluated through broad, rapid and specific chronological and morphometric analysis in alizarin red stained fins. Then, following a more refined strategy, the intensity of the staining within a 2D longitudinal plane is determined through pixel intensity analysis, as an indicator of density or thickness/volume. The applicability of this methodology on live specimens, to reduce animal experimentation and provide a tool for in vivo tracking of the regenerative process, was successfully demonstrated. Finally, the methodology was validated on retinoic acid- and warfarin-treated specimens, and further confirmed by micro-computed tomography. Because it is easily implementable, accurate and does not require sophisticated equipment, the present methodology will certainly provide valuable technical standardization for research in tissue engineering, regenerative medicine and skeletal biology.


Conflict of interest statement

The authors declare no competing financial interests.

Figures
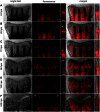
Figure 1
Figure 1. Tissue and lepidotrichia formation during epimorphic regeneration of zebrafish caudal fin at 33 °C.
The same specimen was tracked over time and vitally stained with alizarin red S to assess de novo mineralization. At appropriate times (24, 48, 72, 96, 120 and 240 hpa), the caudal fin was photographed under bright field and fluorescence illumination. Colour channels were then merged. Single ray images beside fluorescence and merged images are magnifications of the lepidotrichia marked with an asterisk at the corresponding stage. (A) at 24 hpa, regenerates were already formed but no mineral deposits were detected. (B) first mineral deposits (arrowhead) were detected at 48 hpa. (C) at 72 hpa, lepidotrichia were already segmenting as evidenced by the presence of intersegment joints (arrowhead). (D) bifurcating lepidotrichia were visible at 96 hpa, with the formation of two new branches at the most distal tip (arrowheads). (E) at 120 hpa, formation of the sister rays was well advanced. (F) although morphologically regenerated at 240 hpa, zebrafish caudal fins were still undergoing regenerative outgrowth; white arrowheads mark the lepidotrichia number 3 from each fin lobe. In bright field images, dashed lines mark the amputation plane. Scale bar is 1 mm for full fin regenerate images and 100 μm for single ray magnifications.
Figure 2
Figure 2. Assessment of the regenerated and mineralized areas.
(AC) Alizarin red S stained fin at 120 hpa. (A) Inter-specimen variability of the regenerated area (REG; outlined by the black dashed line) is corrected with the stump width (STU). Numbers (1–4) show the designation of the lepidotrichia from each of the two fin lobes (L1 and L2). (B) Estimated mineralized area (EMA; outlined by the yellow dashed line) corresponds to the area comprising the mineralized lepidotrichia and the inter-ray space. (C) Real mineralized area (RMA; outlined by the yellow dashed lines) corresponds to the area stained with alizarin red S, excluding the inter-ray space. The measurements necessary to calculate the mean ray width below the amputation plane (RAY) are also presented. (D) Correlation between EMA and RMA is predicted by a simple linear regression (Pearson’s correlation; P < 0.0001; N = 60).
Figure 3
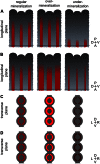
Figure 3. Schematic representation of fin regenerate fragments showing expected mineralogenic outcomes.
Mineralogenic effects (either over- or under-mineralization) can occur within the (A,B) longitudinal or (C,D) transverse planes. Within the longitudinal plane these effects can occur on (A) the anterior-posterior or (B) dorsal-ventral directions. Within the transverse plane effects can originate from changes in the (C) thickness or (D) mineral density of the hemirays. The mineralized rays are represented in red. The different intensities of red refer to (C) different ray thickness or (D) mineral density, with bright red representing thicker rays or rays with higher mineral density and dark red representing thinner rays or rays with lower mineral density. The dashed lines mark the amputation plane. Orientation of the fin tissue is indicated on the right (P, posterior; A, anterior; L, left; R, right).
Figure 4
Figure 4. Time-course of caudal fin tissue regeneration and mineralization and correlation between the two processes.
(A–C) Simplified models designed according to experimental data showing the behaviour of caudal fin regeneration and mineralization (A) throughout time and (B,C) their correlation. Correlation can be divided into three distinct phases (B) where (i) tissue mineralization is not yet effective (P1), (ii) a simple linear regression exists between the tissue regeneration and mineralization (P2) and (iii) tissue regeneration, but not mineralization, is mostly complete (P3; predicted upon additional personal observations). In these models, shifts from the linear regression in P2 would be considered as mineralogenic effects (over- or under-mineralization) (C). (D–F) Validation of the predicted models using fixed specimens collected at regular intervals. (D) Polynomial degree 2 regressions of the whole fin regenerated tissue (REG/STU) and the mineralized fraction of the regenerate ((RMA/RAY)/(REG/STU)) over time (N = 60). Each point was converted into a percentage of the mean values at 240 hpa. (E) Segmental linear regression of RMA/RAY as a function of REG/STU identifying P1 and P2 (N = 60). (F) Plot of the data set between 84 and 240 hpa establishing a simple linear correlation between de novo mineralization and overall regeneration (Pearson’s correlation; P < 0.0001; N = 40). (G–I) Validation of the predicted models using live specimens vitally stained at regular intervals (N = 11). (G) Individual tracking of REG/STU and (RMA/RAY)/(REG/STU) over time. For each time-point, the values were converted into a percentage of the value at 240 hpa. (H) Segmental linear regression of RMA/RAY as a function of REG/STU identifying P1 and P2 (N = 110; 11 specimens analysed at 10 time-points). (I) Plot of the data set between 96 and 240 hpa, establishing a simple linear correlation between de novo mineralization and overall regeneration (Pearson’s correlation; P < 0.0001; N = 77). X0 = X value at the intersection between each of the segments of the regression. m = slope. Colour code indicates time (hpa) for each sampling points.
Figure 5
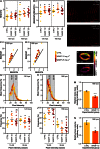
Figure 5. Caudal fin regeneration and mineralization upon exposure to retinoic acid (RA).
(A,B) Regenerating zebrafish caudal fins at 168 hpa exposed to (A) DMSO and (B) 0.050 mg. L−1 of RA. Note the stunted regenerate and fused lepidotrichia (arrowheads). (C) Extent of regeneration at 120 and 168 hpa (P < 0.0001). (D) Extent of mineralization at 120 (P < 0.001) and 168 hpa (P < 0.05). (E,F) Mineralization as a function of regeneration and comparison with the standard linear regression (solid line) determined for fixed specimens in Fig. 4, at (E) 120 and (F) 168 hpa. (G,H) Distribution of pixel intensity at (G) 120 and (H) 168 hpa. Grey boxes indicate classes of pixel intensity used in I and J. (I,J) Integrated analysis of pixel intensity frequencies (I) in classes 15–29 (P = 0.0001) and 30–44 (P < 0.0001) at 120 hpa and (J) in classes 15–29 (P < 0.0001) and 30–44 (P = 0.3393) at 168 hpa. (K,L) 2D μ-CT images showing regenerating lepidotrichia number 3 at 120 hpa exposed to (K) DMSO and (L) 0.025 mg. L−1 of RA, evidencing an uneven bone surface with projections into the intra- and extra-ray regions (arrowheads). (M,N) Relative (M) BMD (P = 0.4225) and (N) bone volume (P = 0.9172) in regenerating rays of fins exposed to DMSO and 0.025 mg.L−1 of RA at 120 hpa. RA 0.025 = 0.025 mg.L−1; RA 0.050 = 0.050 mg.L−1; CTRL = DMSO treatments. The mean is represented in scatterplots. Bar graphs show the mean ± SEM. Statistical differences are marked by lower-case letters (a, b and c) for ANOVA (and Tukey’s post hoc) tests. P values are indicated above. N ≥ 9 for each condition and time-point, except for M and N, in which N = 18 (6 rays × 3 fins). Dashed lines mark the amputation planes. Scale bars are 1 mm for A and B and 50 μm for K and L.
Figure 6
Figure 6. Caudal fin regeneration and mineralization upon exposure to sodium warfarin (WARF).
(A) Extent of regeneration at 120 (P = 0.2971) and 168 hpa (P = 0.5302). (B) Extent of mineralization at 120 (P < 0.05 based on ANOVA; no differences based on Tukey’s test) and 168 hpa (P = 0.1383). (C,D) Mineralization as a function of regeneration and comparison with the standard linear regression (solid line) determined for vitally stained specimens at (C) 120 and (D) 168 hpa. (E,F) Regenerating zebrafish caudal fins at 168 hpa exposed to (E) vehicle and (F) 10 mg. L−1 of WARF. Micrographs were not adjusted for colour. (G,H) Distribution of the pixel intensity at (G) 120 and (H) 168 hpa. Grey boxes indicate classes of pixel intensity used in I and J. (I,J) Integrated analysis of pixel intensity frequencies (I) in classes 15–29 (P < 0.05) and 30–44 (P = 0.4040) at 120 hpa and (J) in classes 15–29 (P < 0.05) and 30–44 (P < 0.05) at 168 hpa. (K, L) 2D μ-CT images showing regenerating lepidotrichia number 3 at 168 hpa exposed to (K) 0 mg. L−1 and (L) 10 mg. L−1 of WARF. (M,N) Relative (M) BMD (****P < 0.0001) and (N) bone volume (**P < 0.01) in regenerating rays of fins exposed to 0 and 10 mg.L−1 of WARF at 168 hpa. WARF 10 = 10 mg.L−1; WARF 25 = 25 mg.L−1; CTRL = 0 mg.L−1. The mean is represented in scatterplots. Bar graphs show the mean ± SEM. Statistical differences are marked by lower-case letters (a, b and c) or asterisks for ANOVA (and Tukey’s post hoc) or t student tests, respectively. P values are indicated above. N ≥ 9 at 120 hpa and N ≥ 7 at 168 hpa for each condition, except for M and N, in which N = 18 (6 rays × 3 fins) for CTRL and 12 (6 rays × 2 fins) for WARF 10. Dashed lines mark the amputation planes. Scale bars are 1 mm for E and F and 50 μm for K and L.

Similar articles

Cited by

References

    1. Poss K. D. Getting to the heart of regeneration in zebrafish. Semin. Cell Dev. Biol. 18, 36–45 (2007). - PubMed
    1. Akimenko M.-A., Marí-Beffa M., Becerra J. & Géraudie J. Old questions, new tools, and some answers to the mystery of fin regeneration. Dev. Dyn. 226, 190–201 (2003). - PubMed
    1. Watanabe N. et al.. Kidney regeneration through nephron neogenesis in medaka. Dev. Growth Differ. 51, 135–143 (2009). - PubMed
    1. Sîrbulescu R. F. & Zupanc G. K. H. Spinal cord repair in regeneration-competent vertebrates: adult teleost fish as a model system. Brain Res. Rev. 67, 73–93 (2011). - PubMed
    1. Gemberling M., Bailey T. J., Hyde D. R. & Poss K. D. The zebrafish as a model for complex tissue regeneration. Trends Genet. 29, 611–620 (2013). - PMC - PubMed

Publication types