. 2017 Feb 1;127(2):472-486.
doi: 10.1172/JCI85052. Epub 2016 Dec 19.

Fluorescent aminoglycosides reveal intracellular trafficking routes in mechanosensory hair cells

Fluorescent aminoglycosides reveal intracellular trafficking routes in mechanosensory hair cells

Dale W Hailey et al. J Clin Invest. .

Abstract

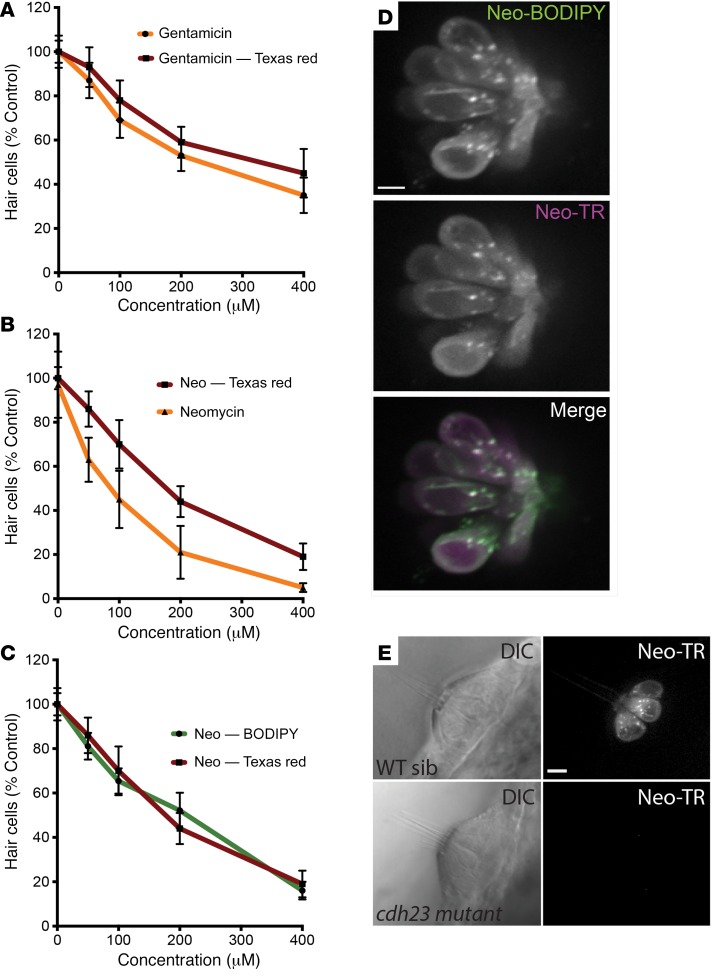
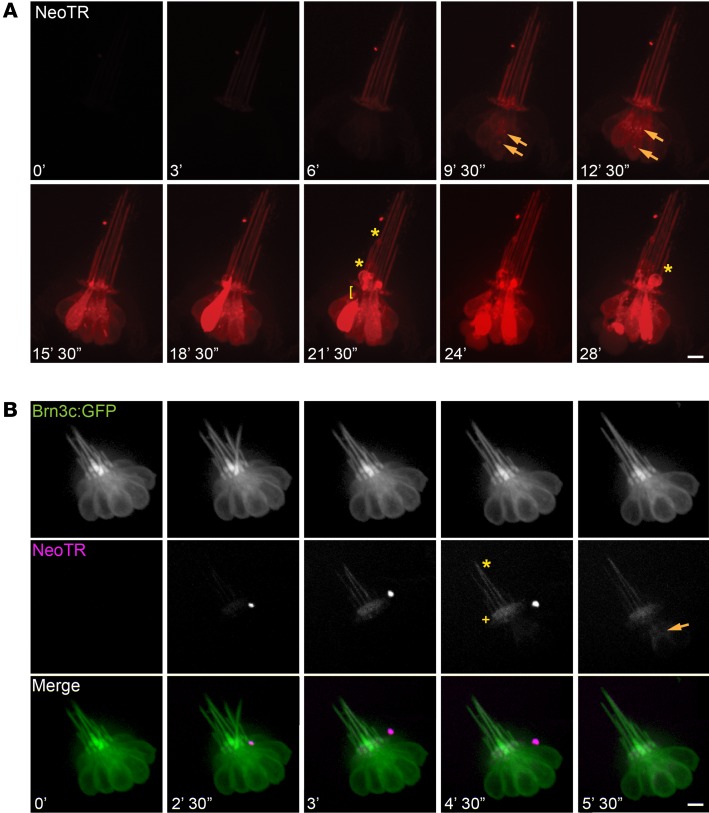
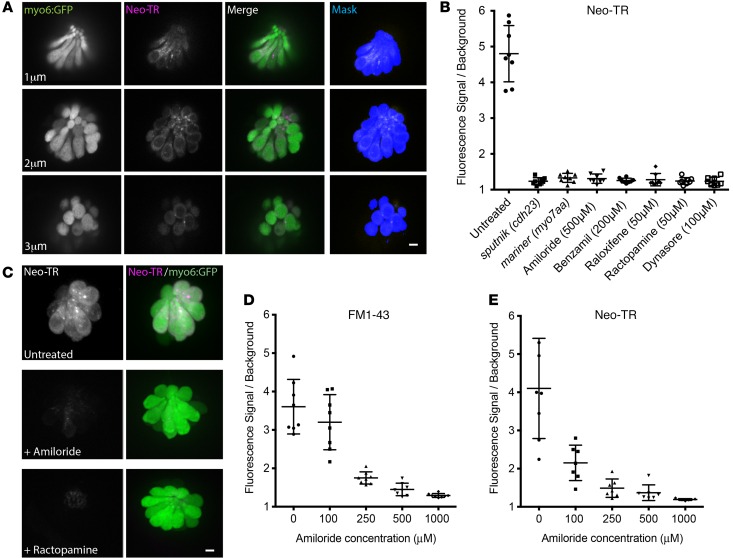
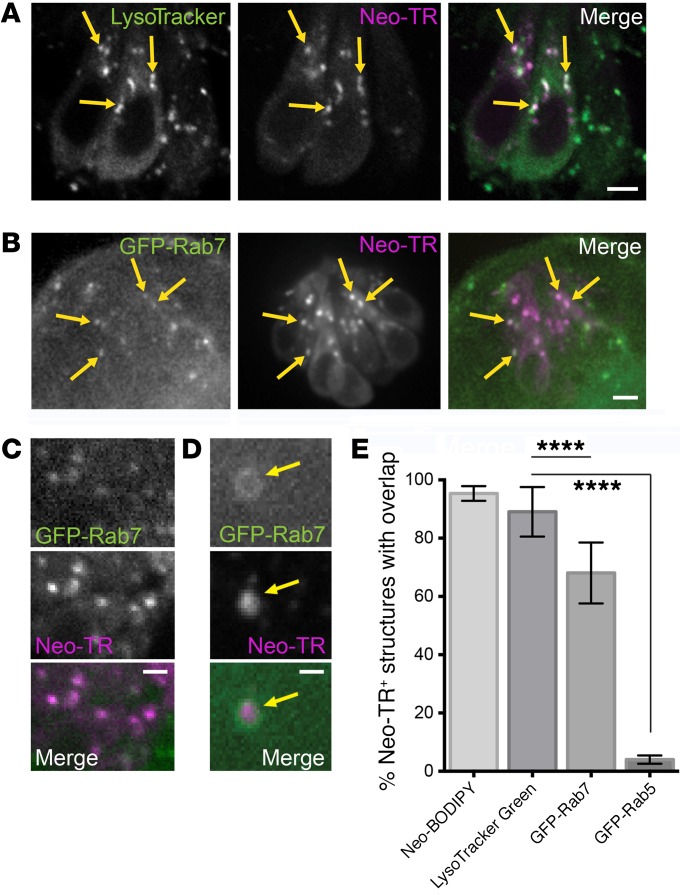
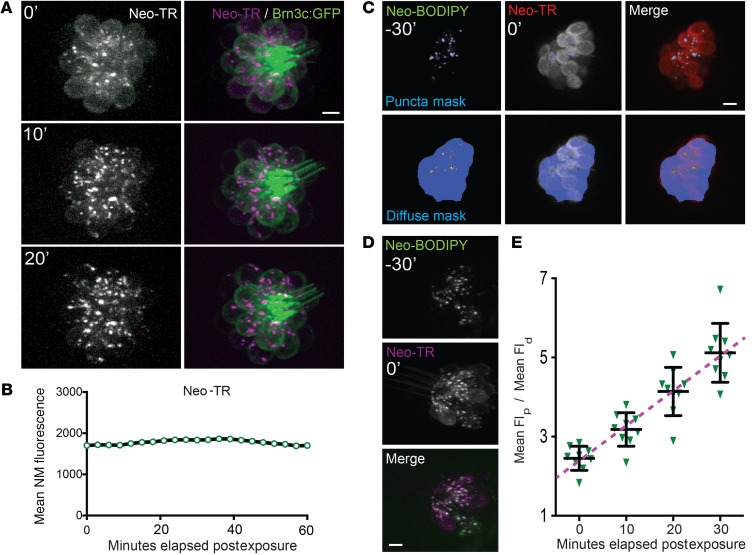
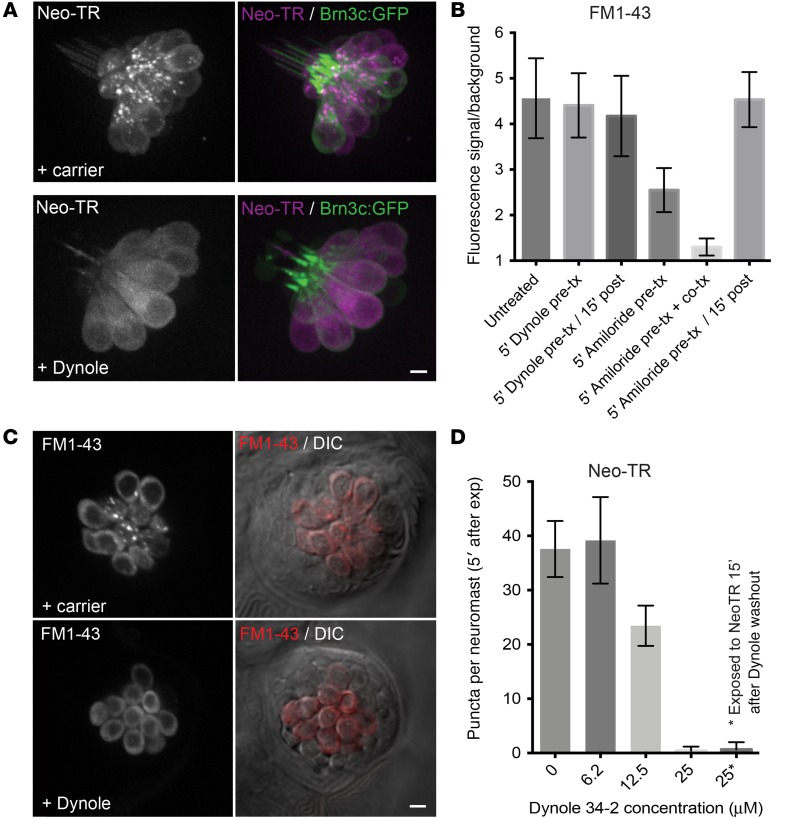
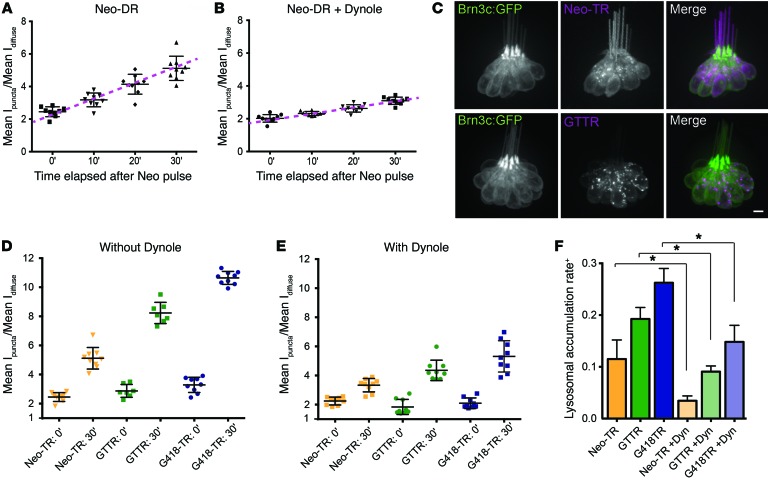
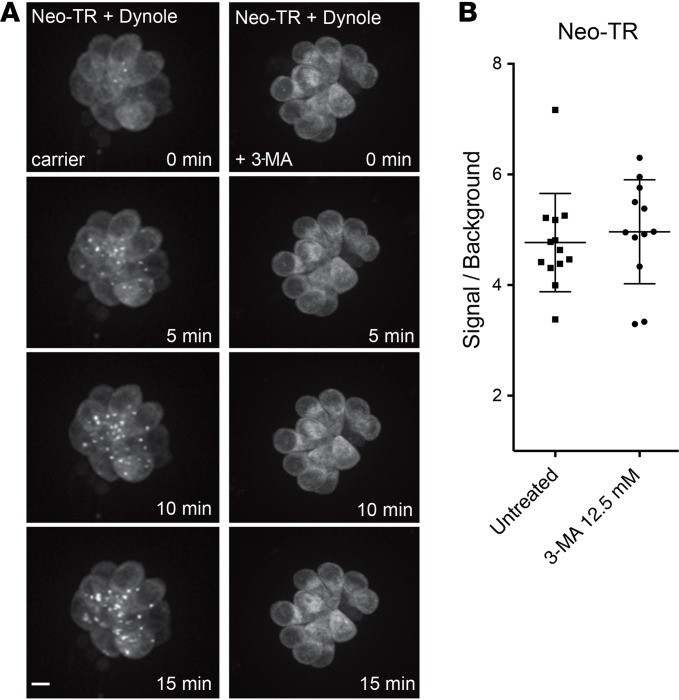
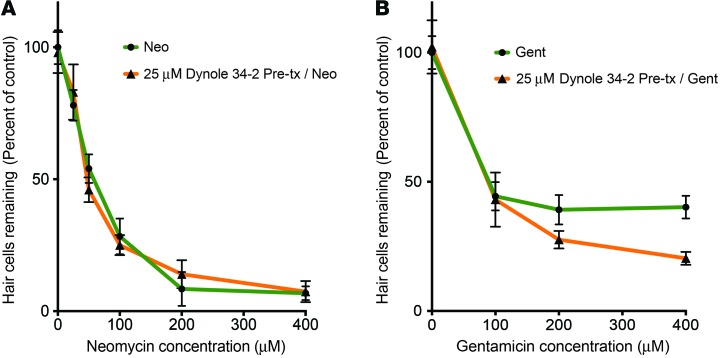
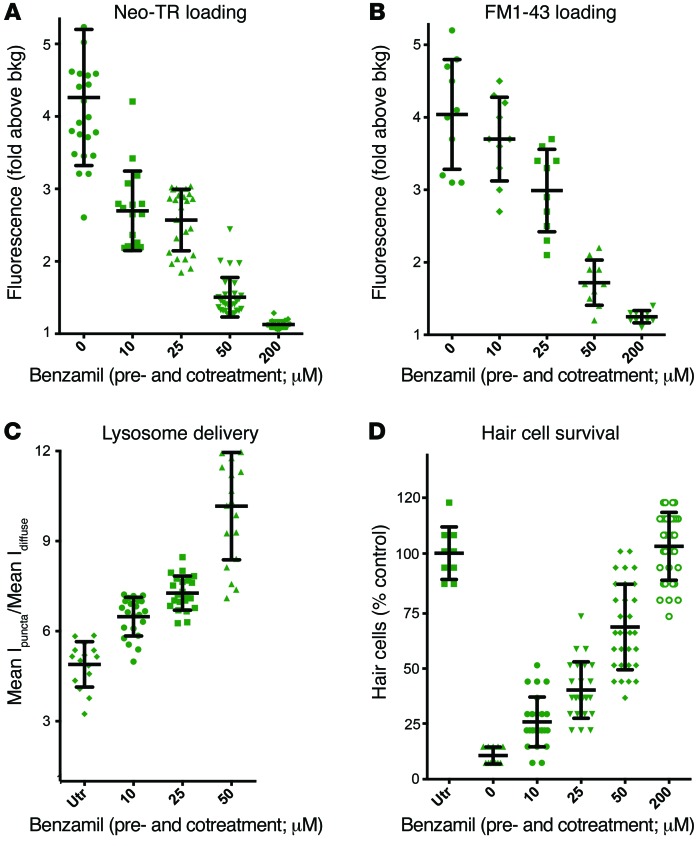
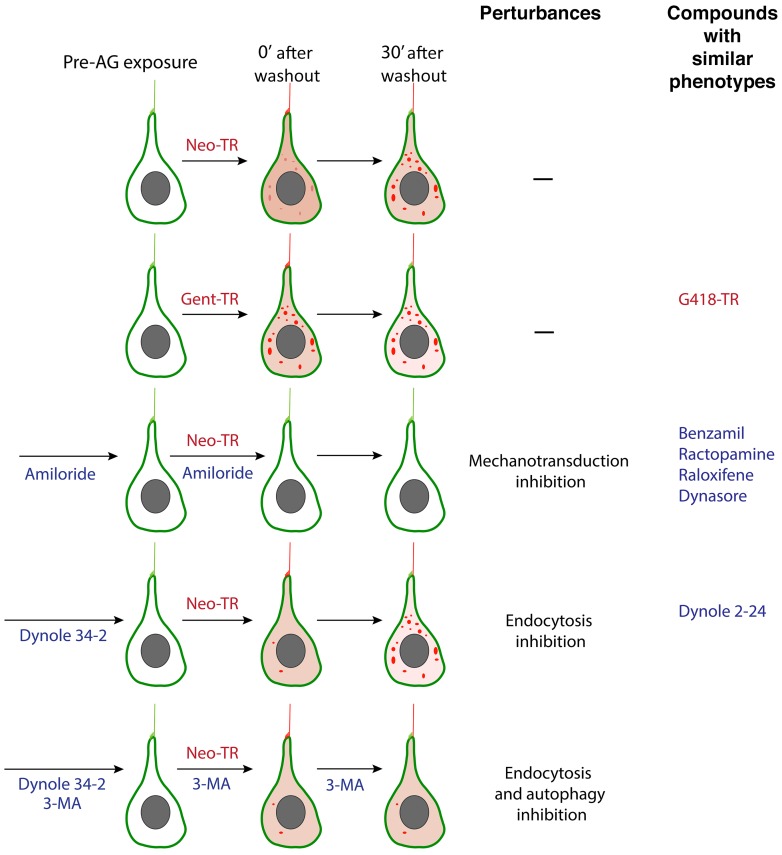
Aminoglycosides (AGs) are broad-spectrum antibiotics that are associated with kidney damage, balance disorders, and permanent hearing loss. This damage occurs primarily by killing of proximal tubule kidney cells and mechanosensory hair cells, though the mechanisms underlying cell death are not clear. Imaging molecules of interest in living cells can elucidate how molecules enter cells, traverse intracellular compartments, and interact with sites of activity. Here, we have imaged fluorescently labeled AGs in live zebrafish mechanosensory hair cells. We determined that AGs enter hair cells via both nonendocytic and endocytic pathways. Both routes deliver AGs from the extracellular space to lysosomes, and structural differences between AGs alter the efficiency of this delivery. AGs with slower delivery to lysosomes were immediately toxic to hair cells, and impeding lysosome delivery increased AG-induced death. Therefore, pro-death cascades induced at early time points of AG exposure do not appear to derive from the lysosome. Our findings help clarify how AGs induce hair cell death and reveal properties that predict toxicity. Establishing signatures for AG toxicity may enable more efficient evaluation of AG treatment paradigms and structural modifications to reduce hair cell damage. Further, this work demonstrates how following fluorescently labeled drugs at high resolution in living cells can reveal important details about how drugs of interest behave.


Conflict of interest statement

The authors have declared that no conflict of interest exists.

Figures

Figure 1
Figure 1. Fluorescently labeled AGs are effective proxies for unlabeled AGs.
(A) Dose-response functions for gentamicin and Gent-TR. Zebrafish 5 days after fertilization were treated for 30 minutes with indicated concentrations of gentamicin or Gent-TR. Following a 1-hour recovery, surviving HC nuclei were labeled with SYTOX Green (ThermoFisher) and counted. Each graphed symbol represents 5 fish, 5 neuromasts per fish. Percentages indicate HCs that survived the treatment relative to HCs present in untreated fish. (B) Dose-response functions for neomycin and Neo-TR. (As described for A.) (C) Dose-response functions for Neo-BODIPY and Neo-TR. (As described for A.) (D) Overlap of signals from AGs with structurally distinct fluorescent tags. Image of HCs pulse-labeled with a mix of 25 μM Neo-TR and 25 μM Neo-BODIPY. (E) Labeled AGs do not enter HCs that lack MET activity. Differential interference contrast and fluorescent images of a neuromast in a WT sibling (top) or a sputniktj264a (cdh23 loss-of-function mutant) zebrafish that lacks MET (bottom). Scale bars: 5 μm. Error bars for all plots: ± 1 SD.
Figure 2
Figure 2. Fluorescent neomycin preferentially enters and kills LL HCs.
(A) A neuromast in a sedated 5 days post fertilization (dpf) zebrafish imaged during chronic exposure to 50 μM Neo-TR. Neo-TR was added to the media at time 0. Neo-TR first enters the kinocilia and stereocilia (6 minutes) and subsequently the HC body in both puncta (yellow arrows) and diffuse pools (9 minutes 30 seconds). Note that non-HCs in the fish do not take up Neo-TR. HCs with high concentrations of Neo-TR show blebbing at the apical region and kinocilia (asterisks: 21 minutes 30 seconds; 28 minutes), and separation of the apical region from the HC body (bracket: 21 minutes 30 seconds). (See also Supplemental Video 3.) Scale bar: 10 μm. (B) Neo-TR time series in a brn3c-GFP transgenic zebrafish, treated as in A. The appearance of Neo-TR on the stereocilia (plus symbol) and kinocilia (asterisk) occurs nearly simultaneously and prior to detectable Neo-TR throughout the HC body (yellow arrow). Scale bar: 10 μm. (See also Supplemental Video 3.)
Figure 3
Figure 3. Small molecules and mutations protect HCs from AG exposure by affecting MET and AG loading.
(A) Example images from a Z-series showing technique to quantify AG loading. myo6-GFP zebrafish have labeled LL HCs (left panels). Otsu segmentation of the GFP signal generates an HC-specific mask (right panels). This is used to quantify the Neo-TR signal in HCs (middle left panels). Scale bar: 5 μm. (B) Diverse types of small molecules protect HCs from AG exposure by inhibiting AG entry, as is seen in the sputniktj264a and marinerty220 MET mutants. Neo-TR uptake is quantified as described in A. Each graphed symbol represents 1 fish, 5 neuromasts per fish. (C) Example images from Neo-TR pulse-labeled HCs either untreated, treated with the MET inhibitor amiloride, or treated with ractopamine. Scale bar: 5 μm. (D) The MET inhibitor amiloride impedes HC entry of the MET activity indicator FM1-43 in a dose-dependent manner. Zebrafish (5 dpf) were pretreated with amiloride at the indicated concentrations for 5 minutes, exposed to amiloride plus 500 nM FM1-43 for 5 minutes, washed 3 times, and imaged. FM1-43 fluorescence in neuromasts was quantified and expressed as signal relative to background outside HCs. (E) The dose-dependent reduction of Neo-TR loading mimics the reduction in MET activity in D. (Quantified as in D, but with 50 nM Neo-TR replacing FM1-43.) Error bars for all plots: ± 1 SD.
Figure 4
Figure 4. Fluorescent AGs label lysosomes.
(A) Neo-TR–labeled puncta in exposed HCs also label with lysosomal markers. 5 dpf zebrafish were simultaneously exposed to 50 μM Neo-TR and LysoTracker Green before washout and imaging. Most LysoTracker-positive puncta contain Neo-TR (see yellow arrows as examples). Note that some immature HCs label with LysoTracker but not appreciable Neo-TR (right cell). Scale bar: 5 μm. (B) Neo-TR puncta colocalize with a genetically encoded late endosome/lysosome marker, GFP-Rab7. Transgenic zebrafish ubiquitously expressing GFP-Rab7 were exposed to Neo-TR. Most Neo-TR–positive puncta also have accumulations of GFP-Rab7 (see yellow arrows as examples). Scale bar: 5 μm. (C) Zoom of an intracellular region of an HC with GFP-Rab7/Neo-TR double-labeled puncta. Scale bar: 3 μm. (D) Neo-TR is present in the lumen of lysosomes. In large lysosomes where the outer membrane and lumen can be resolved, GFP-Rab7 marks membranes that surround Neo-TR signal within the lumen. Scale bar: 2 μm. (E) Quantification of overlap of markers with Neo-TR signal in puncta. Neo-BODIPY and GFP-Rab5 show results of markers where there is either near-complete or near-absent overlap (error bars: ± 1 SD). Data taken from 10 neuromasts. ****P < 0.0001 based on Holm-Šidák multiple comparison analysis after Kruskal-Wallis test. (See Figure 1 and Supplemental Figure 3C for representative Neo-BODIPY and GFP-Rab5 images.)
Figure 5
Figure 5. Labeled AGs transit from the diffuse intracellular pool into lysosomes.
(A) Time-lapse imaging of Neo-TR in pulse-labeled HCs shows a progressive accumulation of Neo-TR in puncta and loss of diffuse signal in the cytosol. Redistribution is apparent within 20 minutes of exposure. Scale bar: 5 μm. (See also Supplemental Video 4.) (B) Total intracellular Neo-TR fluorescence following pulse exposure does not decrease, indicating that loss of Neo-TR signal from the cytosol is likely due to redistribution to lysosomes and not export from cells. NM, neuromast. (C) An example of image masks (in blue) used to monitor the lysosomal and cytosolic fractions of Neo-TR. Image captured immediately after Neo-TR exposure. Scale bar: 5 μm. (D) Neo-TR added 30 minutes after Neo-BODIPY pulse exposure accumulates in the Neo-BODIPY–prelabeled structures. Image captured 10 minutes after Neo-TR exposure. Scale bar: 5 μm. (E) Quantification of loading into lysosomes following a Neo-TR pulse. After 30 minutes, intensity within the lysosomal mask is approximately 5-fold higher than intensity in the cytosol. Each graphed symbol represents 1 fish, 3 neuromasts per fish. Error bars: ± 1 SD. Flp, Fluorescence in puncta; Fld, diffuse fluorescence.
Figure 6
Figure 6. Inhibiting endocytosis with Dynole prevents the rapid delivery of Neo-TR to lysosomes without affecting MET activity.
(A) HCs were exposed to Neo-TR in either the absence (top panels) or presence (bottom panels) of the dynamin inhibitor Dynole 34-2 and imaged immediately after exposure. Inhibition of dynamin activity abolishes rapid appearance of Neo-TR–labeled puncta. Scale bar: 5 μm. (B) HCs were exposed to a pulse of FM1-43 as described in Figure 3B. Treatment with Dynole 34-2 does not significantly inhibit FM1-43 loading, either immediately or 15 minutes after Dynole pulse exposure. This is in contrast to amiloride treatment, which is also reversible, unlike Dynole 34-2. Each column: 3 fish, 5 neuromasts per fish. (C) Images of HCs exposed to FM1-43 in either the absence or presence of Dynole 34-2. Like Neo-TR, the rapid appearance of FM1-43 puncta is abolished. Scale bar: 5 μm. (D) Twenty-five micromolar Dynole 34-2 is sufficient to block the appearance of almost all puncta. Note that Dynole 34-2 activity is not rapidly reversible; 15 minutes after Dynole 34-2 washout, Neo-TR still does not appear in puncta following exposure (far right bar). Error bars: ± 1 SD. Each graphed symbol represents 3 fish, 5 neuromasts per fish.
Figure 7
Figure 7. Endocytic inhibition delays lysosomal loading of 3 AGs.
(A) Quantification of Neo-TR loading into lysosomes (method described in Figure 5C). Intensity within lysosomes is initially approximately 2.5-fold higher in puncta compared with cytosol. This value increases to approximately 5-fold after 30 minutes. Error bars: ± 1 SD. Each graphed symbol in A, B, D, and E represents 1 fish, 3 neuromasts per fish. (B) HCs treated with Dynole 34-2 show reduced rates of Neo-TR delivery into lysosomes (compare with A). Error bars: ± 1 SD. (C) Images of HCs exposed to a 50-μM pulse of either Neo-TR or Gent-TR (GTTR). Compared with Neo-TR, GTTR shows more signal in puncta, and less in the cytosol. Scale bar: 5 μm. (D) Quantification of delivery of labeled neomycin, gentamicin, and G418 to lysosomes immediately after pulse exposure and 30 minutes later. Error bars: ± 1 SD. (E) HCs pretreated with Dynole 34-2 show delayed delivery of neomycin, gentamicin, and G418 to lysosomes relative to HCs not treated with Dynole. Error bars: ± 1 SD. (F) Summary plot of lysosomal loading rates for the 3 tested AGs, each with and without Dynole pretreatment. +Graphed values indicate the change in relative amount of signal in lysosomes compared with the cytosol between 0 and 30 minutes (e.g., the slopes of purple dashed lines in A and B). Error bars: ± 1 SD for 3 replicates. *P < 0.05 based on Mann-Whitney U test.
Figure 8
Figure 8. An autophagic pathway delivers Neo-TR to lysosomes and is independent of endocytosis.
(A) HCs exposed to Dynole 34-2, washed out, and then exposed to Neo-TR in the absence or presence of the macroautophagy inhibitor 3-methyladenine (3-MA). In the absence of 3-MA, Neo-TR accumulates in lysosomes less than 5 minutes after the Neo-TR pulse (left panels). 3-MA abolishes the accumulation of Neo-TR in the lysosomes of HCs pretreated with Dynole 34-2 (right panels). Scale bar: 5 μm. (B) Treatment with 3-MA does not affect loading of Neo-TR. The loss of labeling in puncta is not due to an overall reduction in Neo-TR entry. Error bars: ± 1 SD. Each graphed symbol represents 1 fish, 5 neuromasts per fish.
Figure 9
Figure 9. Inhibition of endocytosis differentially affects AG-induced HC death.
(A) Dose-response functions for 1 hour neomycin exposure with and without Dynole 34-2 pretreatment. Inhibiting endocytosis before exposure to neomycin does not significantly affect HC survival in exposed zebrafish. (B) Dose-response functions for 1 hour gentamicin exposure with and without Dynole 34-2 pretreatment. In contrast to neomycin, gentamicin toxicity is affected. At higher concentrations of gentamicin, inhibiting endocytosis increases HC death. Error bars: ± 1 SD. Each graphed symbol represent 5 fish, 5 neuromasts per fish. ANOVA P < 0.01 for significance of Dynole treatment to protection from gentamicin.
Figure 10
Figure 10. Inhibiting MET activity decreases the rate of AG loading into HCs, increases the relative amount of AGs delivered to lysosomes, and protects HCs from AG exposure.
(A) Benzamil, an inhibitor of MET, impedes entry of Neo-TR into HCs in a dose-dependent manner. Zebrafish were pre-exposed for 5 minutes to indicated concentrations of benzamil, and then cotreated with 50 μM Neo-TR for 5 minutes, washed, and imaged. Neo-TR signal was quantified as described in Figure 3A. (B) Treatment with benzamil also impedes FM1-43 entry into HCs in a dose-dependent manner, similarly to its analog amiloride, shown in Figure 3B, and consistent with its activity as a MET inhibitor. (C) The relative amount of Neo-TR loaded into lysosomes increases with increasing benzamil concentrations. Loading of Neo-TR into lysosomes was assayed as described in Figure 5C. (D) This same range of benzamil concentrations shows an increasing degree of HC protection from a 1-hour, 200-μM neomycin exposure. HC survival was assessed as described in Figure 1. Error bars: ± 1 SD. Each graphed symbol represents 1 fish, 5 neuromasts per fish.
Figure 11
Figure 11. Schematic summarizing entry and distribution of AGs in live LL HCs, and the effects of compounds that alter these processes.
AGs initially appear in the apical region, first labeling stereocilia, and kinocilia. They next appear in both diffuse and punctate intracellular pools. Different AGs exhibit different delivery rates to these different pools. When MET activity is blocked (e.g., by pretreatment and cotreatment with amiloride), all AGs fail to enter HCs. When dynamin-dependent endocytosis is inhibited (e.g., by Dynole 34-2 pretreatment), rapid delivery of AGs to the cytosol still occurs, but AG-labeled puncta are initially absent. Puncta do appear later. These late-forming puncta do not appear when both dynamin-dependent endocytosis and macroautophagy are inhibited (by pretreatment with Dynole 34-2 and pre- and cotreatment with the macroautophagy inhibitor 3-MA).

References

    1. Vakulenko SB, Mobashery S. Versatility of aminoglycosides and prospects for their future. Clin Microbiol Rev. 2003;16(3):430–450. doi: 10.1128/CMR.16.3.430-450.2003. - DOI - PMC - PubMed
    1. Polin RA, Committee on Fetus Newborn Management of neonates with suspected or proven early-onset bacterial sepsis. Pediatrics. 2012;129(5):1006–1015. doi: 10.1542/peds.2012-0541. - DOI - PubMed
    1. Falagas ME, Matthaiou DK, Bliziotis IA. The role of aminoglycosides in combination with a β-lactam for the treatment of bacterial endocarditis: a meta-analysis of comparative trials. J Antimicrob Chemother. 2006;57(4):639–647. doi: 10.1093/jac/dkl044. - DOI - PubMed
    1. Davies J, Davis BD. Misreading of ribonucleic acid code words induced by aminoglycoside antibiotics. The effect of drug concentration. J Biol Chem. 1968;243(12):3312–3316. - PubMed
    1. Cabañas MJ, Vázquez D, Modolell J. Inhibition of ribosomal translocation by aminoglycoside antibiotics. Biochem Biophys Res Commun. 1978;83(3):991–997. doi: 10.1016/0006-291X(78)91493-6. - DOI - PubMed

MeSH terms