. 2017 Feb;20(2):176-188.
doi: 10.1038/nn.4462. Epub 2016 Dec 19.

Molecular interrogation of hypothalamic organization reveals distinct dopamine neuronal subtypes

Affiliations

Molecular interrogation of hypothalamic organization reveals distinct dopamine neuronal subtypes

Roman A Romanov et al. Nat Neurosci. 2017 Feb.

Abstract

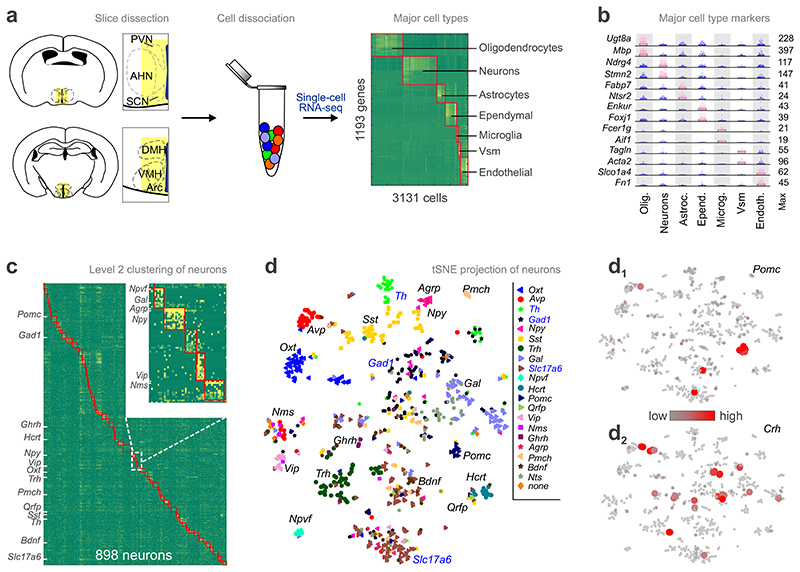
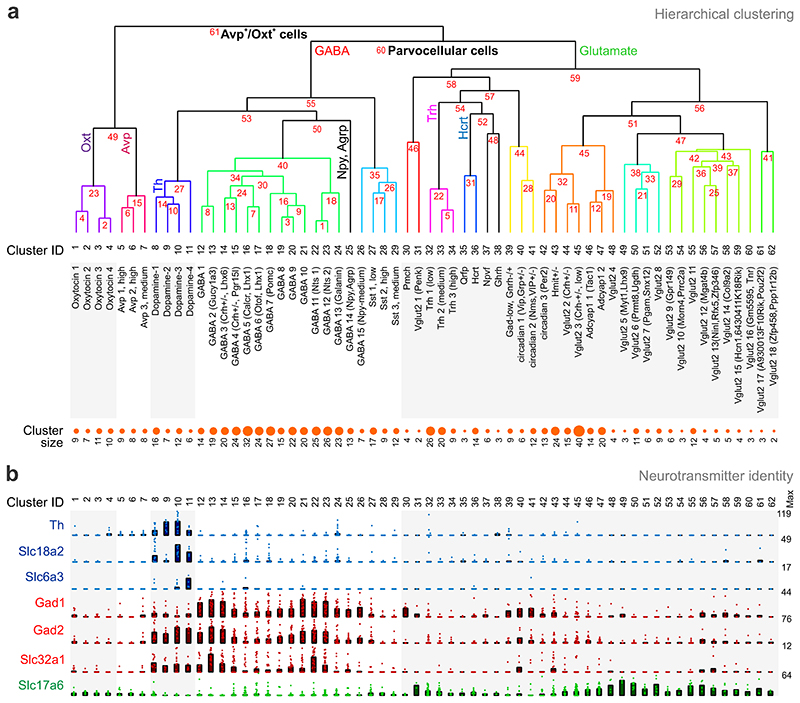
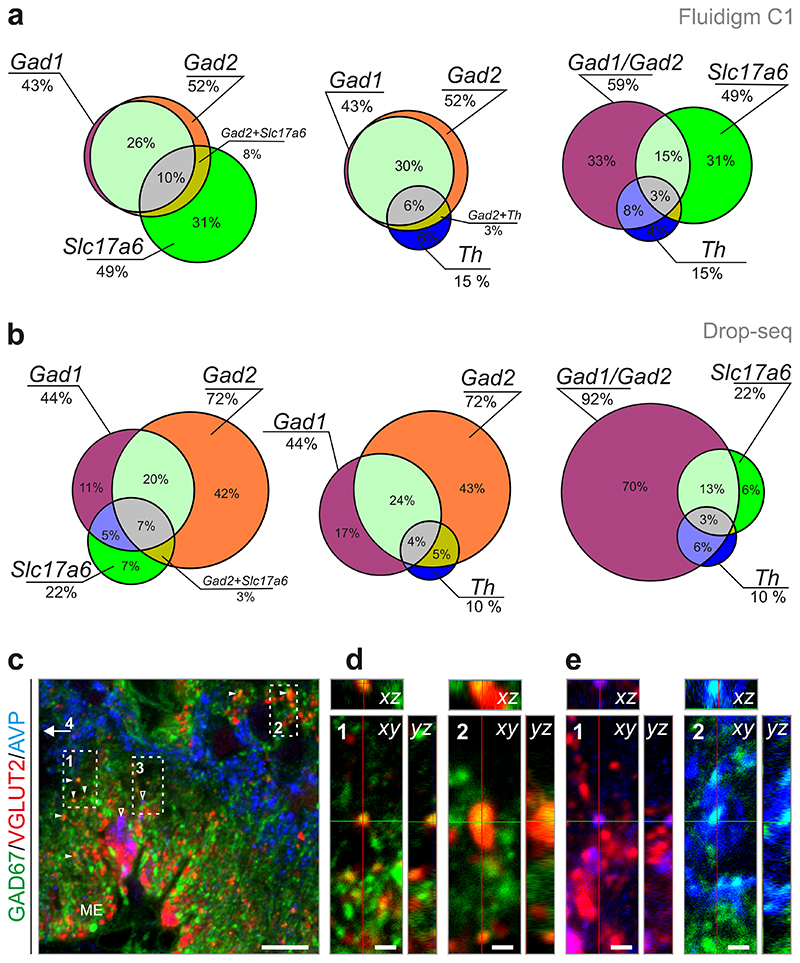
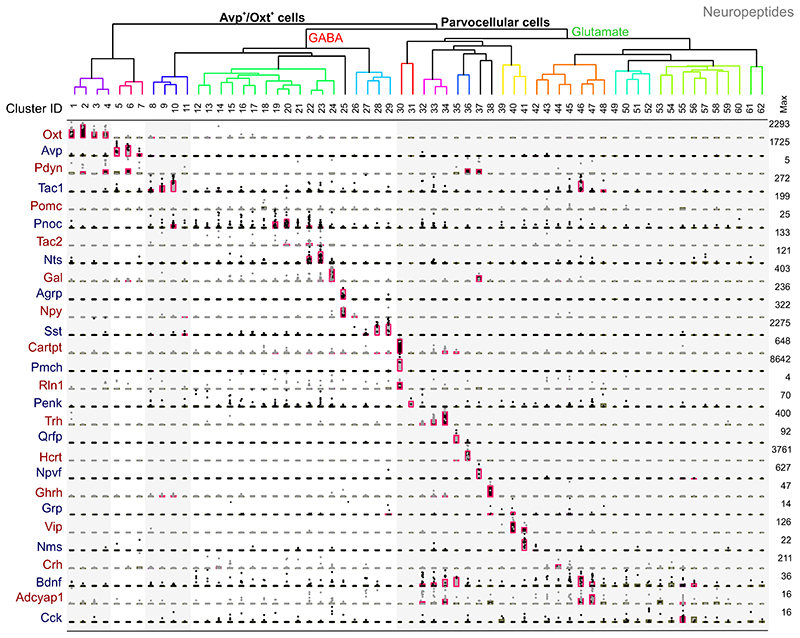
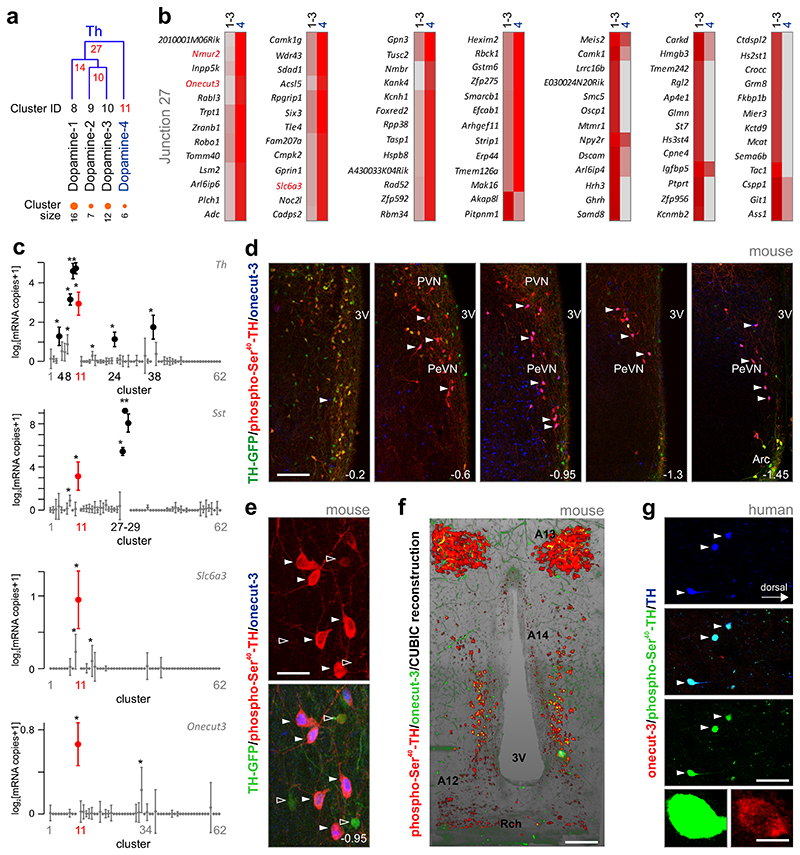
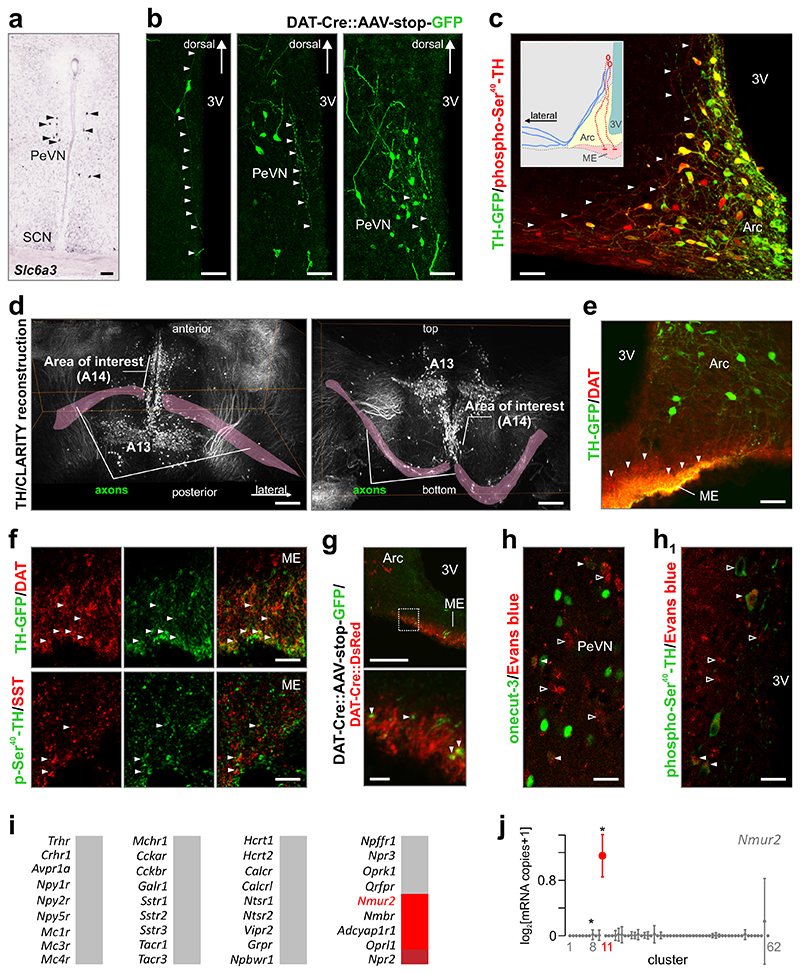
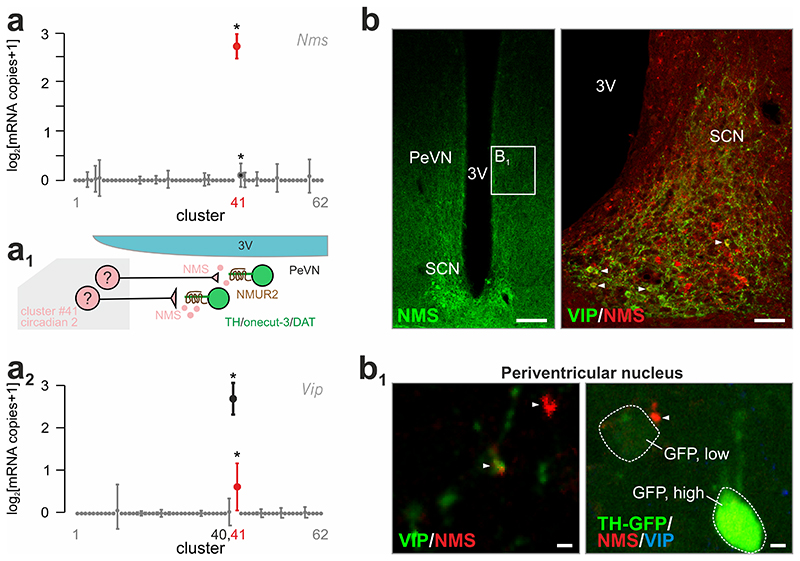
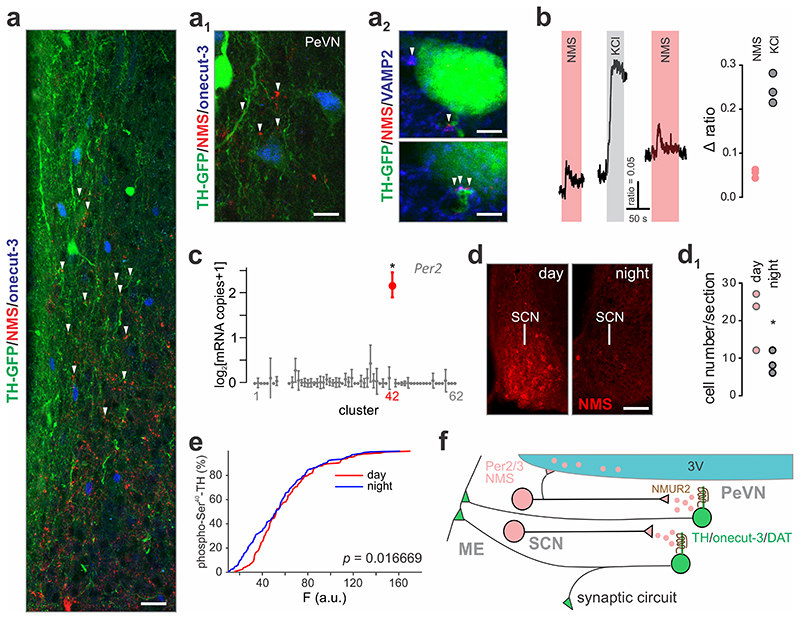
The hypothalamus contains the highest diversity of neurons in the brain. Many of these neurons can co-release neurotransmitters and neuropeptides in a use-dependent manner. Investigators have hitherto relied on candidate protein-based tools to correlate behavioral, endocrine and gender traits with hypothalamic neuron identity. Here we map neuronal identities in the hypothalamus by single-cell RNA sequencing. We distinguished 62 neuronal subtypes producing glutamatergic, dopaminergic or GABAergic markers for synaptic neurotransmission and harboring the ability to engage in task-dependent neurotransmitter switching. We identified dopamine neurons that uniquely coexpress the Onecut3 and Nmur2 genes, and placed these in the periventricular nucleus with many synaptic afferents arising from neuromedin S+ neurons of the suprachiasmatic nucleus. These neuroendocrine dopamine cells may contribute to the dopaminergic inhibition of prolactin secretion diurnally, as their neuromedin S+ inputs originate from neurons expressing Per2 and Per3 and their tyrosine hydroxylase phosphorylation is regulated in a circadian fashion. Overall, our catalog of neuronal subclasses provides new understanding of hypothalamic organization and function.


Conflict of interest statement

Competing Financial Interests Statement

T.Ha. declares support from GW Pharmaceuticals on projects unrelated to the focus of this report. All other authors report no conflict of interest.

Figures

Fig. 1
Fig. 1. Cell-type diversity in the mouse hypothalamus.
(a) Workflow diagram to indiscriminately obtain intact single cells from the juvenile mouse hypothalamus and analyze them without selection. A central vertical column spanning the preoptic area and arcuate nucleus in its rostrocaudal extent (yellow shading) was dissected, enzymatically dissociated and processed for single-cell RNA-seq. Molecule counts from 3131 cells were first clustered to define main cell types. Heat-map shows blocks of genes enriched in each cell type. (b) mRNA transcripts specifying each of the 7 major cell types. Dot density plots depict means (bars) and individual values (circles). mRNA expression of selected known and novel markers. A marker pair is shown per class including a generally accepted and a lesser-known gene. Abbreviations: Astroc., astrocytes; Epend., ependymal cells; Microg., microglia; Olig., oligodendrocytes; Vsm, vascular and smooth muscle lineage; Endoth., endothelial cells. (c) Clustering of 898 neurons reveals unprecedented molecular diversity. Heat-map shows clustering results with blocks of clusters aligned along the diagonal axis and boxed in orange. Abbreviations in inset denote subtype-specific neuropeptides and hormones. (d) Visualization of hypothalamic neuron subtypes on a two-dimensional map using tSNE (1,194 genes, perplexity = 5, 200 principle components; see also Supplementary Figs. 3,4). Neurons were color-coded by highest expression of well-known, cluster-defining hypothalamic markers. (d1) Pomc mRNA expression is an example of phenotypic clustering on the same tSNE plot. (d2) In contrast, Crh is heterogeneously distributed on the tSNE scaffold, precluding its use to typify neurons. Abbreviations in (c,d): Agrp, agouti-related peptide; Avp, arginine-vasopressin; Bdnf, brain-derived neurotrophic factor; Gad1, glutamate decarboxylase 1; Gal, galanin; Ghrh, gonadotropin-releasing hormone; Hcrt, hypocretin; Nms, neuromedin S; Npvf, neuropeptide VF precursor; Npy, neuropeptide Y; Oxt, oxytocin; Pmch, pro-melanin-concentrating hormone; Pomc, pro-opiomelanocortin; Qrfp, RF(Arg-Phe)amide family 26 amino acid peptide; Slc17a6, vesicular glutamate transporter 2; Sst, somatostatin; Th, tyrosine hydroxylase; Trh, thyrotropin-releasing hormone; Vip, vasoactive intestinal polypeptide.
Fig. 2
Fig. 2. Hierarchical clustering of hypothalamic neuron subtypes.
(a) Classification of 62 neuronal subtypes as defined by unique molecular fingerprints (i.e. top five genes). Numbers in red indicate divergence points defined by the BackSpinV2 algorithm. We adopted a terminology that relies on neurotransmitter and subtype-specific gene sets. Cluster size indicates the number of neurons assigned to a specific subtype. (b) Neurotransmitter specificity in each neuronal subtype was defined by their expression of tyrosine hydroxylase (Th), vesicular monoamine transporter 2 (Slc18a2) and dopamine transporter 1 (Slc6a3) for dopaminergic neurons, glutamate decarboxylase 1 and 2 (Gad1/2) and vesicular GABA transporter (Slc32a1) for GABAergic neurons, and vesicular glutamate transporter 2 (Slc17a6) for glutamatergic neurons. Note the existence of dual neurotransmitter phenotypes. Dot density plots show mean expression per cluster × percentage of cells (bars), and individual values (circles). Numbers to the right indicate the maximum number of molecules for each gene, thus providing ranges from 0-to-maximum value.
Fig. 3
Fig. 3. Neurotransmitter phenotypes in hypothalamic neurons.
(a,b) Venn diagrams showing the proportion of dual and triple neuronal phenotypes in GABA/glutamate (left), GABA/dopamine (middle) and GABA/glutamate/dopamine (right) neurons after Fluidigm C1 (a) or Drop-seq (b) sequencing. Percentage values indicate the proportion of neurons falling into groups and intersections (“dual phenotype” categories). (c-e) Histochemical validation of neurotransmitter heterogeneity in axon terminals at the median eminence (ME) showing GAD67/VGLUT2 (d) and vasopressin (AVP)/GAD67, as well as AVP/VGLUT2 co-existence. Orthogonal image stacks are shown. Scale bars = 10 μM (c), 2 μM (d,e).
Fig. 4
Fig. 4. Neuropeptide associations to individual hypothalamic neuronal subtypes.
Neuronal subtypes were clustered as in Figure 2. Vertical shaded columns denote main neuropeptide mRNA contents per neuronal subclass as in Figure 2, including level of statistical significance at q < 0.05 (pink). Dot density plots show mRNA expression levels per cell. Abbreviations: Adcyap1, adenylate cyclase activating polypeptide 1; Agrp, agouti-related peptide; Avp, arginine-vasopressin; Bdnf, brain-derived neurotrophic factor; Cartpt, cocaine and amphetamine regulated transcript prepropeptide; Cck, cholecystokinin; Crh, corticotropin-releasing hormone; Gal, galanin; Ghrh, growth hormone-releasing hormone; Grp, gastrin-releasing peptide; Hcrt, orexin/hypocretin; Nms, neuromedin S; Npvf, Neuropeptide VF precursor; Npy, neuropeptide Y; Nts, neurotensin; Oxt, oxytocin; Pdyn, prodynorphin; Penk, proenkephalin; Pmch, pro-melanin-concentrating hormone; Pomc, pro-opiomelanocortin; Pnoc; prepronociceptin; Qrfp, pyroglutamylated RFamide peptide; Rin1, Ras and Rab interactor 1; Sst, somatostatin; Tac1, substance P (tachykinin 1); Tac2, tachykinin 2; Trh, thyrotropin-releasing hormone; Vip, vasoactive intestinal polypeptide.
Fig. 5
Fig. 5. Molecular interrogation of dopamine neurons defines a onecut-3-expressing periventricular subtype.
(a) Segregation of tyrosine hydroxylase (Th)-expressing neurons into 4 subtypes, as defined by their divergent expression of top 5 genes (see also Figure 2). Note that dopamine neuron subtype #4 segregates early from the other subclasses. On the top, numbers in red indicate divergence points (junctions) defined by dendrogram construction. At the bottom, neuronal cluster sizes (number of cells) are shown. (b) Differential gene expression profile of dopamine neuron subtypes 1-3 (cumulative) vs. subtype 4. mRNA transcripts in red, including onecut-3 (Onecut3) define subclass identity. Incremental mRNA expression was color coded from grey (no detectable expression) to deep red. (c) Selective co-expression (in red) of Th, Slc6a3, onecut-3 and somatostatin in dopamine-4 subclass (cluster #11). Data are presented as ‘power 1 ‘ error-bar plots. Note that data exceeding >2x s.e.m. for Th and somatostatin in other neuronal clusters are shown in black. Statistics: *q < 0.05 (Wilcoxon rank-sum test corrected for multiple testing). (d) Distribution of phospho-Ser40-TH+/onecut-3+ neurons at select anterior-posterior coordinates (relative from Bregma ) in the hypothalamus of Th-GFP reporter mice. Note that multiple-labeled neurons concentrate (arrowheads) in the periventricular hypothalamic nucleus (PeVN). (e) High-resolution photomicrograph depicts PeVN dopamine neurons co-expressing phospho-Ser40-TH and onecut-3 (solid arrowheads) with elaborate dendrite morphologies coursing in parallel with the ventricular wall. Open arrowheads denote Th-GFP neurons not containing onecut-3 signal (see also Supplementary Fig. 7d). (f) In-plane rendering of lightsheet microscopy reconstruction of the anterior-posterior distribution of dopamine subclass 4 (yellow label) along the wall of the third ventricle (see also Supplementary Video 1 and 2). Abbreviations: A13, zona incerta dopamine neurons, A14, PeVN dopamine neurons 27, A12, arcuate nucleus dopamine neurons ; 3V, third ventricle; PVN, paraventricular nucleus, Rch, rethrochiasmatic area. (g) A molecularly equivalent dopamine neuron subclass exists in the human hypothalamus with co-existence of phospho-Ser40-TH and onecut-3. Scale bars = 300 μM (d), 160 μM (f), 70 μM (e,g), 7 μM (g, inset).
Fig. 6
Fig. 6. Efferent projections of periventricular onecut-3+ dopamine neurons.
(a) Dopamine transporter (Slc6a3) localization by in situ hybridization (www.brain-maps.org) reveals a Slc6a3+ cell cluster in the periventricular nucleus (arrows). (b) Microinjection of AAV-stop-GFP viruses into the periventricular region of Dat1-Cre mice reveals the morphology of periventricular Dat1+ neurons, including their ramifying dendrites and axons primarily running ventrally and, in some cases, laterally. (c) By exploiting the association of exceptionally high phospho-Ser40-TH expression and low GFP fluorescence to distinguish periventricular neurons (see also Supplementary Fig. 7c), their phospho-Ser40-TH+ axons (arrowheads) were confirmed to commute towards the median eminence (centrally, red in inset) as well as laterally (blue in inset). (d) Lightsheet microscopy optimized for CLARITY reconstruction of TH immunoreactivity with a focus on axons (magenta overlay) emanating from A14/A12 cells. Note that lateral projections course towards amygdaloid nuclei. Horizontal (left) and vertical (right) views are shown, revealing an axonal detour around the ventromedial and lateral hypothalamic nuclei. (e) DAT immunoreactive terminals at the median eminence (ME) of adult mice (arrowheads). (f) Co-localization of DAT, but not somatostatin (SST), and GFP fluorescence (arrowheads) at the ME in Th-GFP mice. (g) Our Dat1 -Cre::AAV-stop-GFP viral labeling approach confirmed that DAT+ terminals (arrowheads) at the ME could originate, at least in part, in the periventricular nucleus (see bottom image for high-resolution) (h,h1) Systemic Evans blue administration led to its uptake by neurons residing in the periventricular nucleus and immunoreactive for onecut-3 (H) or phospho-Ser40-TH (h1). Solid arrowheads pinpoint co-localization, while open arrowheads denote neurosecretory cells whose identity was not pursued in this study. (i) Single-cell RNA-seq analysis of the receptor repertoire of onecut-3+ dopamine neurons. Incremental mRNA expression was color coded from grey (no significant expression) to red (q < 0.05). (j) Dopamine subclass 4 (cluster #11) predominantly expresses neuromedin U receptor 2 (Nmur2). *q < 0.05 (Wilcoxon rank-sum test corrected for multiple testing). Scale bars = 180 μm (d), 100 μm (a,b,g top), 70 μm (c), 40 μm (f,h, h1), 10 μm (g bottom). Abbreviations: 3V, third ventricle; Arc, arcuate nucleus; PeVN, periventricular nucleus; SCN, suprachiasmatic nucleus.
Fig. 7
Fig. 7. Suprachiasmatic origin for neuromedin S inputs to onecut-3/Nmur2+ A14 dopamine neurons.
(a) Single-cell RNA-seq revealed highest neuromedin S (Nms) expression by cluster #41 (“circadian 2”) in the mouse hypothalamus. *q < 0.05 (Wilcoxon rank-sum test corrected for multiple testing). (a1) This ligand-receptor relationship allowed us to suggest a wiring diagram in which Nms- containing neurons of the suprachiasmatic nucleus can selectively innervate NMUR, TH, DAT and onecut-3-co-expressing periventricular dopamine neurons. (a2) Likewise, neurons in cluster #41 co-expressed vasoactive intestinal polypeptide (Vip). (b) Neuromedin S detection by histochemistry in the suprachiasmatic nucleus (SCN). Panel on the right shows neuromedin S and VIP co-existence in the SCN (solid arrowheads pointing to yellow composite color). Open rectangle denotes the general localization of images shown in B1. (b1) High-resolution analysis showed NMS+ boutons (solid arrowheads; left) in the periventricular area, which preferentially terminated in close apposition to dopamine neurons (arrowhead; right) marked by low GFP expression in Th-GFP reporter mice. Scale bars = 100 μm (b, left), 40 μm (b, right), 6 μm (b1). Abbreviations: 3V, third ventricle; PeVN, periventricular nucleus.
Fig. 8
Fig. 8. Periventricular onecut-3+ dopamine neurons respond to neuromedin S produced during light periods.
(a,a1) Immunohistochemical identification of synaptic contacts containing neuromedin S, which innervate onecut-3+ A14 neurons. (a2) VAMP2 was used as a ubiquitous presynaptic marker; perisomatic terminals are shown. (b) Bath application of 500 nM neuromedin S (NMS) leads to the generation of Ca2+ responses in a subset of periventricular TH+ cells, which was comparable to depolarization by 55 mM KCl. (c) The neuronal cluster containing neuromedin S (#42) also expresses the circadian pacemaker gene, Per2. Bold symbol denotes significant expression (> 2x s.e.m. from baseline); *q < 0.05. (d) Circadian fluctuations in neuromedin S content in the suprachiasmatic nucleus (SCN) as detected histochemically. (d1) Quantitative neuromedin S histochemistry using perisomatic fluorescence analysis on SCN neurons (n = 3 animals/group). *p < 0.05. (e) Circadian dependence of tyrosine hydroxylase phosphorylation at Ser as revealed by quantitative histochemistry (n = 4 animals/group). Cumulative distribution of function is shown. *p = 0.0167 (two-sample Kolmogorov-Smirnov test). (f) Synaptic wiring of a circadian pacemaker network regulating dopamine release from A14 neurons in the periventricular nucleus of the hypothalamus. Note that both synaptic and volume transmission mechanisms for neuromedin S modulation of dopaminergic output at the median eminence (ME) might exist. Scale bars = 20 μm (a), 10 μm (a1), 5 μm (a2, top), 3 μm (a2, bottom), 50 μm (d).

References

    1. Du Vigneaud V. Hormones of the posterior pituitary gland: oxytocin and vasopressin. Harvey lectures. 1954;50:1–26. - PubMed
    1. Clarke IJ. Hypothalamus as an endocrine organ. Comprehensive Physiology. 2015;5:217–253. - PubMed
    1. Lantos TA, Gorcs TJ, Palkovits M. Immunohistochemical mapping of neuropeptides in the premamillary region of the hypothalamus in rats. Brain research Brain research reviews. 1995;20:209–249. - PubMed
    1. Swanson LW, Kuypers HG. The paraventricular nucleus of the hypothalamus: cytoarchitectonic subdivisions and organization of projections to the pituitary, dorsal vagal complex, and spinal cord as demonstrated by retrograde fluorescence double-labeling methods. The Journal of comparative neurology. 1980;194:555–570. - PubMed
    1. Dahlstrom A, Fuxe K. Evidence for Existence of Monoamine-Containing Neurons in Central Nervous System.I. Demonstration of Monoamines in Cell Bodies of Brain Stem Neurons. Acta Physiol Scand. 1964;62:1–55. - PubMed

Publication types

MeSH terms