. 2016 Dec 19;5(12):e281.
doi: 10.1038/oncsis.2016.75.

Linking genomic reorganization to tumor initiation via the giant cell cycle

Affiliations

Linking genomic reorganization to tumor initiation via the giant cell cycle

N Niu et al. Oncogenesis. .

Abstract

To investigate the mechanisms underlying our recent paradoxical finding that mitotically incapacitated and genomically unstable polyploid giant cancer cells (PGCCs) are capable of tumor initiation, we labeled ovarian cancer cells with α-tubulin fused to green fluorescent protein, histone-2B fused to red fluorescent protein and FUCCI (fluorescent ubiquitination cell cycle indicator), and tracked the spatial and time-dependent change in spindle and chromosomal dynamics of PGCCs using live-cell fluorescence time-lapse recording. We found that single-dose (500 nm) treatment with paclitaxel paradoxically initiated endoreplication to form PGCCs after massive cell death. The resulting PGCCs continued self-renewal via endoreplication and further divided by nuclear budding or fragmentation; the small daughter nuclei then acquired cytoplasm, split off from the giant mother cells and acquired competency in mitosis. FUCCI showed that PGCCs divided via truncated endoreplication cell cycle (endocycle or endomitosis). Confocal microscopy showed that PGCCs had pronounced nuclear fragmentation and lacked expression of key mitotic proteins. PGCC-derived daughter cells were capable of long-term proliferation and acquired numerous new genome/chromosome alterations demonstrated by spectral karyotyping. These data prompt us to conceptualize a giant cell cycle composed of four distinct but overlapping phases, initiation, self-renewal, termination and stability. The giant cell cycle may represent a fundamental cellular mechanism to initiate genomic reorganization to generate new tumor-initiating cells in response to chemotherapy-induced stress and contributes to disease relapse.


Figures

Figure 1
Figure 1
Growth of PGCCs after treatment with Paclitaxel (PTX). (a) Experimental design. Hey, SKOV3 and OVCAR433 ovarian cancer cells were exposed to PTX and allowed to recover in regular medium. The experiments were conducted over 31 days following treatment with PTX. Microscopic observation, flow cytometry, single-cell time-lapse recording, daughter cell collection and SKY were performed at the time points indicated. (b) Cell viability after treatment with PTX at the indicated concentrations and recovery for 48 h in regular medium, detected by MTS. (c) Percentage of polyploid cells after treatment with PTX at the indicated concentrations and recovery for 7 days, quantified by FACS. (d) Quantization of polyploidy by PI-FACS analysis in Hey cells after treatment with 500 nm PTX. Dau, daughter. (e) Percentage of polyploid cells (red curve) and 2N cells (blue curve) in Hey cells after treatment with 500 nm PTX, quantified by PI-FACS. (f) Morphologic change in Hey cells by conventional light microscopy after treatment with 500 nm PTX. Hey cells were labeled with H2BGFP and photographed on the days when flow cytometry was performed. Bold black arrows indicate mononuclear and multinucleated PGCCs; thin black arrows indicate daughter cells. White black arrow in panel D13 indicates a PGCC going through multipolar mitosis. D, day. Bars, 50 μm.
Figure 2
Figure 2
Representative single-cell time-lapse recording of PGCC formation and budding in Hey cells with DNA labeled with H2B-mCherry and tubulin labeled with Alpha-Tubulin-EGFP. (a) Mitotic cell cycle of regular Hey cells. Shown are chromosomes (red fluorescence) and spindle (green fluorescence) in different phases, including interphase, metaphase, anaphase and telophase. (b) Endoreplication followed by multipolar mitosis to generate multinucleated PGCCs. A multipolar spindle with chromosomes aligned along metaphase plates was observed at 40:00 (hh:mm), three daughter cells were visible at 43:36 and the giant cell had fully split into three daughter cells, each with multiple nuclei, at 52:36 (recorded from day 7). (c) Budding of two nuclei (white and yellow arrows) from a multinucleated PGCC. The budded daughter cells continued bipolar or tripolar mitotic division. White circles indicate daughter cells (recorded from day 19). (d) Nuclear budding (white arrows) from a mononucleated PGCC and generation of mitosis-competent daughter cells. The daughter cells resumed mitotic division as indicated by the green-dyed spindle at 08:30 (inset). White arrows also mark other nuclear changes, including focal condensation, bulge and segregation of chromosomes from the mother nucleus in the absence of a spindle. Numbers indicate total area of mother and daughter nuclei in μm2 calculated by Axio Vision 4.0 (recorded from day 7). (e) Stochastic budding of multiple nuclei (white arrows) from one of two giant nuclei of a giant cancer cell followed by sequential budding of multiple daughter cells. One of the daughter cells was a spindle-shaped cell (yellow arrow) (recorded from day 19). (f) A PGCC with multiple nuclei divided into two daughter PGCCs via cytofission in the absence of a spindle structure, and multiple small daughter nuclei budded off from multinucleated mother PGCC. Insets, magnified view from low magnification (white arrow); budded nuclei from mother PGCC (yellow arrows, recorded from day 19). (g) Nuclear area of PGCCs before and after budding, based on 25 PGCCs. (h) Nuclear area of regular control cells, PGCCs and daughter cells based on 25 PGCCs.
Figure 3
Figure 3
Representative endoreplication in PGCCs labeled with FUCCI. (A) Schematic showing how FUCCI is used to detect cell cycle phase. Left: Levels of geminin (green curve) and Cdt1 (red curve) are plotted on the vertical axis. The different phases of the mitotic cell cycle is plotted on the horizontal axis. The color of fluorescence indicates the cell cycle phase (G1, red; S, orange/yellow; G2/early M, green; late M, colorless). Right: The endoreplication cell cycle can be truncated at any of several different phases after S. Different endoreplication cell cycles are indicated by the arrows labeled a to e. The endocycle involves oscillations between a G phase and S phase either endoS/G1 (a) or endoS/G2/G1 (b) without entering mitosis and will generate mononucleated polyploid or polytene giant cancer cells (MoNPGCC). c to e, endomitosis. The definition is broadened to include entry into mitosis but failure in all aspects of mitosis as recently described. This can involve failure of nuclear envelope breakdown but assembly of a spindle within the nucleus and segregation of sister chromatids, nuclear envelope breakdown, anaphase and/or nuclear division but not followed by cytokinesis (a: cytoplasmic mitosis). c: endoS/G2/M/G1 without nuclear membrane breakdown (NEB); d, endoS/G2/M/G1 with NEB; c and d will produce mononucleated PGCC (MoNPGCC); e. EndoS/G2/M/G1 cycle will generate multinucleated PGCC (MuNPGCC) following nuclear division. (B) Mitotic cell cycle indicated by FUCCI. G1, red; G1/S, yellow; G2, green; early M, green, ball- shaped; late M, ball-shaped, colorless; and G1, red. The typical mitotic cell cycle is G1/S/G2/M. (C) Mononucleated Hey cell before and after two rounds of endoreplication without cell division. Numbers in the first and last panels indicate total nuclear area in μm2 calculated using Axio Vision 4.0 (Zeiss, Thornwood, NY, USA). The recording PGCCs in C and D started at day 1 following paclitaxel treatment. (D) Mononucleated PGCC divided via endomitosis to generate multinucleated daughter cells that continued endocycle. (E) Pattern and lengths (mean±s.d.) of different phases of mitotic cell cycle of regular Hey and daughter cells and giant cell cycle of PGCCs, based on analysis of 25 cells.
Figure 4
Figure 4
Confocal microscopic analysis of mitotic regulatory proteins in PGCCs. (A) Confocal images of PGCCs undergoing budding in Hey cells. (Left upper image) White arrows indicate the spindle (α-tubulin); yellow arrows indicate the anaphase chromosomes (H1B) collected on the metaphase plate. (Left middle and lower images) Aurora A expression in the spindle pole (middle image) and γ-tubulin expression in centrosomes (lower image); white arrows indicate the centrosomes to which the mitotic spindle attached. (a and b) Multiple variable-sized nuclei encased within a microtubular nest (a, white arrows) with H1B expression (yellow arrow). A near-budding nucleus (b, white arrows) wrapped by tubulin (b, yellow arrow) indicated discontinuous tubulin surrounding the daughter nuclei. (c) Multiple budding nuclei (yellow arrow) broken off from a giant mother nucleus. White arrows indicate the interlaced channel on the longitudinal section through which nuclei were transported. (d) Thin-thread-like tubulin bridge (white arrow) connecting a daughter cell (yellow arrow) to a multinucleated nucleus. (e) Multiple fragmented nuclei (white arrow) connected through a thin-thread chromatin bridge (yellow arrow). (f) Overlaying of γ-tubulin with DNA staining indicates lack of centrosome-like structure. Bars, 20 μm. (B) Nuclear membrane structure in regular Hey cells (Ctrl) and a PGCC with budding (a–d). (Ctrl) Absence of a nuclear membrane in the mitotic nucleus (white arrow) and presence of a nuclear membrane in the interphase nucleus (red arrow) in regular Hey cells. (PGCC) PGCC with budding at a low magnification. The background of green H1B was adjusted to show the outline of a single PGCC. Regions a and b were magnified to show the details of chromosomal bridge composed of thread-like chromosomes and budding nuclei. (a) Inset from PGCC, region a. Fragmented nuclei within the PGCC. Red arrows, daughter nuclei with intact nuclear membrane; white arrow, semi-attached daughter nucleus with partial nuclear membrane. (b) Inset from PGCC, region b. The contour of the nuclear membrane is highlighted with anti-lamin monoclonal antibody. (c and d) Insets from panel b. Thin-thread chromatin links budding nuclei. DNAs present as thin-thread DNAs (white arrows in c and d) within cytoplasmic branch of daughter cells. Yellow arrow, daughter nucleus budded out from thin-thread DNAs covered with intact nuclear membrane. Bars, 20 μm. (C) Protein expression of cell cycle and mitotic molecules in test cells detected by western blotting. Aur-A, Aurora A; Aur-B, Aurora B; Dau, daughter cells budded off from PGCC at recovering day 28; H1.2, Histone 1.2; H1.5, Histone 1.5; PG, PGCCs at recovering day 7 following paclitaxel treatment; Reg, regular cancer cells.
Figure 5
Figure 5
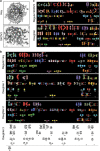
SKY analysis of regular cancer cells and PGCCs. (a) Endomitotic polyploid metaphases were found in Hey cells (upper) and SKOV3 cells (lower). (b) Difference in chromosome number between regular Hey cells and three representative daughter cells. (c) Chromosome number of regular SKOV3 and daughter cells.
Figure 6
Figure 6
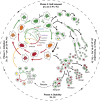
Schematic of the giant cell cycle. The mitotic cell cycle is shown in the lower left corner. In response to acute stress, massive cell death occurs, but a subset of cancer cells enters the giant cell cycle with the four phases labeled in the figure: initiation from nearly diploid (2n, 2c) to tetraploid and then polyploid (⩾4n, 4c; pn, pc), self-renewal of polyploid growth (pc, pn), termination from polyploid or tetraploid to diploid (pc, pn; 4n; 4c to 2n, 2c) and stability phase with proliferation of tumor cells via mitosis (2n, 2c). The color of fluorescence indicates the cell cycle phase (G1, red; S, orange/yellow; G2/early M, green; late M, colorless) as defined in the FUCCI experiments in Figure 3. The arrow labeled 1 indicates initiation of the endoreplication from diploid cells (2n, 2c) to become tetraploid (4n, 4c; pc, pn) after the mitosis is shut down. The other labeled arrows indicate possible outcomes after initiation of the endoreplication, as follows: 2, endomitosis to generate a multinucleated PGCC. 3, 7, and 10, continued endoreplication. 4, budding of daughter cells. 5, nuclear fission within a PGCC. 6, multipolar mitosis followed by cytofission. 8 and 9, continued fragmentation and budding of PGCC. 11, resumption of mitosis of daughter cells. 12, death from PGCC. 13, differentiation into benign stromal cells. 14, new cancer cells with newly acquired with genetic/epigenetic landscape. 15, malignant clones with potential to metastasize. 16, initiation of the giant cell cycle if cancer cells face new catastrophic event. 2n, 2c: diploid or pseudo-diploid tumor cells at the G1 phase, pn, polyploid cancer cells defined by ploidy ⩾4n, 4c at the G1 phase.

References

    1. Edgar BA, Zielke N, Gutierrez C. Endocycles: a recurrent evolutionary innovation for post-mitotic cell growth. Nat Rev Mol Cell Biol 2014; 15: 197–210. - PubMed
    1. Fox DT, Duronio RJ. Endoreplication and polyploidy: insights into development and disease. Development 2013; 140: 3–12. - PMC - PubMed
    1. Orr-Weaver TL. When bigger is better: the role of polyploidy in organogenesis. Trends Genet 2015; 31: 307–315. - PMC - PubMed
    1. Zielke N, Edgar BA, DePamphilis ML. Endoreplication. Cold Spring Harbor Perspect Biol 2013; 5: a012948. - PMC - PubMed
    1. Duncan AW, Taylor MH, Hickey RD, Hanlon Newell AE, Lenzi ML, Olson SB et al. The ploidy conveyor of mature hepatocytes as a source of genetic variation. Nature 2010; 467: 707–710. - PMC - PubMed

LinkOut - more resources