. 2017 May 25;36(21):3048-3058.
doi: 10.1038/onc.2016.458. Epub 2016 Dec 19.

Cancer-FOXP3 directly activated CCL5 to recruit FOXP3+Treg cells in pancreatic ductal adenocarcinoma

Affiliations

Cancer-FOXP3 directly activated CCL5 to recruit FOXP3+Treg cells in pancreatic ductal adenocarcinoma

X Wang et al. Oncogene. .

Abstract

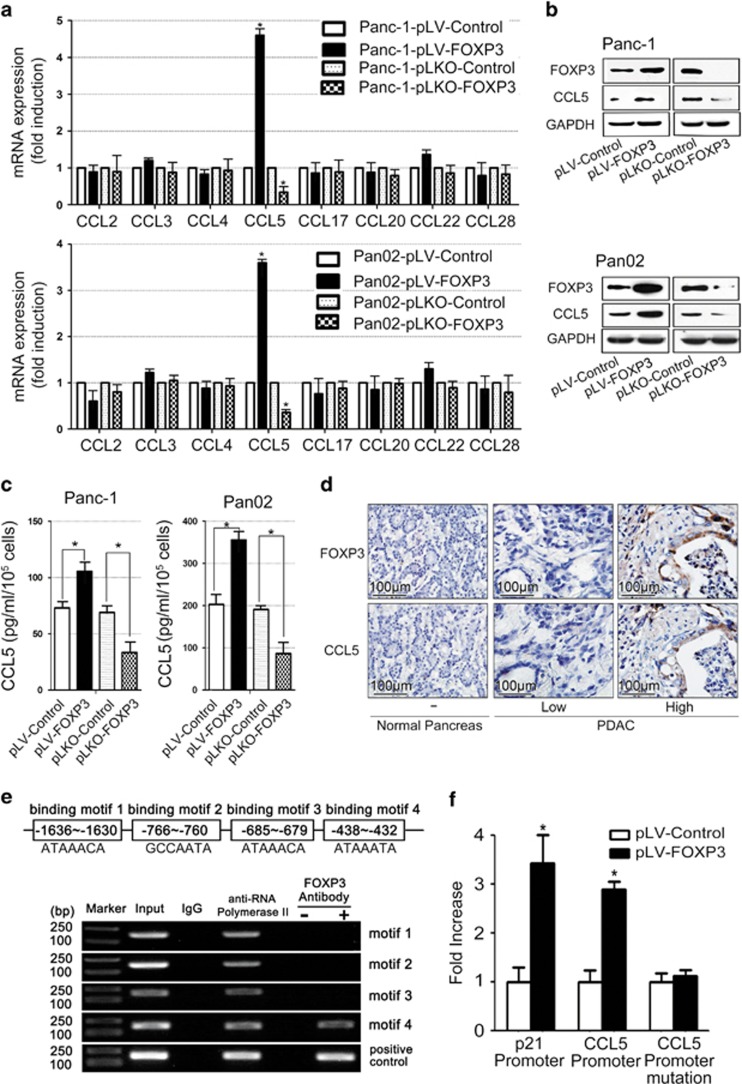
Forkheadbox protein 3 (FOXP3), initially identified as a key transcription factor for regulatory T cells (Treg cells), was also expressed in many tumors including pancreatic ductal adenocarcinoma (PDAC). However, its role in PDAC progression remains elusive. In this study, we utilized 120 PDAC tissues after radical resection to detect cancer-FOXP3 and Treg cells by immunohistochemistry and evaluated clinical and pathological features of these patients. Cancer-FOXP3 was positively correlated with Treg cells accumulation in tumor tissues derived from PDAC patients. In addition, high cancer-FOXP3 expression was associated with increased tumor volumes and poor prognosis in PDAC especially combined with high levels of Treg cells. Overexpression of cancer-FOXP3 promoted the tumor growth in immunocompetent syngeneic mice but not in immunocompromised or Treg cell-depleted mice. Furthermore, CCL5 was directly trans-activated by cancer-FOXP3 and promoted the recruitment of Treg cells from peripheral blood to the tumor site in vitro and in vivo. This finding has been further reinforced by the evidence that Treg cells recruitment by cancer-FOXP3 was impaired by neutralization of CCL5, thereby inhibiting the growth of PDAC. In conclusion, cancer-FOXP3 serves as a prognostic biomarker and a crucial determinant of immunosuppressive microenvironment via recruiting Treg cells by directly trans-activating CCL5. Therefore, cancer-FOXP3 could be used to select patients with better response to CCL5/CCR5 blockade immunotherapy.


Conflict of interest statement

The authors declare no conflict of interest.

Figures

Figure 1
Figure 1
FOXP3 protein expression in PDAC cells and the clinical outcomes. (a) Immunohistochemical profiles (hematoxylin staining) of FOXP3 in normal pancreas, serous cystadenoma, pancreatic intraepithelial neoplasia (PanIN), pancreatic neuroendocrine tumor (PNET), spleen and PDAC tissues under microscopy. Magnification: × 200. (b) Expression of FOXP3 in normal pancreas cells (N) and PDAC (T) cells (brown). Magnification: × 40 and × 200. (c, d) Kaplan–Meier OS and RFS of PDAC patients, presented as high-c-FOXP3 or low-c-FOXP3 expression groups based on the log-rank statistic test (n=76 and n=44, respectively). Final scores of c-FOXP3 expression (1–9)=intensity score (1–3) × percentage score (1–3). High-c-FOXP3 >4 and low-c-FOXP3 ⩽4.
Figure 2
Figure 2
c-FOXP3 correlates with Treg cells accumulation in PDAC microenvironment. (a) Counting FOXP3+Treg cells in PDAC microenvironment with low and high expression of c-FOXP3 protein (left). Statistical analysis of Treg cells accumulation in tumor with low and high expression of c-FOXP3 (right; n=120; **P<0.01) by Spearman's rank correlation test. High c-FOXP3 >4, low c-FOXP3 ⩽4. High Treg group ⩾10 Treg cells/high-power field (HPF), low Treg group <10 Treg cells/HPF). Magnification: × 200. (b) Immunofluorescence staining of FOXP3 expression and Treg cells accumulation in tumor tissues from fresh surgical samples (n=10). Magnification: × 200. (c) Flow cytometry analysis of Treg cells accumulation of the same samples. Summary data were shown below (mean±s.e.m., *P<0.05). (d) Kaplan–Meier OS and RFS for different levels of Treg cells accumulation with high c-FOXP3 expression based on the log-rank statistic test (P=0.01, P=0.03, respectively).
Figure 3
Figure 3
c-FOXP3 affecting tumor size in PDAC involves Treg cells accumulation. (a) The real distribution of primary tumor size (T) between c-FOXP3 high and low expression groups (n=120, *P<0.05 by χ2 test. T: T1, tumor limited to the pancreas, 2 cm or less in greatest dimension. T2, tumor limited to the pancreas, >2 cm in greatest dimension. T3, Tumor extends beyond the pancreas but without involvement of the celiac axis or the superior mesenteric artery. (b) Experimental scheme for subcutaneous carcinoma model of C57BL/6 mice (top). Tumor volumes and weights for both groups of C57BL/6 mice (bottom). Pan02-pLKO-Control, n=8; Pan02-pLKO-FOXP3, n=8; *P<0.05 by paired Student's t-test. (c) IHC staining of FOXP3 and Ki67 in both groups of tumor sections. Magnification: × 200. (d) Flow cytometry analysis of Treg cells accumulation in the tumor microenvironment of C57BL/6 murine model. Representative results were shown (left). Summary data were provided for each group except one undetectable because of operational factors (right, *P<0.05 by paired Student's t-test). (e) Summary data of flow cytometry analysis of CD8+T cells percentage and apoptotic CD8+T cells in the tumor microenvironment of C57BL/6 murine model (**P<0.01 by paired Student's t-test). (f) Experimental scheme for subcutaneous carcinoma model of C57BL/6 mice: CD25 antibody was injected at days -2, 1 and 21 intravenously. Tumor volume and weight of the C57BL/6 mice for both groups. (P>0.05 by paired Student's t-test). (g) The distribution of the primary tumor size (T) among three c-FOXP3/Treg cells groups (only four cases exhibit low c-FOXP3/high Treg cells and fail to make statistical analysis. n=116, **P=0.001 by χ2 test).
Figure 4
Figure 4
c-FOXP3 recruits Treg cells in vitro and in vivo. (a) FACS analysis of Treg cells recruitment by FOXP3 overexpressed Panc-1, BxPC-3, and AsPC-1 cells for 24- h relative to empty vector-transfected cells, and Treg cells recruitment by FOXP3-interfered Panc-1, BxPC-3 and MIA PaCa-2 cells for 24- h relative to control groups. Representative results were shown. (b) Percentage of recruited CD4+CD25+FOXP3+Treg cells from peripheral blood mononuclear cells (PBMCs; mean±s.e.m., n=5; *P<0.05 by Student's t-test). (c) Total numbers of recruited Treg cells from PBMCs (mean±s.e.m., n=5; *P<0.05 by Student's t-test). (d) Experimental scheme for orthotropic pancreatic carcinoma model: mice were divided into two groups (n=5 per group). One was implanted with Panc-1-pLV-Control cells and the other was implanted with Panc-1-pLV-FOXP3 cells. Both groups received human PBMCs injection on days 1, 8, 15, 22, 29 and 36 through tail vein. Tumors were harvested at the sixth week. (e) FACS analysis of Treg cells recruitment into tumor microenvironment of both groups was measured. Representative results were shown; (mean±s.e.m., n=5; *P<0.05 by Student's t-test).
Figure 5
Figure 5
c-FOXP3 directly activates CCL5 expression. (a) The mRNA level of CCL2, CCL3, CCL4, CCL5, CCL17, CCL20, CCL22 and CCL28 were measured by real-time–PCR (mean±s.e.m., n=3; *P<0.05 compared with Control, by Student's t-test). (b) The protein level of c-FOXP3 and CCL5 in Panc-1 and Pan02 were detected by western blotting. (c) The secretion of CCL5 in the supernatant was detected by enzyme-linked immunosorbent assay (ELISA; mean±s.e.m., n=3; *P<0.05 compared with Control, by Student's t-test). (d) c-FOXP3 and CCL5 expression in both normal pancreas and PDAC by immunohistochemistry. Magnification: × 200. (e) Specificity of the ChIP assay. Human CCL5 gene, including the FOXP3-binding motif 1–4 (upper). Binding of FOXP3 and CCL5 promoter was observed at motif-4. p21 was used as positive control (down). (f) The Panc-1 cells were transfected with either vector control or FOXP3 in conjunction with the luciferase reporter pGL3-CCL5-promoter (motif-4 WT) or pGL3-CCL5-promoter (motif-4MUT) vectors. pGL3-p21-promoter was used as positive control. After 48  hours, firefly and renilla luciferase activities were measured using the Dual-Luciferase Reporter assay (Promega, Madison, WI, USA) and the ratio was determined (*P<0.05, by Student's t-test). The experiment was performed in triplicate and repeated three times with the same results.
Figure 6
Figure 6
CCL5 is involved in the recruitment of Treg cells by c-FOXP3 in vitro and in vivo. (a) FACS analysis. Treg cells recruitment by Foxp3-overexpressed Panc-1 and AsPC-1 cell lines with the CCL5 neutralized antibody for 24-h relative to those with IgG. Treg cells recruitment by Foxp3 knockdown MIA PaCa-2 and BxPC-3 cell lines treated with recombinant CCL5 for 24-h relative to those with IgG. Percentages of recruited Treg cells from peripheral blood mononuclear cells (PBMCs) were shown (mean±s.e.m., n=3; *P<0.05 by Student's t-test). (b) The cell count of the recruited Treg cells (mean±s.e.m., n=5; *P<0.05 by Student's t-test). (c) Experimental scheme for subcutaneous carcinoma model of C57BL/6 mice: CCL5 antibody or isotype IgG was injected intratumoral (20 μg per mouse, twice a week). (d, e) FACS analysis of Treg cells recruitment into tumor microenvironment of the four groups was measured. Inhibition rate=(IgG-CCL5Ab) group/IgG group. (f) FACS analysis of CD8+T cells apoptosis in tumor microenvironment of the four groups was measured. (g) Tumor growth was evaluated by measuring tumor volumes and growth inhibition rate, and compared by one-way analysis of variance with Bonferroni post-hoc test (**P<0.01). Inhibition rate=(IgG-CCL5Ab) group/IgG group.

References

    1. Siegel RL, Miller KD, Jemal A. Cancer statistics, 2015. CA Cancer J Clin 2015; 65: 5–29. - PubMed
    1. Foley K, Kim V, Jaffee E, Zheng L. Current progress in immunotherapy for pancreatic cancer. Cancer Lett 2016; 381: 244–251. - PMC - PubMed
    1. Jacobs JF, Punt CJ, Lesterhuis WJ, Sutmuller RP, Brouwer HM, Scharenborg NM et al. Dendritic cell vaccination in combination with anti-CD25 monoclonal antibody treatment: a phase I/II study in metastatic melanoma patients. Clin Cancer Res 2010; 16: 5067–5078. - PubMed
    1. Generali D, Bates G, Berruti A, Brizzi MP, Campo L, Bonardi S et al. Immunomodulation of FOXP3+ regulatory T cells by the aromatase inhibitor letrozole in breast cancer patients. Clin Cancer Res 2009; 15: 1046–1051. - PubMed
    1. Vonderheide RH, Bayne LJ. Inflammatory networks and immune surveillance of pancreatic carcinoma. Curr Opin Immunol 2013; 25: 200–205. - PMC - PubMed

Publication types

MeSH terms