. 2017 Jan/Feb;38(1):e1-e12.
doi: 10.1097/AUD.0000000000000370.

Auditory Brainstem Response Altered in Humans With Noise Exposure Despite Normal Outer Hair Cell Function

Affiliations

Auditory Brainstem Response Altered in Humans With Noise Exposure Despite Normal Outer Hair Cell Function

Naomi F Bramhall et al. Ear Hear. 2017 Jan/Feb.

Abstract

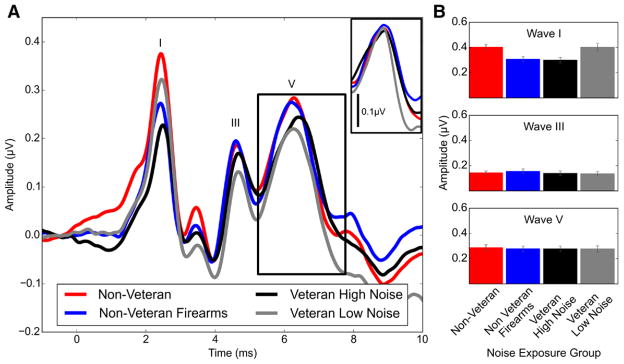
Objectives: Recent animal studies demonstrated that cochlear synaptopathy, a partial loss of inner hair cell-auditory nerve fiber synapses, can occur in response to noise exposure without any permanent auditory threshold shift. In animal models, this synaptopathy is associated with a reduction in the amplitude of wave I of the auditory brainstem response (ABR). The goal of this study was to determine whether higher lifetime noise exposure histories in young people with clinically normal pure-tone thresholds are associated with lower ABR wave I amplitudes.

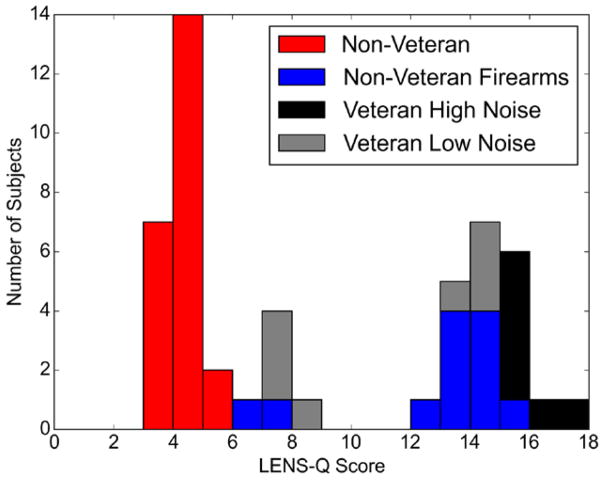
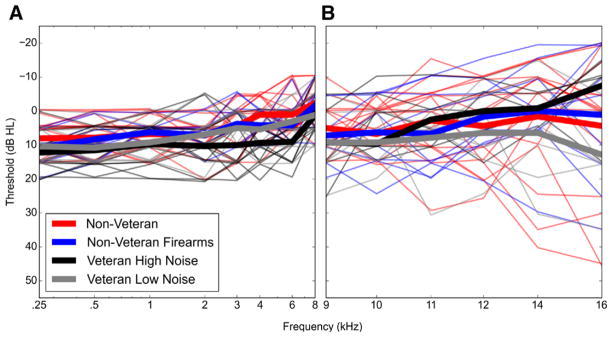
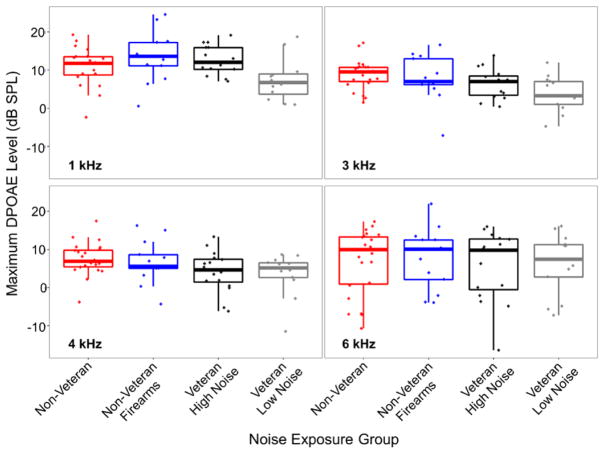
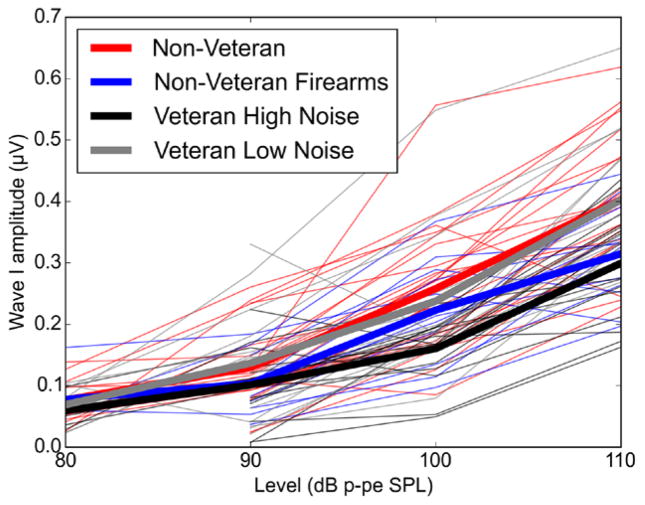
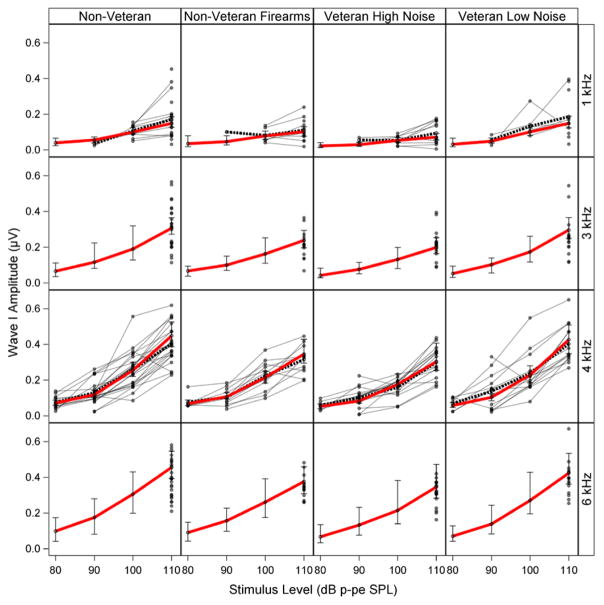
Design: Twenty-nine young military Veterans and 35 non Veterans (19 to 35 years of age) with normal pure-tone thresholds were assigned to 1 of 4 groups based on their self-reported lifetime noise exposure history and Veteran status. Suprathreshold ABR measurements in response to alternating polarity tone bursts were obtained at 1, 3, 4, and 6 kHz with gold foil tiptrode electrodes placed in the ear canal. Wave I amplitude was calculated from the difference in voltage at the positive peak and the voltage at the following negative trough. Distortion product otoacoustic emission input/output functions were collected in each participant at the same four frequencies to assess outer hair cell function.

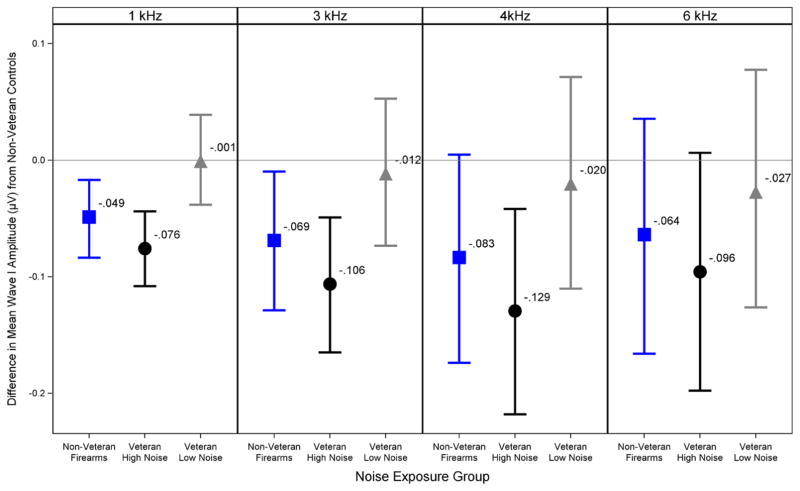
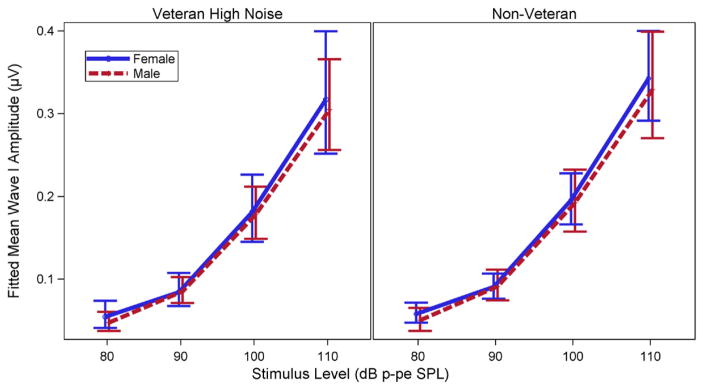
Results: After controlling for individual differences in sex and distortion product otoacoustic emission amplitude, the groups containing participants with higher reported histories of noise exposure had smaller ABR wave I amplitudes at suprathreshold levels across all four frequencies compared with the groups with less history of noise exposure.

Conclusions: Suprathreshold ABR wave I amplitudes were reduced in Veterans reporting high levels of military noise exposure and in non Veterans reporting any history of firearm use as compared with Veterans and non Veterans with lower levels of reported noise exposure history. The reduction in ABR wave I amplitude in the groups with higher levels of noise exposure cannot be accounted for by sex or variability in outer hair cell function. This change is similar to the decreased ABR wave I amplitudes observed in animal models of noise-induced cochlear synaptopathy. However, without post mortem examination of the temporal bone, no direct conclusions can be drawn concerning the presence of synaptopathy in the study groups with higher noise exposure histories.


Conflict of interest statement

The authors have no conflicts of interest to disclose.

Figures

Fig. 1
Fig. 1
Distribution of LENS-Q scores. Distribution of the LENS-Q scores shown as a stacked barplot for 50 of the 64 study participants. The distribution is broken down by noise exposure group (final group assignments were used—see “Results” section). The remaining 14 participants were categorized into a noise exposure group based on the noise exposure interview alone. Each integer increase in LENS-Q score indicates a 10-fold increase in lifetime noise exposure. Note that the bars in this plot are stacked (e.g., 3 participants from the Veteran Low Noise group had LENS-Q scores of 7 to 8). LENS-Q indicates Lifetime Exposure of Noise and Solvents Questionnaire.
Fig. 2
Fig. 2
Audiometric pure-tone thresholds by noise exposure group. No systematic differences in pure-tone thresholds were observed between noise exposure groups. Audiometric pure-tone thresholds for the test ear are shown for individual study participants (thin lines), as well as the mean thresholds for each exposure group (thick lines). Color indicates the noise exposure group. Pure-tone thresholds were measured for all participants from 0.25 to 8 kHz (A) and in 38 participants from 9 to 16 kHz (B).
Fig. 3
Fig. 3
Maximum DPOAE levels across noise exposure group and frequency. DPOAE levels were similar across noise exposure groups. Maximum DPOAE levels were obtained from I/O functions at 1, 3, 4, and 6 kHz. In these boxplots, the line in the middle of the box represents the median value, the bottom and top of the box represent the 1st and 3rd quartile, respectively, and the end of the whiskers indicate the points furthest from the box that still fall within 1.5 interquartile ranges from the edge of the box. The dots indicate the maximum DPOAE level for each participant. DPOAE indicates distortion product otoacoustic emission; I/O, input/output.
Fig. 4
Fig. 4
Mean ABR waveforms and peak amplitudes by noise exposure group. ABR wave I amplitude was reduced in the Veteran High Noise and non Veteran Firearms groups compared with the non Veteran control and Veteran Low Noise groups, while waves III and V were similar across groups. A, Waveforms were generated in response to a 110 dB p-pe SPL 4 kHz toneburst and averaged across all participants in each group. The peaks of waves I, III, and V are labeled. The inset shows the average wave V peak after correcting for variability in peak latency across participants. B, Wave amplitudes were measured from responses to a 110 dB p-pe SPL 4 kHz toneburst and then averaged across groups. Wave I and III amplitudes were measured as the difference in voltage between the wave peak and the following trough. Due to difficulty identifying the wave V trough in some participants, wave V amplitude was measured as the voltage difference between the wave V peak and the prestimulus baseline (average voltage measured for the 1-msec period of time before the stimulus presentation). Error bars indicate the standard error of the mean. ABR indicates auditory brainstem response.
Fig. 5
Fig. 5
ABR input/output functions across noise exposure group. At higher stimulus levels, the Veteran High Noise and the non Veteran Firearms groups show reduced ABR wave I amplitude compared with the groups with less noise exposure history. I/O functions are shown for a 110 dB p-pe SPL 4 kHz stimulus. The thin lines represent wave I amplitudes for individual participants, color-coded by noise exposure group, while the thick lines show mean values for each group. For some participants, wave I could not be identified at 80 dB p-pe SPL, resulting in less data at that level. ABR indicates auditory brainstem response; I/O, input/output.
Fig. 6
Fig. 6
Fit of Bayesian regression model to study data. The fitted mean wave I amplitudes generated by the regression model show a good fit to the measured data across frequency and level. The fitted model is shown with a red line. The gray lines and circles indicate the measured wave I amplitudes for each participant. The black dashed line connects the sample mean wave I amplitudes at each level. The error bars are posterior 90% Bayesian confidence intervals of the fitted means. Although modeled mean wave I amplitudes are shown for all possible frequency/level combinations, no further inferences were made for frequency/level combinations where no ABR data were collected (e.g., 3 and 6 kHz for stimulus levels below 110 dB p-pe SPL). ABR indicates auditory brainstem response.
Fig. 7
Fig. 7
Modeled differences in group mean ABR wave I amplitudes. The Veteran High Noise and non Veteran Firearms groups show a reduction in predicted mean ABR wave I amplitude across frequency compared with the non Veteran control group. This plot shows group mean differences in ABR wave I amplitude after adjusting for sex and DPOAE levels by Bayesian regression. The difference in mean wave I amplitude for each noise exposure group compared with the non Veteran controls (in μV) is shown for a 110 dB p-pe SPL stimulus at each of the four tested frequencies. Values below the 0 line indicate a decrease in wave I amplitude compared with the non Veterans, while values above the line indicate an increase. Error bars show posterior 90% Bayesian confidence intervals. ABR indicates auditory brainstem response; DPOAE, distortion product otoacoustic emission.
Fig. 8
Fig. 8
Modeled mean ABR wave I amplitude I/O functions by sex. Fitted mean ABR wave I amplitude I/O functions for the Veteran High Noise and non Veteran control groups show only weak effects of sex. I/O functions predicted by the Bayesian regression model are plotted for a 4 kHz toneburst stimulus and a DPOAE maximum level at 4 kHz of 5 dB SPL. Females are indicated by the solid blue line and males by the dashed red line. Error bars indicate posterior 90% Bayesian confidence intervals. Imbalances in the number of males vs. females for each group are reflected in the width of the confidence intervals. Plotted lines for males and females are slightly shifted horizontally to prevent overlap in the plot. Actual differences in mean wave I amplitudes are very small 0.013 μV (CI = −0.047 to 0.072) greater in females than males in the Veteran High Noise group at 110 dB p-pe SPL and 0.018 μV (CI = −0.071–0.095) greater in females in the non Veteran group). ABR indicates auditory brainstem response; CI, confidence interval; DPOAE, distortion product otoacoustic emission; I/O, input/output.

References

    1. Beach EF, Gilliver M, Williams W. The NOISE (Non-occupational incidents, situations and events) database: A new research tool. Ann Leis Res. 2013;16:149–159.
    1. Berger E. Hearing protection devices. In: Berger E, Royster L, Royster J, et al., editors. The Noise Manual. Fairfax, VA: American Industrial Hygiene Association; 2003. pp. 379–454.
    1. Berger E. Noise Navigator sound level database with over 1700 measurement values. 2015 Retrieved December 2015, from http://multimedia.3m.com/mws/media/888553O/noise-navigator-sound-levelhe....
    1. Bharadwaj HM, Masud S, Mehraei G, et al. Individual differences reveal correlates of hidden hearing deficits. J Neurosci. 2015;35:2161–2172. - PMC - PubMed
    1. Bramhall N, Ong B, Ko J, et al. Speech perception ability in noise is correlated with auditory brainstem response wave I amplitude. J Am Acad Audiol. 2015;26:509–517. - PubMed

REFERENCE NOTES

    1. Griest S, Carlson K, Theodoroff S, et al. Documentation of Overall Noise and Solvent Exposures in Recently Separated Military Personnel. Poster session presented at Audiology NOW!; 2015; San Antonio, TX. 2015.