. 2017 Feb;18(2):184-195.
doi: 10.1038/ni.3644. Epub 2016 Dec 19.

The histone demethylase UTX regulates the lineage-specific epigenetic program of invariant natural killer T cells

Affiliations

The histone demethylase UTX regulates the lineage-specific epigenetic program of invariant natural killer T cells

Semir Beyaz et al. Nat Immunol. 2017 Feb.

Abstract

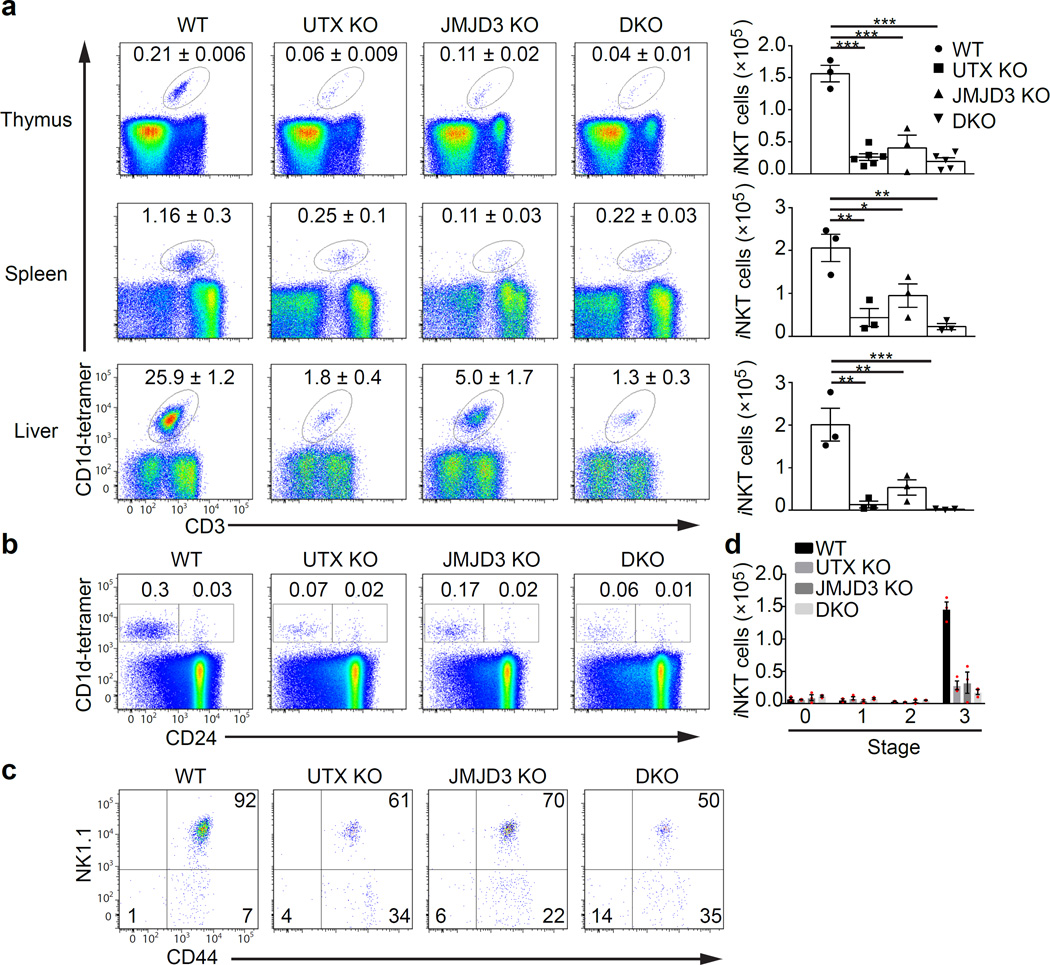
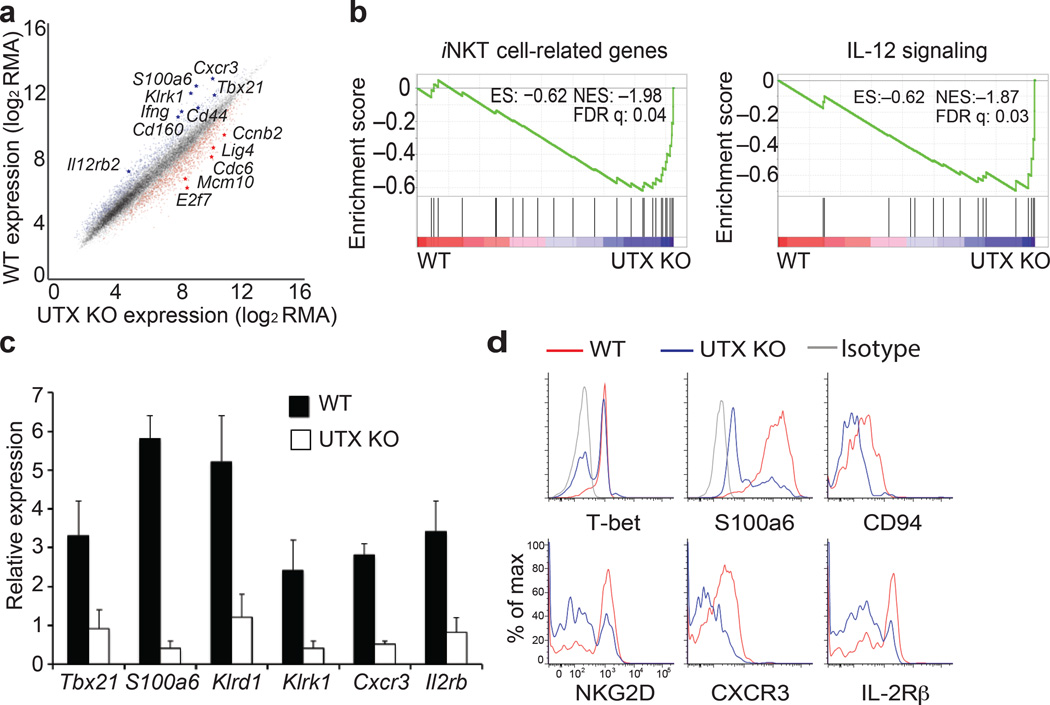
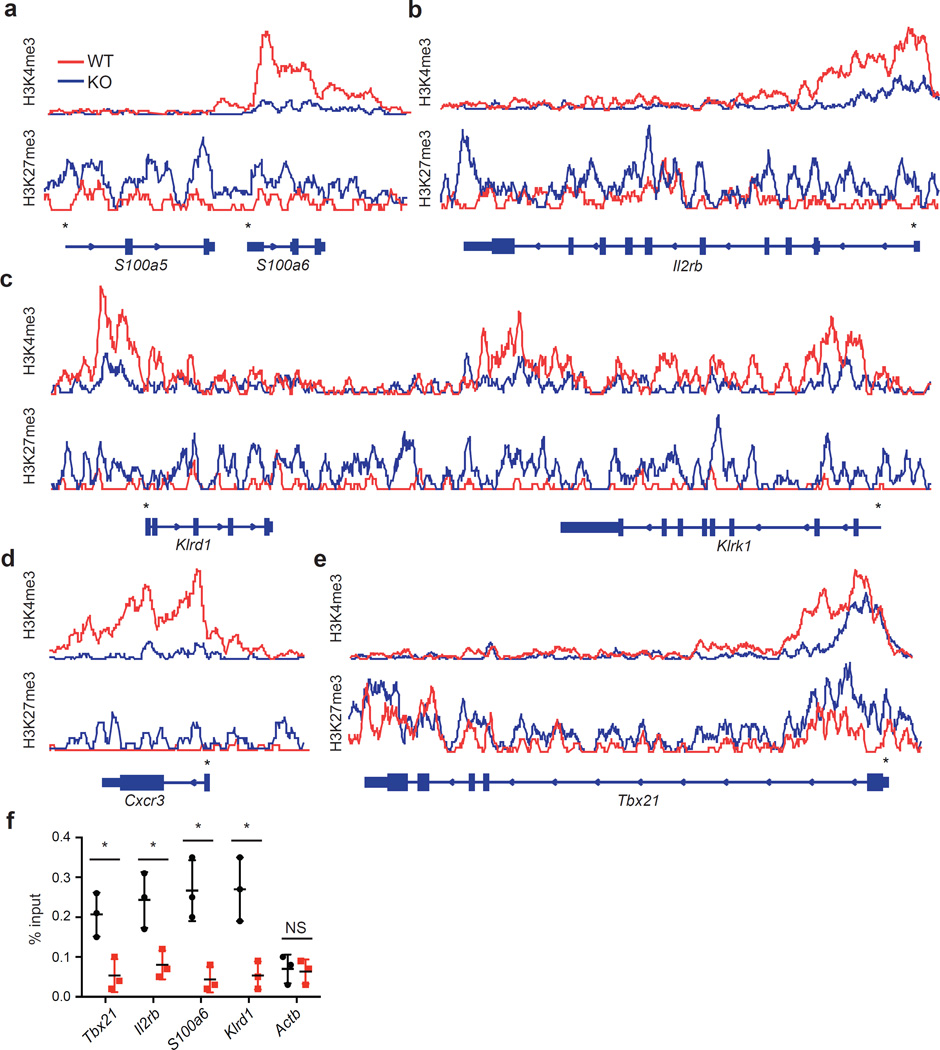
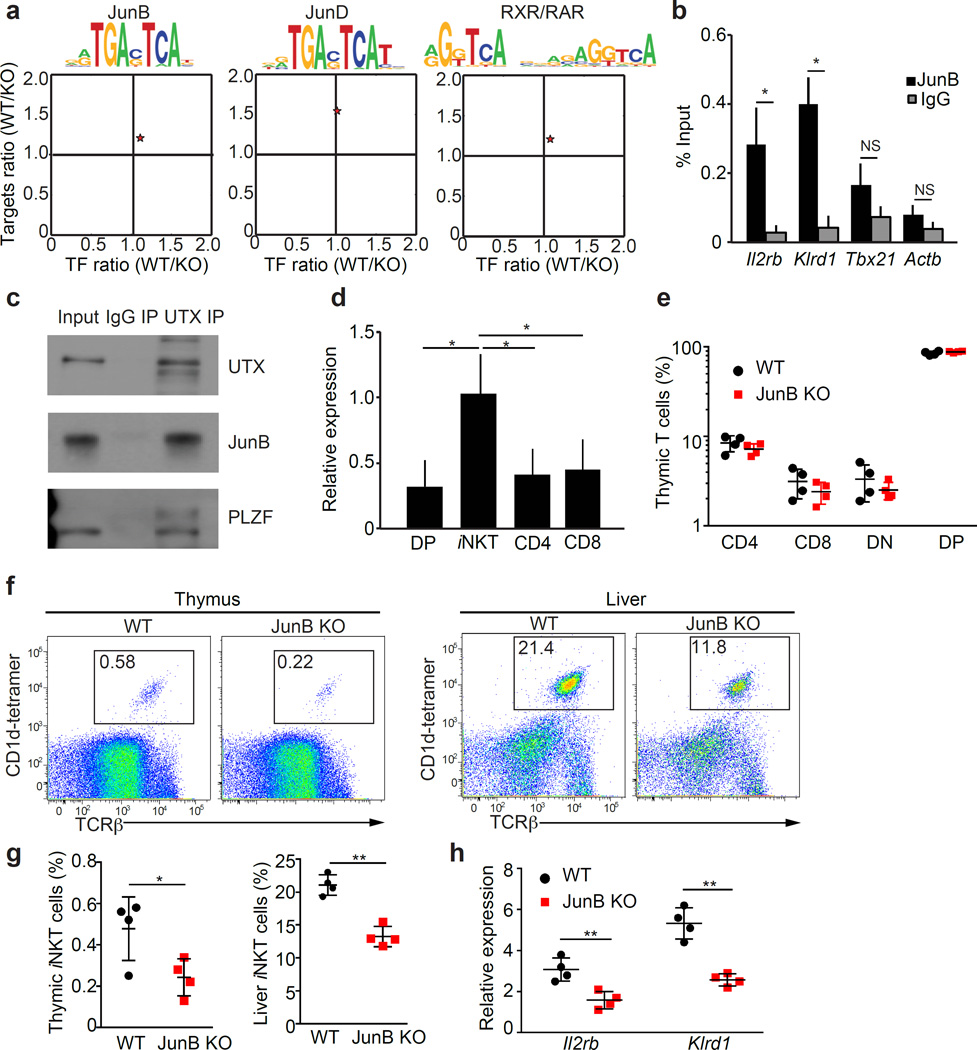
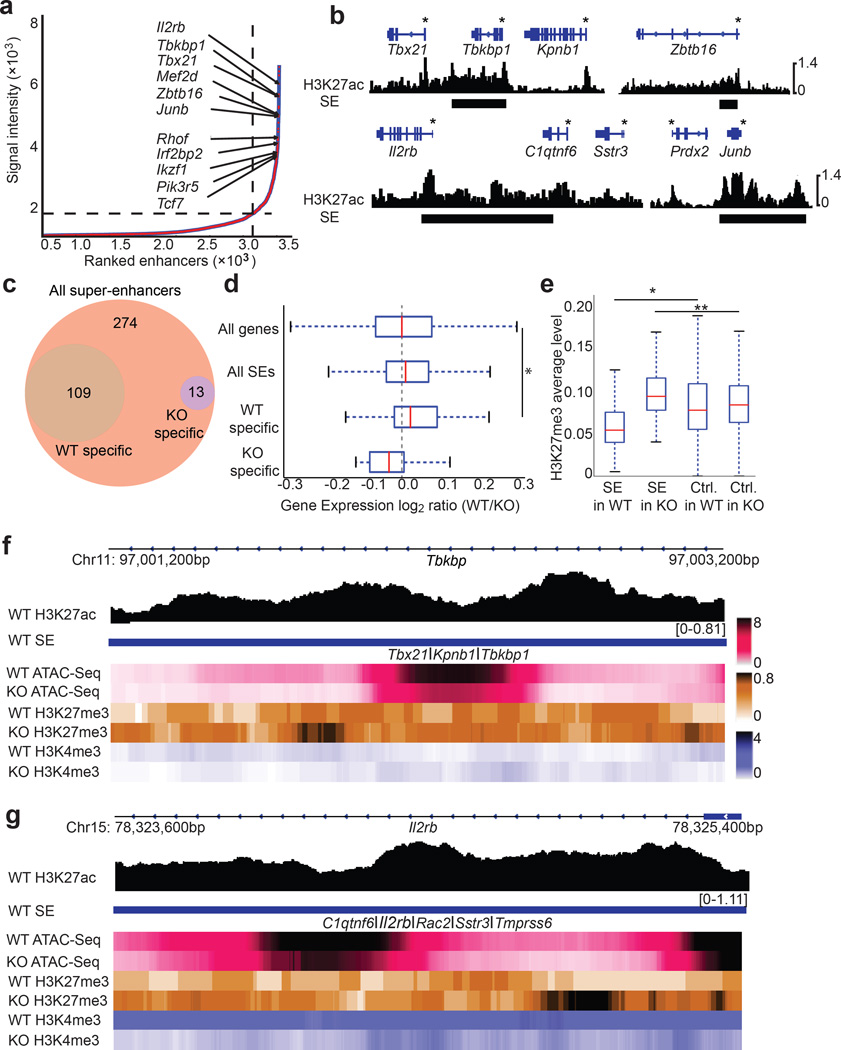
Invariant natural killer T cells (iNKT cells) are innate-like lymphocytes that protect against infection, autoimmune disease and cancer. However, little is known about the epigenetic regulation of iNKT cell development. Here we found that the H3K27me3 histone demethylase UTX was an essential cell-intrinsic factor that controlled an iNKT-cell lineage-specific gene-expression program and epigenetic landscape in a demethylase-activity-dependent manner. UTX-deficient iNKT cells exhibited impaired expression of iNKT cell signature genes due to a decrease in activation-associated H3K4me3 marks and an increase in repressive H3K27me3 marks within the promoters occupied by UTX. We found that JunB regulated iNKT cell development and that the expression of genes that were targets of both JunB and the iNKT cell master transcription factor PLZF was UTX dependent. We identified iNKT cell super-enhancers and demonstrated that UTX-mediated regulation of super-enhancer accessibility was a key mechanism for commitment to the iNKT cell lineage. Our findings reveal how UTX regulates the development of iNKT cells through multiple epigenetic mechanisms.


Figures

Figure 1
Figure 1
H3K27 demethylases are essential for iNKT cell maturation and development. (a) Frequency of iNKT cells in UTX KO (n = 5 mice), JMJD3 KO (n = 3 mice), or UTX/JMJD3 double-deficient (DKO, n = 5 mice) mice. iNKT cells were detected by staining with anti-CD3 and α-GalCer-loaded CD1d-tetramers (CD1d-tetramer) using flow cytometry. Right panel shows absolute cell numbers of iNKT cells in the different experimental groups. (b–d) Thymic iNKT cells from experimental groups (n = 4 per group) as described in (a) were analyzed for their maturation stages using flow cytometry. (b) Flow cytometry analysis of iNKT cells at stage 0 (CD24+CD1d-tetramer+) and stage 1–3 (CD24CD1d-tetramer+). Percentages of iNKT cells are depicted in the dot plots. (c) Thymic iNKT cells were gated on CD24tetramer+ iNKT cells and additionally analyzed for CD44 and NK1.1 expression. Stage 1: CD44NK1.1, stage 2: CD44+NK1.1, stage 3: CD44+NK1.1+. (d) Absolute cell numbers of thymic iNKT cells from the experiment described in (b,c). *P < 0.05; **P < 0.01; ***P < 0.001 (one-way analysis of variance (ANOVA) and multiple comparisons). Each symbol represents an individual mouse; data are mean ± s.e.m from three independent experiments (a–d)
Figure 2
Figure 2
UTX is required for lineage-specific expression of signature genes in iNKT cell development. (a–c) Gene expression profiles of UTX-deficient (UTX KO) or wild-type (WT) thymic iNKT cells. (a) Scatter plot shows up- or downregulated genes in UTX KO iNKT cells. RMA; Robust Multi-array Average (normalized fluorescence units of the probes on array). Data are from two experiments with five mice (WT) or four mice (KO). (b) Gene Set Enrichment Analysis (GSEA) of downregulated genes in UTX KO iNKT cells. ES, enriched score; NES, normalized ES; FDR, false discovery rate. (c) Expression of downregulated genes in UTX KO iNKT cells were validated by quantitative RT-PCR. Relative expression values are depicted normalized to Actin. Data are mean ± s.d. from five independent experiments. (d) Flow cytometry analysis of thymic iNKT cells from WT or UTX-deficient mice, staining for the gene products of the iNKT cell expression signature. Analysis is gated on CD3+CD1d-tetramer+ cells, and histograms depict the fluorescence intensity of the proteins indicated. Data are representative of three independent experiments.
Figure 3
Figure 3
UTX regulates the chromatin landscape of iNKT cells. (a,b) Genome-wide distribution of H3K4me3 (active) or H3K27me3 (repressive) histone marks on UTX-deficient (KO) or wild-type (WT) iNKT cells. Data are from two independent experiments. The Venn diagrams depict the numbers of genome-wide peaks of the histone marks H3K4me3 (a), and H3K27me3 (b), in WT or KO iNKT cells. (c–e) Chromatin landscape of WT or KO iNKT cells around gene promoters. 0 marks transcription start site (TSS). Shown is the average abundance of H3K27me3 and H3K4me3 depicted as z-score in reads per million (rpm). Average profiles are grouped including (c) all iNKT cell genes, or (d) downregulated genes (H3K4me3: P < 1 × 10⁻⁵, H3K27me3: P < 1 × 10⁻⁵), or (e) upregulated genes (H3K4me3: P = 0.16, H3K27me3: P = 9 × 10⁻⁴), with WT in blue and KO in green. (f–i) Integrating gene expression with chromatin state. Downregulated genes in KO iNKT cells were further subdivided into four clusters (C1–C4) dependent on their histone mark pattern. Gene expression is shown as logarithmic fold change (log2FC) in a whisker plot. The box extends from the lower to upper quartile values of the data, with a line at the median. The whiskers extend from the box 1.5 inter-quartile range on each side. Flier points are data points outside the whiskers. Average abundance of H3K27me3 and H3K4me3 around gene promoters in the different clusters is depicted as z-score in reads per million (rpm). C1–4 = clusters 1 to 4. P-values indicate statistical significance based on permutation test where 100,000 permutations were used to calculate the distribution of the difference between two average profiles.
Figure 4
Figure 4
UTX occupies iNKT signature gene promoters that exhibit UTX-dependent chromatin regulation. (a–e) ChIP-Seq overlay tracks of H3K27me3 and H3K4me3 marks for representative iNKT cell signature genes from UTX-deficient (KO) or wild-type (WT) iNKT cells (Data from Fig. 3). Gene structure and direction of transcription is depicted below the tracks. Gene promoters are indicated with an asterisk (*). (f) Assessment of UTX occupancy around signature gene promoters by ChIP-PCR. Shown is the relative enrichment of promoter sequences of iNKT cell signature genes by UTX ChIP compared to isotype control IgG. Actin (Actb) was used as negative control. *P < 0.05, using unpaired t-test. Data are mean ± s.d. from three independent experiments.
Figure 5
Figure 5
Demethylase activity of UTX is required for generation of iNKT cells. Bone marrow cells from wild-type (WT) mice transduced with lentivirus containing empty vector (empty), or UTX-deficient bone marrow (UTX KO) transduced with empty vector (empty), or full-length UTX (UTX fl), or enzyme-dead UTX (UTX ed), were transferred to Rag2−/− hosts. Twelve weeks later, recipient mice were analyzed for frequency and maturation of iNKT cells using flow cytometry. (a) Percentages of thymic iNKT cells are depicted in the bar graph. (b) Thymic iNKT cell maturation was assessed by measuring CD44 and NK1.1 expression gated on CD1d-tetramer+ cells, and is shown in the bar graph according to stages 1–3. (c,d) Liver iNKT cells were detected as CD3+CD1d-tetramer+ cells, and their percentages are depicted in the dot plots (c) and the bar graph (d). (e) Thymic iNKT cells from reconstituted mice were analyzed for UTX and signature gene expression by quantitative RT-PCR, and relative expression values were normalized to Actin. *P < 0.05, **P < 0.01, ***P < 0.001; NS, not significant, using one-way ANOVA and multiple comparisons. Data are mean ± s.e.m from two independent experiments with four mice per group.
Figure 6
Figure 6
Transcription factor JunB partners with UTX to regulate iNKT cell signature and development. (a) AP-1 transcription factor target motifs are enriched among downregulated genes in UTX-deficient iNKT cells. For motif enrichment, the analysis tool Haystack was used (P-values; JunB: 0.006, JunD: 0.006, RXR/RAR: 0.005). Depicted are target motif sequences and the expression ratios of transcription factors (TF) and their targets between wild-type (WT) and UTX KO (KO). (b) JunB ChIP-PCR analysis for UTX-dependent gene promoters in thymic iNKT cells. Shown is the relative enrichment of promoter sequences of UTX-dependent iNKT cell signature genes after JunB-ChIP compared to the isotype control (IgG). Actin (Actb) was used as a negative control. (c) Molecular interaction between UTX, JunB, and PLZF in iNKT cells as assessed by immunoprecipitation (IP) for UTX, compared to isotype control (IgG) (10% input). Data are representative of three independent experiments. (d) JunB expression in thymic CD4, CD8, double-positive (DP), and iNKT cells was analyzed by quantitative RT-PCR. Relative expression values were normalized to Actin. (e) Percentages of thymic CD4, CD8, double-negative (DN), and double-positive (DP) lymphocytes in WT and JunB KO mice. (f,g) Frequency of thymic and liver iNKT cells in WT and JunB KO mice was assessed using flow cytometry and depicted in representative dot plots (left panels). (h) Reduced expression levels of UTX-dependent iNKT signature genes in JunB KO thymic iNKT cells were analyzed by quantitative RT-PCR. Relative expression values were normalized to Actin. *P < 0.05, **P < 0.01; NS, not significant, using unpaired t-test. Data are mean ± s.e.m from three independent experiments (b–d) or two experiments with four mice per group (e–h).
Figure 7
Figure 7
UTX deficiency impairs activation of PLZF target genes in iNKT cells. (a) Heatmap of PLZF-activated genes illustrates reduction in gene expression in UTX KO iNKT cells. (b) Gene expression log2 ratios (WT/UTX KO) of PLZF-activated genes compared to random genes. (c) Accumulation of H3K27me3 marks around PLZF-activated gene promoters in UTX KO iNKT cells. Depicted are average levels of H3K27me3 abundance around PLZF-activated gene promoters (± 1kb of TSS) compared to randomly picked promoters in WT or UTX KO iNKT cells. Data are represented with whisker plots (n = 17 regions per group). The box extends from the lower to upper quartile values of the data, with a line at the median. The whiskers extend from the box 1.5 inter-quartile range on each side. Flier points are data points outside the whiskers. NS, not significant; *P < 0.05, using Mann-Whitney U test (b,c). (d–f) Representative tracks demonstrating loss of H3K4me3 and gain of H3K27me3 around the PLZF-activated genes: Il18r1 (d), Il12rb1 (e), Eya2 (f). Gene structure and direction of transcription is depicted below the tracks. Gene promoters are indicated with an asterisk (*). (g) Reduced expression levels of PLZF-activated genes in UTX KO thymic iNKT cells were confirmed by quantitative RT-PCR. Relative expression values were normalized to Actin. *P < 0.05, using unpaired t-test. Data are mean ± s.d. from three independent experiments.
Figure 8
Figure 8
UTX facilitates super-enhancer accessibility in iNKT cells. (a) Ranking of super-enhancers (SE) in iNKT cells. SEs were ranked based on H3K27ac signal intensity using the ROSE algorithm. (b) H3K27ac ChIP-Seq tracks of representative iNKT cell SEs are shown. Gene bodies are depicted above the tracks, and SEs are marked as black bars. Gene promoters are indicated with an asterisk (*). (c) Chromatin accessibility of SEs identified in (a) was analyzed using ATAC-Seq. The Venn diagram depicts numbers of accessible WT SEs with specific WT−, or KO ATAC-Seq peaks in iNKT cells. Data are from two independent experiments. (d) Expression of genes nearby UTX-dependent SEs is downregulated in KO iNKT cells. Gene expression log2 ratios (WT/KO) of all genes (n = 20,628), genes nearby all defined iNKT cell SEs (n = 396), or iNKT SEs with WT-specific accessibility (UTX-dependent, n = 109), or iNKT SEs with KO-specific accessibility (n = 13) are shown. Data is represented with a whisker plot. *P = 0.002, using Mann-Whitney U test (e) Accumulation of H3K27me3 marks around SE regions in KO iNKT cells. Depicted are average levels of H3K27me3 abundance in the vicinity of the defined SE regions in (a) compared to randomly picked control regions (C) in WT or KO iNKT cells. n = 396 regions per group. Data are represented with a whisker plot. *P = 5.9 × 10⁻¹⁰, **P = 1.9 × 10⁻¹⁴ using Mann-Whitney U test. (f,g) Representative tracks demonstrating loss of accessibility and gain of H3K27me3 around the defined SE regions for T-bet (Tbx21) (f) and Il2rb (g). Depicted are the ChIP-Seq tracks of H3K27ac and heat maps of ATAC-Seq, H3K27me3, and H3K4me3 in WT or KO iNKT cells around the SEs for Tbx21 and Il2rb.

Comment in

References

    1. Bendelac A, Savage PB, Teyton L. The biology of NKT cells. Annu. Rev. Immunol. 2007;25:297–336. - PubMed
    1. Rossjohn J, Pellicci DG, Patel O, Gapin L, Godfrey DI. Recognition of CD1d-restricted antigens by natural killer T cells. Nat. Rev. Immunol. 2012;12:845–857. - PMC - PubMed
    1. Kawano T, et al. CD1d-restricted and TCR-mediated activation of valpha14 NKT cells by glycosylceramides. Science. 1997;278:1626–1629. - PubMed
    1. Cui J, et al. Requirement for Valpha14 NKT cells in IL-12-mediated rejection of tumors. Science. 1997;278:1623–1626. - PubMed
    1. Bendelac A. Positive selection of mouse NK1+ T cells by CD1-expressing cortical thymocytes. J. Exp. Med. 1995;182:2091–2096. - PMC - PubMed

References for Methods

    1. Passegue E, Wagner EF, Weissman IL. JunB deficiency leads to a myeloproliferative disorder arising from hematopoietic stem cells. Cell. 2004;119:431–443. - PubMed
    1. Irizarry RA, et al. Exploration, normalization, and summaries of high density oligonucleotide array probe level data. Biostatistics. 2003;4:249–264. - PubMed
    1. Johnson WE, Li C, Rabinovic A. Adjusting batch effects in microarray expression data using empirical Bayes methods. Biostatistics. 2007;8:118–127. - PubMed
    1. Smyth GK. Linear models and empirical bayes methods for assessing differential expression in microarray experiments. Stat Appl Genet Mol Biol. 2004;3 Article3. - PubMed
    1. McLean CY, et al. GREAT improves functional interpretation of cis-regulatory regions. Nat Biotechnol. 2010;28:495–501. - PMC - PubMed

Publication types

MeSH terms

Substances