. 2017 Jan;19(1):52-59.
doi: 10.1038/ncb3454. Epub 2016 Dec 19.

Tricellular junctions regulate intestinal stem cell behaviour to maintain homeostasis

Affiliations

Tricellular junctions regulate intestinal stem cell behaviour to maintain homeostasis

Martin Resnik-Docampo et al. Nat Cell Biol. 2017 Jan.

Abstract

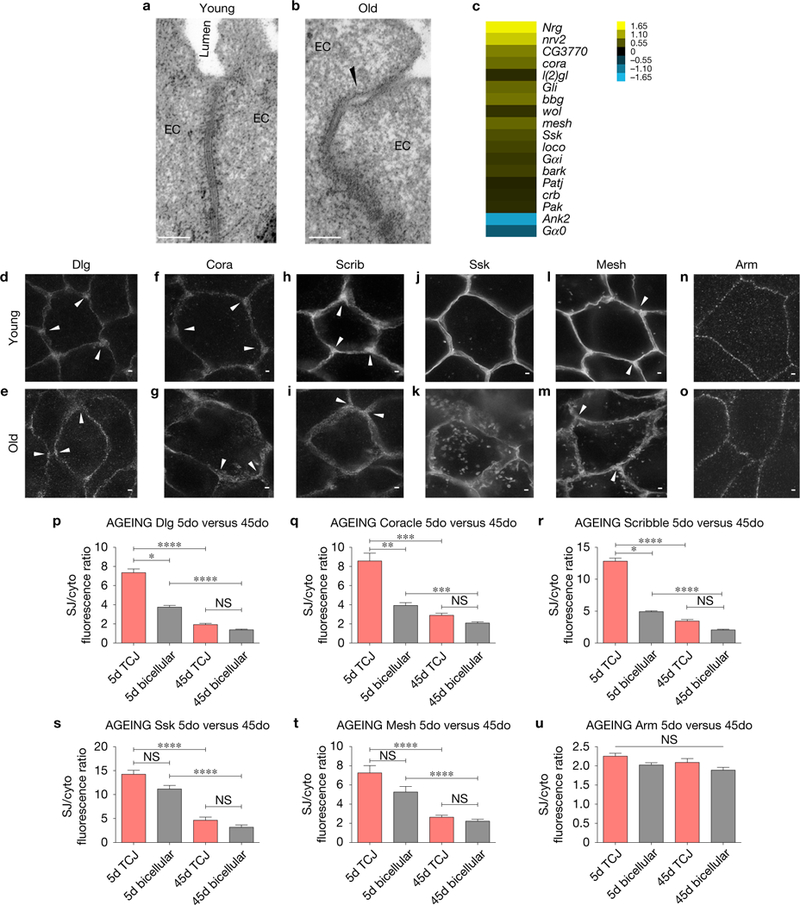
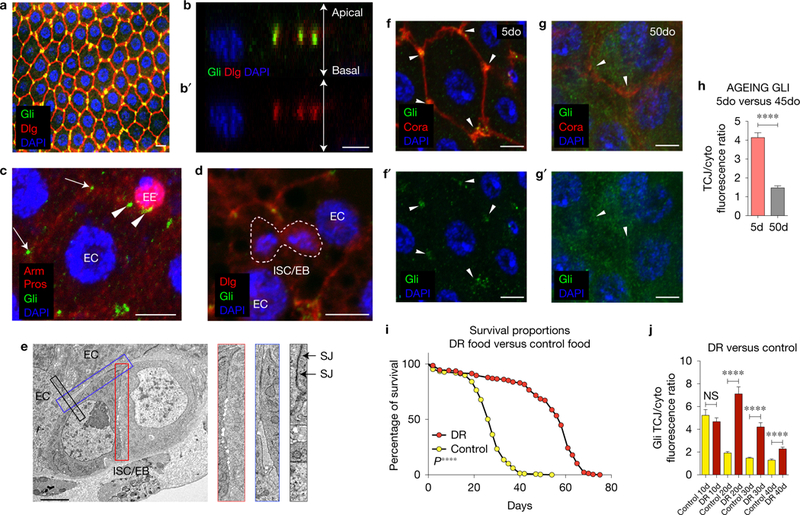
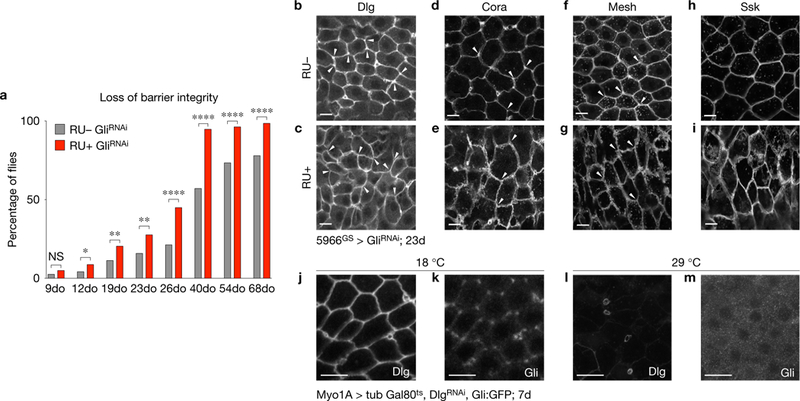
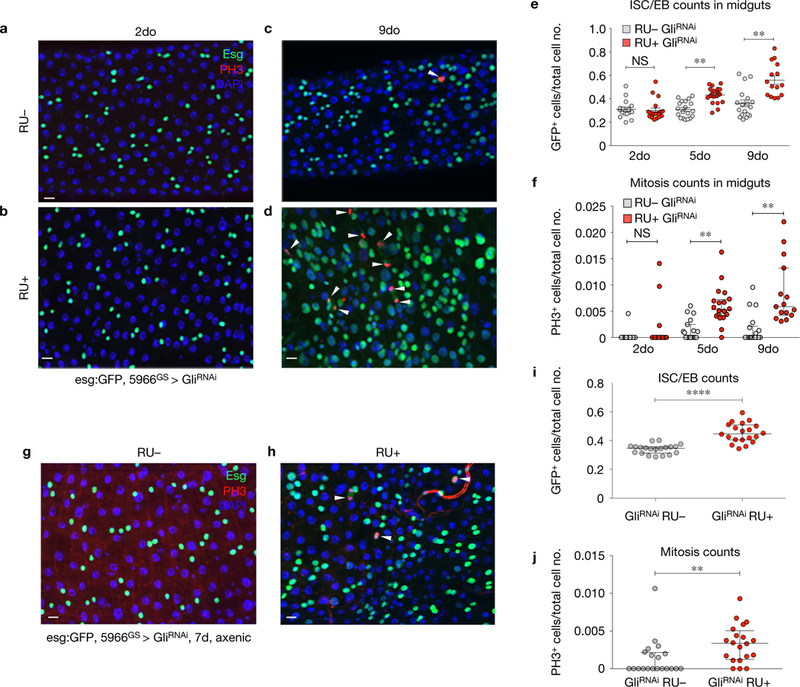
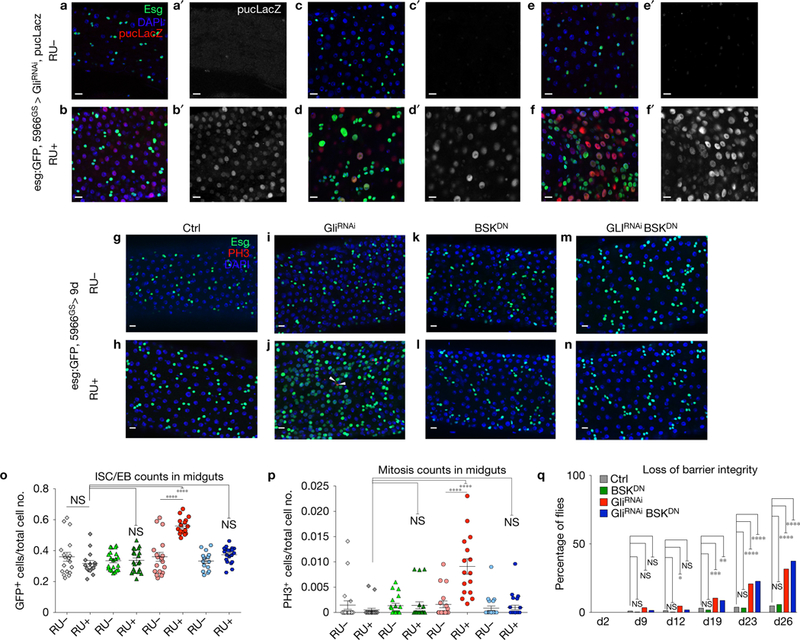
Ageing results in loss of tissue homeostasis across taxa. In the intestine of Drosophila melanogaster, ageing is correlated with an increase in intestinal stem cell (ISC) proliferation, a block in terminal differentiation of progenitor cells, activation of inflammatory pathways, and increased intestinal permeability. However, causal relationships between these phenotypes remain unclear. Here, we demonstrate that ageing results in altered localization and expression of septate junction proteins in the posterior midgut, which is quite pronounced in differentiated enterocytes (ECs) at tricellular junctions (TCJs). Acute loss of the TCJ protein Gliotactin (Gli) in ECs results in increased ISC proliferation and a block in differentiation in intestines from young flies, demonstrating that compromised TCJ function is sufficient to alter ISC behaviour in a non-autonomous manner. Blocking the Jun N-terminal kinase signalling pathway is sufficient to suppress changes in ISC behaviour, but has no effect on loss of intestinal barrier function, as a consequence of Gli depletion. Our work demonstrates a pivotal link between TCJs, stem cell behaviour, and intestinal homeostasis and provides insights into causes of age-onset and gastrointestinal diseases.


Conflict of interest statement

COMPETING FINANCIAL INTERESTS

The authors declare no competing financial interests.

Figures

Figure 1
Figure 1
Age-related changes in SJs in posterior midguts from aged flies. (a,b) Electron micrographs showing a gap at the SJ (arrowhead) between ECs in an intestine from a 45do fly (b) compared with the SJ between adjacent ECs in a gut from a 5do fly (a); 6 midguts per condition (10 EC/EC SJs were observed per midgut). Scale bars, 0.1 μm. (c) Expression heatmap of representative changes in gene expression (old/young) of genes encoding SJs or SJ assembly components that change with age. (d–o) Stimulated emission depletion (STED) images comparing SJ protein localization in ECs in young (10do) or aged (45do) midguts. SJ protein mis-localization is observed in old ECs, represented by thicker bicellular junctions, disappearance of enriched SJ protein localization at TCJs (arrowheads, d,f,h,l compared with e,g,i,m respectively) and an increase in cytoplasmic localization (k,m compared with j,l respectively). (n,o) STED images showing the AJ protein Arm is not affected by ageing. >14 midguts per condition; 10 ECs were observed per midgut. Samples were dissected and stained in parallel under the same conditions, pictures were taken at the same laser intensity. (p–u) TCJ/cytoplasm (red) and bicellular SJ/cytoplasm (grey) fluorescence ratios for different SJ and AJ components. Data were analysed with one-way ANOVA/Tukey’s multiple comparisons test and the error bars represent the s.e.m. range of those averages. ****, P <0.0001, ***, P <0.001,**, P <0.01, *, P <0.05 represent a statistically significant difference. NS, not significant. (p) Discs large (5do n = 20; 45do n = 19). (q) Coracle (5do n = 27; 45do n = 22). (r) Scribble (5do n = 20; 45do n = 21). (s) Snakeskin (5do n = 21; 45do n = 20). (t) Mesh (5do n = 21; 45do n = 21). (u) Armadillo (5do n = 20; 45do n = 21). Each data point (n = midguts) represents an average fluorescence intensity ratio from 2–7 independent measurements per midgut and the error bars represent the s.e.m. of those averages. Scale bars, 1 μm.
Figure 2
Figure 2
Gliotactin is located at the TCJ in differentiated cells in the intestine. (a) Confocal image of posterior midgut showing the localization of Gli-GFP (green) at the TCJ. Scale bar, 10 μm; image representative of 11 samples. (b,b′) Protein localization along the apical-basal axis; note co-localization of Gli-GFP (green) with Dlg (red). Scale bar, 5 μm. (c) Gli (green) is localized at the TCJ of ECs (arrows) and in EEs (arrowheads, marked by Prospero in red). Arm (red) localizes to the AJ in all cells. Scale bar, 5 μm; image representative of 10 samples. (d) Gli does not co-localize with Dlg, which appears cytoplasmic, in ISC/EB nests (dashed line). Scale bar, 5 μm; image representative of 10 samples. (e) Electron micrograph of an ISC/EB nest. SJs are apparent between ECs (black box), but not between ISC/EBs (red box). Blue box, ISC/EB-EC contacts. Image representative of 11 midguts (5 ISC/EB nests were observed per midgut), Scale bar, 1 μm. (f–g′) Gli is mis-localized from TCJs (arrowheads) in posterior midguts from 50do flies; scale bars, 5 μm. Samples were dissected and stained in parallel under the same conditions; pictures were taken at the same laser intensity. (h) Fluorescence intensity ratio of Gli at TCJ/cytoplasm in ECs from young and old flies (n = 27 5do, n = 22 45do midguts). Asterisks represent a statistically significant difference using an unpaired Student’s t-test, two tailed (****, P < 0.0001). Error bars represent the s.e.m. range of those averages. (i) Lifespan curves for female flies raised on conventional food (yellow) (n = 294) or DR food (red) (n = 223). T50 and total lifespan were significantly lower in controls compared with DR. Data were analysed with a non-parametric log-rank (Mantel-Cox) test; ***P <0.0001, represents a statistically significant difference. (j) TCJ/cytoplasm fluorescence ratio for Gli shows a slower decrease in DR flies (red) than in control (yellow). 10do Ctrl n = 20 midguts; 10do DR n D 18; 20do Ctrl n D 35; 20do DR n = 29; 30do Ctrl n = 22; 30do DR n = 22; 40do Ctrl n = 15; 40do DR n = 23. Data were analysed with unpaired Student’s t-test, two tailed; error bars represent the s.e.m. range of those averages., ***P < 0.0001. NS, not significant. Each data point (n = midguts) represents an average fluorescence intensity ratio from 2–7 independent measurements per midgut; error bars represent the s.e.m. range of those averages.
Figure 3
Figure 3
Loss of Gliotactin in ECs leads to loss of intestinal barrier integrity. (a) Flies with reduced Gli expression (5966GS GAL4/UAS-GliRNAi, RUC, n = 265) show acceleration of loss of barrier integrity, when compared with controls (5966GS GAL4/UAS-GliRNAi ethanol-fed, RU, n = 240 flies). Asterisks represent a statistically significant difference in pairwise post-test comparisons, indicated by the corresponding bars (***P < 0.0001; **P <0.001 and *P < 0.05; Fisher’s exact test; two tailed; NS, not significant). (b–i) Confocal images of posterior midguts from 23do flies. Loss of Gli in ECs did not affect the levels of SJ proteins Dlg (c), Cora (e), Mesh (g) or Ssk (i), although disruption of the TCJ and mis-localization of SJ proteins was observed, compared with respective controls (b,d,f,h) (TCJ marked by arrowheads in b–g). Samples were dissected and stained in parallel under the same conditions; pictures were taken at the same laser intensity. Images are representative of at least 16 midguts. (j–m) Depletion of dlg induced in ECs with Myo1A-GAL4 GAL80ts UAS-dlgRNAi for 7 days. At 29 °C Dlg is reduced from ECs but maintained in EEs (l), while Gli is completely lost from TCJs (m) compared with controls maintained at 18 °C (j,k). Scale bars, 10 μm.
Figure 4
Figure 4
Loss of Gliotactin in ECs induces ISC proliferation and accumulation of esg+ cells. (a–f) Posterior midguts from Su(H)LacZ; 5966GS GAL4, esg:GFP/UAS-GliRNAi flies after 2d (a,b) or 9d (c,d). Gli knockdown causes an increase in esg+ ISC/EBs (marked by esg:GFP, green) and ISC proliferation (marked by arrowheads PH3, red) after 9 days (d), compared with RU controls (c). (e,f) Graphical summary showing changes in ISC/EB number (e) and mitosis counts (f) after 5 days. (e) RU UAS-GliRNAi n = 16 2do, n = 19 5do, n = 18 9do; RUC UAS-GliRNAi n = 19 2do, n = 17 5do, n = 15 9do. Each data point is an average proportion calculated from four independent images per midgut and the error bars represent the mean s.e.m. of those averages (one-way ANOVA/Tukey’s multiple comparisons test), P < 0.01, represents a statistically significant difference. NS, not significant. (f) RU UAS-GliRNAi n = 16 2do, n = 19 5do, n = 18 9do; RUC UAS-GliRNAi n = 19 2do, n = 17 5do, n = 15 9do. Each data point is an average proportion calculated from four independent images per midgut and the error bars represent the median with interquartile range of those averages (Kruskal-Wallis/Dunn multiple comparisons test). **, P <0.01, represents a statistically significant difference. (g–j) Posterior midguts from Su(H)LacZ; 5966GS GAL4, esg:GFP/UAS-GliRNAi flies raised under axenic conditions. After 7 days of Gli depletion, effects on esgC cell number and ISC mitoses were still observed. (g,h) Gli knockdown caused an increase in the ISC/EBs cell number (marked by esg:GFP, green) and proliferation (marked by arrowheads PH3, red) after 7 days (h), compared with RU controls (g). (i–j) Graphical summary showing the statistical significance in ISC/EB number (i) and mitosis counts (j) after 7 days. (i) RU− UAS-GliRNAi n = 20, RUC UAS-GliRNAi n = 20. Each data point is an average proportion calculated from four independent images per midgut and the error bars represent the mean s.e.m. of those averages (unpaired Student’s t-test, two tailed) ***, P < 0.0001, represents a statistically significant difference. (j) RU− UAS-GliRNAi n = 20, RU+ UAS-GliRNAi n = 20. Each data point is an average proportion calculated from four independent images per midgut; error bars represent the median with interquartile range of those averages (Mann-Whitney non-parametric test). **, P < 0.01, represents a statistically significant difference. Scale bars, 10 m.
Figure 5
Figure 5
JNK signalling is activated downstream of Gli to drive changes in ISC behaviour in a non-autonomous manner. (a–f′) Reduction of Gli expression in ECs using 5966 GAL4GS triggers JNK pathway activation, reported by puc-lacZ expression (red or grey) in ECs 2 (b,b′; 11 midguts), 5 (d,d′; 8 midguts) and 9 (f,f′; 8 midguts) days after reducing Gli expression, compared with RU controls (a,a′, 7 midguts; c,c′, 8 midguts; e,e′, 7 midguts). ISC/EB is marked by esg-GFP (green), cell nuclei by DAPI (blue). (g–q) Epistasis analysis between Gli (GliRNAi) and Bsk (BSKDN). Midguts were stained with DAPI (nuclei, blue), GFP (esg+ cells, green) and PH3 (mitotic cells marked by arrowheads, red) following 9 days of incubation in RU+ or RU−. We observe that blocking JNK signalling (BskDN) (5966GS GAL4/UAS-GliRNAi UAS-BskDN, RU+) (n–p) rescues the non-autonomous effect on ISC proliferation produced by GliRNAi (5966GS GAL4/UAS-GliRNAi, RU+) (j,o,p). (g–n) Four representative images were taken per midgut, of at least sixteen midguts. (o) ISC/EB counts in midguts. Left to right: Ctrl RU− n = 20, Ctrl RU+ n = 20, BskDN RU− n = 18, BskDN RU+ n = 16, GliRNAi RU− n = 19, GliRNAi RU+ n = 20, GliRNAi BskDNRU− n = 22, GliRNAi BskDN RU+ n = 24. Each data point is an average proportion calculated from four independent images per midgut and error bars represent the mean s.e.m. of those averages (one-way ANOVA/Tukey’s multiple comparisons test). ****, P < 0.0001, represents a statistically significant difference. NS, not significant. (p) Quantification of mitotic ISCs. Left to right: Ctrl RU− n = 20, Ctrl RU+ n = 20, BskDN RU− n = 18, BskDN RU+ n = 16, GliRNAi RU− n = 19, GliRNAi RU+ n = 20, GliRNAi BskDN RU+ n = 22, GliRNAi BskDN RU+ n = 24. Each data point is an average proportion calculated from four independent images per midgut, and the error bars represent the median with interquartile range of those averages (Kruskal-Wallis/Dunn multiple comparisons test). ****, P <0.0001, represents a statistically significant difference. NS, not significant. (q) Quantification of loss of barrier function. Flies with reduced Gli expression (5966GS GAL4/UAS-GliRNAi, RU+, n = 259) present the same increase in Smurf proportion as the combination GliRNAi BskDN (5966GS GAL4/UAS-GliRNAi UAS-BskDN, RU+, n = 264), compared with BskDN (5966GS GAL4/UAS-BskDN, RU+, n = 277) and control flies (5966GS GAL4/UAS-GliRNAi ethanol, RU−, n = 290). Fisher’s exact test; two tailed. ****, P <0.0001,***, P <0.001, **, P <0.01, *, P <0.05 represent a statistically significant difference. NS, not significant. Scale bars, 10 μm.

Comment in

Similar articles

Cited by

References

    1. Jones DL & Rando TA Emerging models and paradigms for stem cell ageing. Nat. Cell Biol 13, 506–512 (2011). - PMC - PubMed
    1. Li H & Jasper H Gastrointestinal stem cells in health and disease: from flies to humans. Dis. Models Mech 9, 487–499 (2016). - PMC - PubMed
    1. Marchiando AM, Graham WV & Turner JR Epithelial barriers in homeostasis and disease. Annu. Rev. Pathol 5, 119–144 (2010). - PubMed
    1. Micchelli CA & Perrimon N Evidence that stem cells reside in the adult Drosophila midgut epithelium. Nature 439, 475–479 (2006). - PubMed
    1. Ohlstein B & Spradling A The adult Drosophila posterior midgut is maintained by pluripotent stem cells. Nature 439, 470–474 (2006). - PubMed