. 2017 Feb;49(2):204-212.
doi: 10.1038/ng.3742. Epub 2016 Dec 19.

Dynamics of clonal evolution in myelodysplastic syndromes

Affiliations

Dynamics of clonal evolution in myelodysplastic syndromes

Hideki Makishima et al. Nat Genet. 2017 Feb.

Abstract

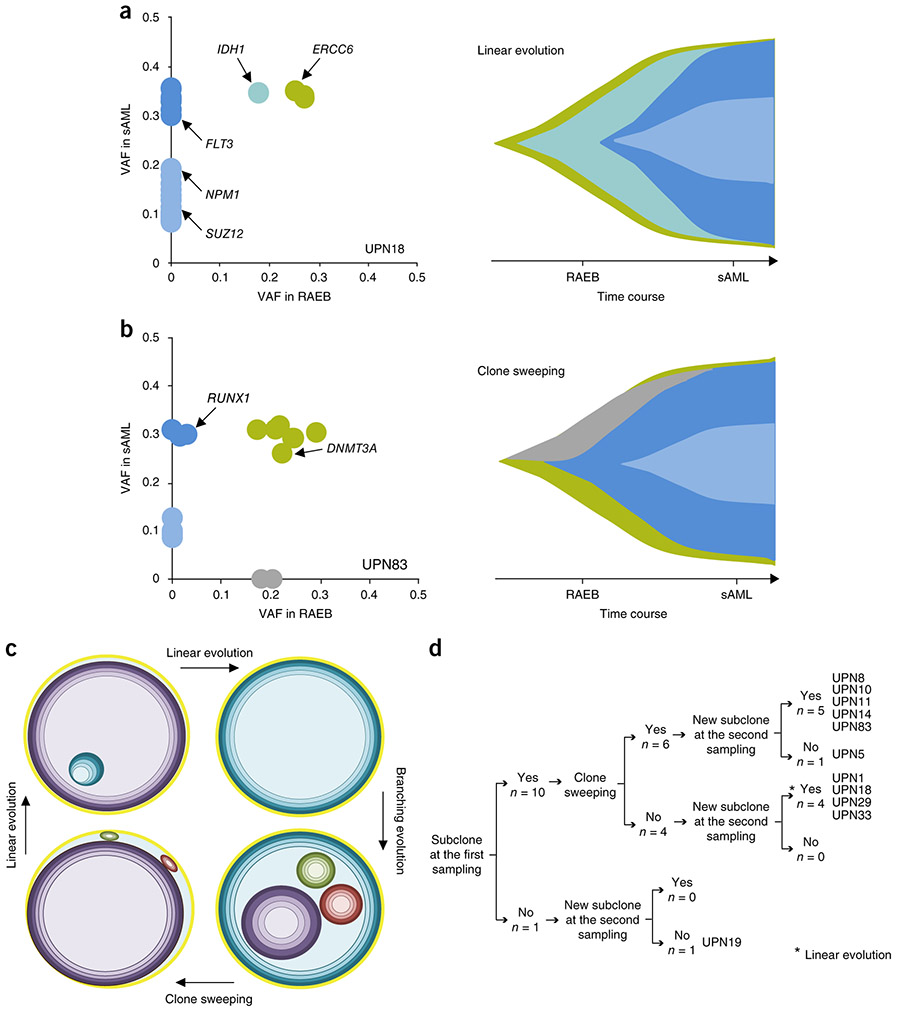
To elucidate differential roles of mutations in myelodysplastic syndromes (MDS), we investigated clonal dynamics using whole-exome and/or targeted sequencing of 699 patients, of whom 122 were analyzed longitudinally. Including the results from previous reports, we assessed a total of 2,250 patients for mutational enrichment patterns. During progression, the number of mutations, their diversity and clone sizes increased, with alterations frequently present in dominant clones with or without their sweeping previous clones. Enriched in secondary acute myeloid leukemia (sAML; in comparison to high-risk MDS), FLT3, PTPN11, WT1, IDH1, NPM1, IDH2 and NRAS mutations (type 1) tended to be newly acquired, and were associated with faster sAML progression and a shorter overall survival time. Significantly enriched in high-risk MDS (in comparison to low-risk MDS), TP53, GATA2, KRAS, RUNX1, STAG2, ASXL1, ZRSR2 and TET2 mutations (type 2) had a weaker impact on sAML progression and overall survival than type-1 mutations. The distinct roles of type-1 and type-2 mutations suggest their potential utility in disease monitoring.


Figures

Figure 1
Figure 1
Numbers, allele frequency and diversity of somatic nonsynonymous mutations. (a) Numbers and means of nonsynonymous mutations (per megabase) in individual samples for different disease subtypes. MDS/MPN-u, MDS/MPN unclassifiable. (b) Numbers of nonsynonymous mutations in 11 paired serial samples. Red and blue lines indicate cases with increasing and decreasing numbers of nonsynonymous mutations during disease progression, respectively. (c) Maximum values of VAF of mutations in patients for each disease subtype (25th, 50th and 75th percentiles are shown). (d) Shannon indices of mutation diversity calculated by randomly resampling 37 patients (25th, 50th and 75th percentiles are shown).
Figure 2
Figure 2
Clonal evolution from MDS to sAML analyzed by WES. (a–c) Depictions of clonal evolution during transformation from RAEB to sAML found in two representative patients, UPN18 (a) and UPN83 (b) as examples of linear evolution and clone sweeping, respectively, which can sequentially arise and recur in a single patient (c). Clonal populations in diagnostic (RAEB) and sAML samples were inferred from mutations detected by WES. VAFs of mutations in each sample are shown in diagonal plots. Known driver mutations are shown on the left; during leukemic evolution, the clonal structure evolved dynamically as shown on the right (a,b). Each concentric circle with a color gradient indicates a population of clones undergoing evolution, where each circle represents clones sharing the same set of mutations. Newly emerging clones can evolve with or without clone sweeping of other subpopulations. (d) Summary of 11 cases in which two longitudinally collected samples were analyzed by WES, in terms of presence or absence of subclones at presentation, clone sweeping and emergence of new subclones during disease progression.
Figure 3
Figure 3
Dynamics of major driver mutations revealed by targeted sequencing. (a) Time charts of driver mutations showing dynamic changes in their VAFs during disease progression (UPN149 and UPN682) or relapse (UPN72) in three representative cases out of 122 patients in whom driver mutations were analyzed in serially collected samples using targeted sequencing of a panel of 61 major driver mutations reported in MDS and AML. Dx, diagnosis; m, months. BMT, bone marrow transplantation; RCMD, refractory cytopenia with multilineage dysplasia. (b) Difference in VAFs of driver mutations (401 mutations) between the first and the second sampling. In box-and-whisker plots, boxes denote the median and 25th and 75th percentiles, and the ends of the whiskers correspond to minimum and maximum values. (c) The number of mutations showing an increased or a decreased clone size or VAF between two consecutive samples, in which newly acquired or lost mutations in the second samples are indicated in orange or blue, respectively, and the number of persistent mutations are shown in green.
Figure 4
Figure 4
Distinct sets of driver mutations in MDS and their impact on clinical outcomes. (a) Enrichment of driver mutations in sAML and high-risk MDS relative to high-risk and low-risk MDS, respectively. Enrichment is expressed as an odds ratio (OR) of mutation rates in sAML (n = 360) vs. high-risk MDS (n = 683) on the x axis and high-risk (n = 683) vs. low-risk (n = 1,207) on the y axis. Logistic regression analysis was applied to 25 driver genes measured in whole cohorts in 2,250 MDS and sAML patients, and the best model was selected by the least absolute shrinkage and selection operator. Mutations showing significant enrichment in either comparison are indicated by colors according to OR 95% CI limits being above (if OR >1) or below (if OR <1). According to their distinct enrichment patterns, mutations are classified into type 1 or type 2, as indicated. (b) Compositions of type-1, type-2 and other mutations are shown for each set of mutations that were newly acquired, that persisted with increased or decreased clone size, and that were lost in the second sampling. The Cochran-Armitage trend test was applied. (c,e) Kaplan-Meier curves for PFS (n = 429) (c) and OS (n = 1,347) (e) of patients with type-1 mutations (group I), with type-2 but not type-1 mutations (group II), with SF3B1 but no type-1 or type-2 mutations (group III), and other patients with no type-1, type-2 or SF3B1 mutations (group IV). (d) Clonal dynamics in group-II cases (n = 35) during sAML progression. Type-1 mutations were acquired in 15 (43%) cases.
Figure 5
Figure 5
Effects of clone size of driver mutations on prognosis. (a,b) Effects of clone size of type-1 (a) and type-2 (b) mutations on progression to sAML. Clones are dichotomized into larger and smaller ones by the median VAF of mutations and survivals are compared between patients with larger and smaller clones. In cases where multiple mutations in the corresponding category are observed, the maximum value of VAFs was used.
Figure 6
Figure 6
Combination of type-1 and type-2 mutations in MDS. (a) Correlation between mutations found in 43 genes associated with MDS pathogenesis. Correlation coefficients and associated q values are indicated by the size of circles and color gradient as indicated. (b) Clone size of type-1 and type-2 mutations which were concomitantly identified in a case. Cases with both type-1 and type-2 mutations (n = 93) were represented in two-dimensional plots according to the VAFs of the mutations.

References

    1. Harris NL et al. World Health Organization classification of neoplastic diseases of the hematopoietic and lymphoid tissues: report of the Clinical Advisory Committee meeting–Airlie House, Virginia, November 1997. J. Clin. Oncol 17, 3835–3849 (1999). - PubMed
    1. Vardiman JW et al. The 2008 revision of the World Health Organization (WHO) classification of myeloid neoplasms and acute leukemia: rationale and important changes. Blood 114, 937–951 (2009). - PubMed
    1. Malcovati L et al. Prognostic factors and life expectancy in myelodysplastic syndromes classified according to WHO criteria: a basis for clinical decision making. J. Clin. Oncol 23, 7594–7603 (2005). - PubMed
    1. Cancer Genome Atlas Research Network. Genomic and epigenomic landscapes of adult de novo acute myeloid leukemia. N. Engl. J. Med 368, 2059–2074 (2013). - PMC - PubMed
    1. Mardis ER et al. Recurring mutations found by sequencing an acute myeloid leukemia genome. N. Engl. J. Med 361, 1058–1066 (2009). - PMC - PubMed