

Vocal Imitations of Non-Vocal Sounds
- PMID: 27992480
- PMCID: PMC5161510
- DOI: 10.1371/journal.pone.0168167
Vocal Imitations of Non-Vocal Sounds
Abstract
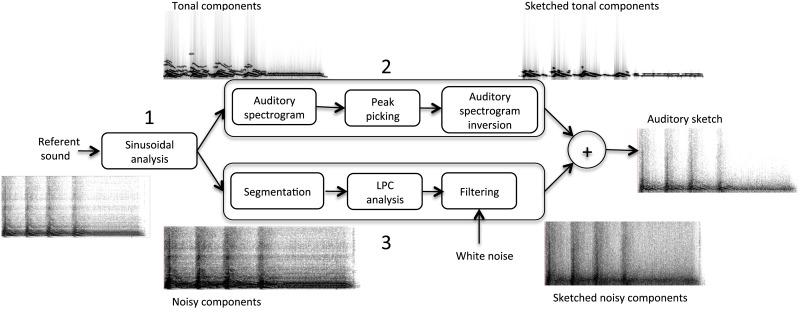
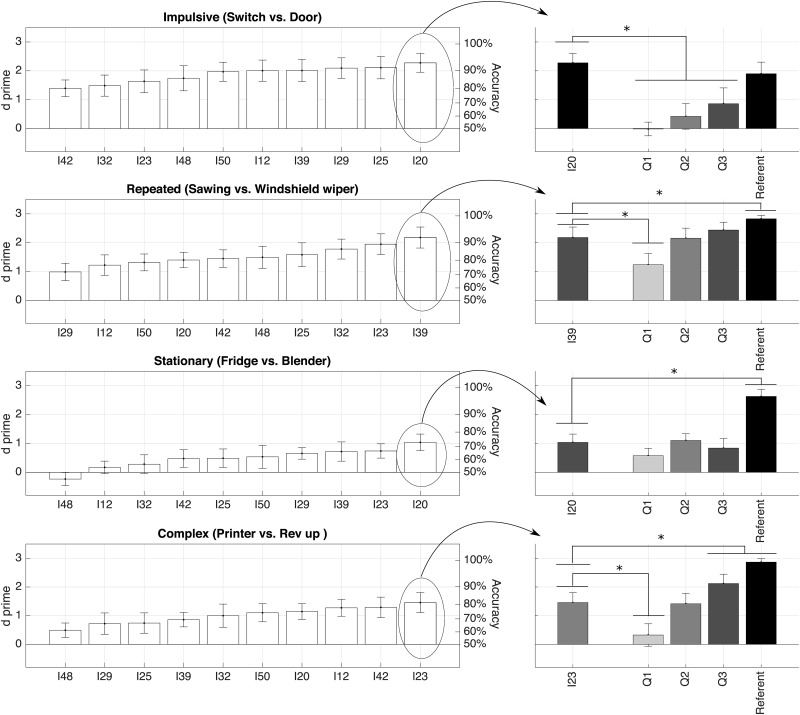
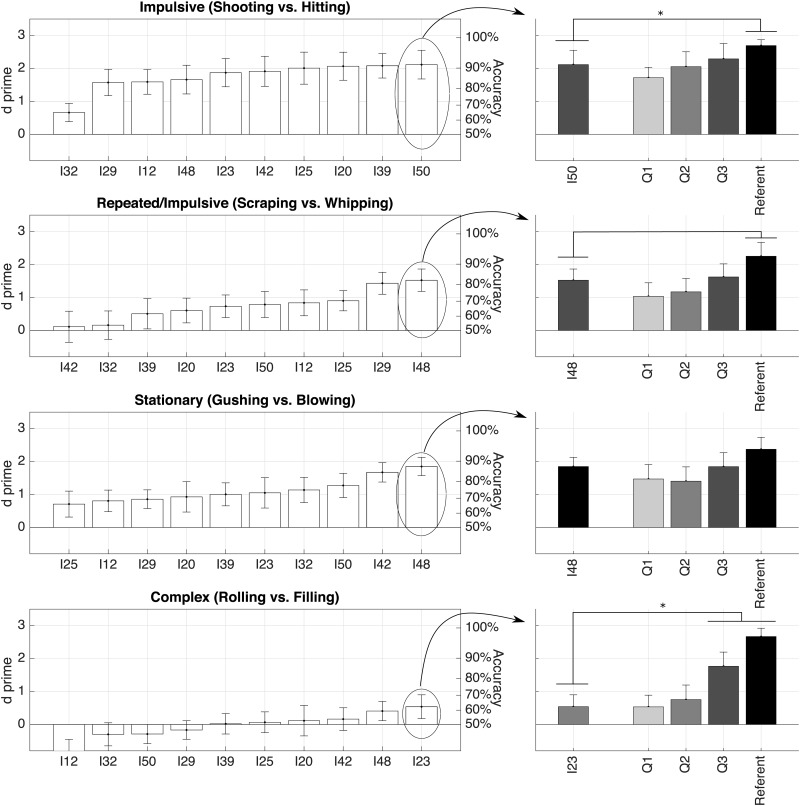
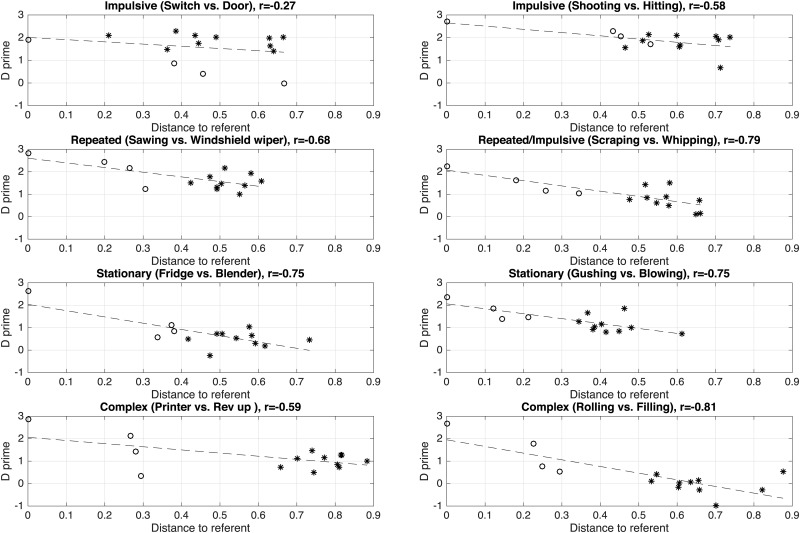
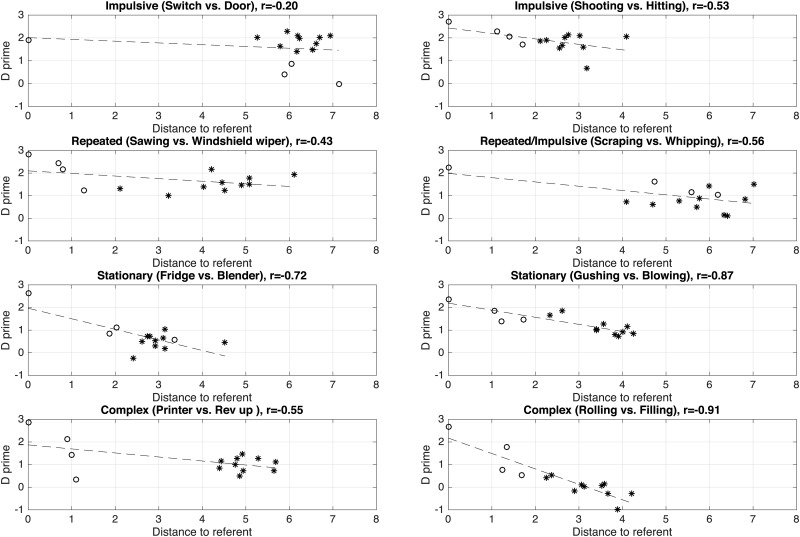
Imitative behaviors are widespread in humans, in particular whenever two persons communicate and interact. Several tokens of spoken languages (onomatopoeias, ideophones, and phonesthemes) also display different degrees of iconicity between the sound of a word and what it refers to. Thus, it probably comes at no surprise that human speakers use a lot of imitative vocalizations and gestures when they communicate about sounds, as sounds are notably difficult to describe. What is more surprising is that vocal imitations of non-vocal everyday sounds (e.g. the sound of a car passing by) are in practice very effective: listeners identify sounds better with vocal imitations than with verbal descriptions, despite the fact that vocal imitations are inaccurate reproductions of a sound created by a particular mechanical system (e.g. a car driving by) through a different system (the voice apparatus). The present study investigated the semantic representations evoked by vocal imitations of sounds by experimentally quantifying how well listeners could match sounds to category labels. The experiment used three different types of sounds: recordings of easily identifiable sounds (sounds of human actions and manufactured products), human vocal imitations, and computational "auditory sketches" (created by algorithmic computations). The results show that performance with the best vocal imitations was similar to the best auditory sketches for most categories of sounds, and even to the referent sounds themselves in some cases. More detailed analyses showed that the acoustic distance between a vocal imitation and a referent sound is not sufficient to account for such performance. Analyses suggested that instead of trying to reproduce the referent sound as accurately as vocally possible, vocal imitations focus on a few important features, which depend on each particular sound category. These results offer perspectives for understanding how human listeners store and access long-term sound representations, and sets the stage for the development of human-computer interfaces based on vocalizations.
Conflict of interest statement
The authors have declared that no competing interests exist.
Figures
Similar articles
-
Rising tones and rustling noises: Metaphors in gestural depictions of sounds.PLoS One. 2017 Jul 27;12(7):e0181786. doi: 10.1371/journal.pone.0181786. eCollection 2017. PLoS One. 2017. PMID: 28750071 Free PMC article.
-
Vocal imitation of percussion sounds: On the perceptual similarity between imitations and imitated sounds.PLoS One. 2019 Jul 25;14(7):e0219955. doi: 10.1371/journal.pone.0219955. eCollection 2019. PLoS One. 2019. PMID: 31344080 Free PMC article.
-
Vocal imitations of basic auditory features.J Acoust Soc Am. 2016 Jan;139(1):290-300. doi: 10.1121/1.4939738. J Acoust Soc Am. 2016. PMID: 26827025
-
Tool-use-associated sound in the evolution of language.Anim Cogn. 2015 Sep;18(5):993-1005. doi: 10.1007/s10071-015-0885-x. Epub 2015 Jun 29. Anim Cogn. 2015. PMID: 26118672 Review.
-
Producing song: the vocal apparatus.Ann N Y Acad Sci. 2004 Jun;1016:109-29. doi: 10.1196/annals.1298.041. Ann N Y Acad Sci. 2004. PMID: 15313772 Review.
Cited by
-
People Can Create Iconic Vocalizations to Communicate Various Meanings to Naïve Listeners.Sci Rep. 2018 Feb 8;8(1):2634. doi: 10.1038/s41598-018-20961-6. Sci Rep. 2018. PMID: 29422530 Free PMC article.
-
Rising tones and rustling noises: Metaphors in gestural depictions of sounds.PLoS One. 2017 Jul 27;12(7):e0181786. doi: 10.1371/journal.pone.0181786. eCollection 2017. PLoS One. 2017. PMID: 28750071 Free PMC article.
-
Vocal imitation of percussion sounds: On the perceptual similarity between imitations and imitated sounds.PLoS One. 2019 Jul 25;14(7):e0219955. doi: 10.1371/journal.pone.0219955. eCollection 2019. PLoS One. 2019. PMID: 31344080 Free PMC article.
-
Iconicity in Signed and Spoken Vocabulary: A Comparison Between American Sign Language, British Sign Language, English, and Spanish.Front Psychol. 2018 Aug 14;9:1433. doi: 10.3389/fpsyg.2018.01433. eCollection 2018. Front Psychol. 2018. PMID: 30154747 Free PMC article.
-
Repeated imitation makes human vocalizations more word-like.Proc Biol Sci. 2018 Mar 14;285(1874):20172709. doi: 10.1098/rspb.2017.2709. Proc Biol Sci. 2018. PMID: 29514962 Free PMC article.
References
-
- Porcello T. Speaking of sound: language and the professionalization of sound-recording engineers. Social Studies of Science. 2004;34(5):733–758. 10.1177/0306312704047328 - DOI
-
- Wright P. Linguistic description of auditory signals. Journal of applied psychology. 1971;55(3):244–250. 10.1037/h0031025 - DOI
-
- Houix O, Lemaitre G, Misdariis N, Susini P, Urdapilleta I. A lexical analysis of environmental sound categories. Journal of Experimental Psychology: Applied. 2012;18(1):52–80. - PubMed
-
- Lemaitre G, Susini P, Rocchesso D, Lambourg C, Boussard P. Non-Verbal Imitations as a Sketching Tool for Sound Design In: Aramaki M, Derrien O, Kronland-Martinet R, Ystad S, editors. Sound, Music, and Motion. Lecture Notes in Computer Sciences. Berlin, Heidelberg, Germany: Springer; 2014. p. 558–574.
-
- Lemaitre G, Dessein A, Susini P, Aura K. Vocal imitations and the identification of sound events. Ecological Psychology. 2011;23:267–307. 10.1080/10407413.2011.617225 - DOI
MeSH terms
LinkOut - more resources
Full Text Sources
Other Literature Sources
