. 2016 Dec 16;11(12):e0168621.
doi: 10.1371/journal.pone.0168621. eCollection 2016.

Between the Balkans and the Baltic: Phylogeography of a Common Vole Mitochondrial DNA Lineage Limited to Central Europe

Affiliations

Between the Balkans and the Baltic: Phylogeography of a Common Vole Mitochondrial DNA Lineage Limited to Central Europe

Joanna Stojak et al. PLoS One. .

Abstract

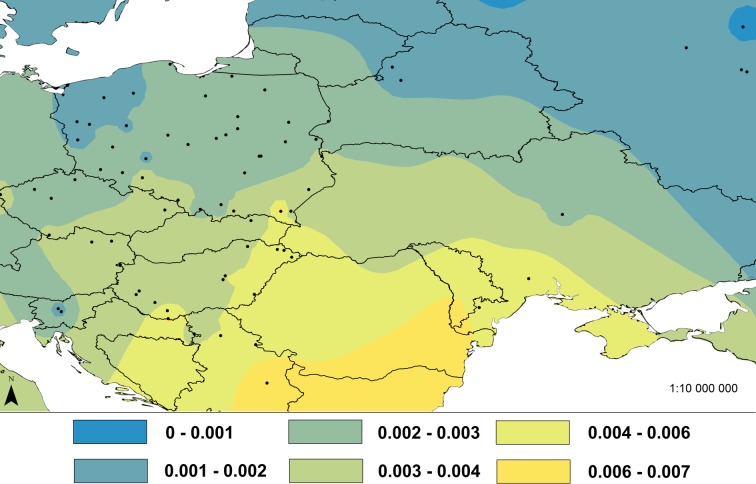
The common vole (Microtus arvalis) has been a model species of small mammal for studying end-glacial colonization history. In the present study we expanded the sampling from central and eastern Europe, analyzing contemporary genetic structure to identify the role of a potential 'northern glacial refugium', i.e. a refugium at a higher latitude than the traditional Mediterranean refugia. Altogether we analyzed 786 cytochrome b (cytb) sequences (representing mitochondrial DNA; mtDNA) from the whole of Europe, adding 177 new sequences from central and eastern Europe, and we conducted analyses on eight microsatellite loci for 499 individuals (representing nuclear DNA) from central and eastern Europe, adding data on 311 new specimens. Our new data fill gaps in the vicinity of the Carpathian Mountains, the potential northern refugium, such that there is now dense sampling from the Balkans to the Baltic Sea. Here we present evidence that the Eastern mtDNA lineage of the common vole was present in the vicinity of this Carpathian refugium during the Last Glacial Maximum and the Younger Dryas. The Eastern lineage expanded from this refugium to the Baltic and shows low cytb nucleotide diversity in those most northerly parts of the distribution. Analyses of microsatellites revealed a similar pattern but also showed little differentiation between all of the populations sampled in central and eastern Europe.


Conflict of interest statement

The authors have declared that no competing interests exist.

Figures

Fig 1
Fig 1. Map of distribution of mtDNA lineages of the common vole in Europe with new and previously obtained sequences.
(A) Distribution of common vole cytochrome b samples used in this study, newly sequenced and from GenBank [, –30]. The brown area shows the range of the species in Eurasia. The solid line marks the hybrid zone between the western (arvalis) and eastern (obscurus) forms; only the data for the western form are used in this study. Sampling localities are colored according to the cytochrome b lineage. (B) Distribution of common vole cytochrome b samples in central Europe belonging to the Eastern mtDNA lineage, both newly sequenced and from GenBank. The blue circles match the location of the Balkan mtDNA lineage, which makes contact with the Eastern lineage to the south. The yellow circles show the occurrence of the Central mtDNA lineage to the north of the area occupied by the Eastern lineage, including where they make contact. The black stars mark the locations where Microtus rossiaemeridionalis was found among the samples sequenced (KX380179-KX380191). Location numbers on the map are listed in S1, S2 and S3 Tables.
Fig 2
Fig 2. The network of cytb haplotypes of the common vole from Europe.
Median-joining network of cytochrome b haplotypes of the common vole, colored according to mtDNA lineage (blue–Balkan, B; orange–Italian, ITA; pink–Eastern, E; yellow–Central, CEN; violet–Western-South, WS; green–Western-North, WN). The area of the circles represents the number of sampled individuals with that haplotype. Small open circles indicate unsampled intermediate haplotypes.
Fig 3
Fig 3. Interpolation of nucleotide diversity in common voles from central Europe.
IDW interpolation of the nucleotide diversity (π) values of cytochrome b sequences from 74 populations of the common vole from the Eastern mtDNA lineage. The locations of populations are marked with black dots on the map and the π values for them are given in the text. The interpolated values of the nucleotide diversity based on 12 neighbors are presented in the map in different colors according to the legend. Only samples with ≥ 2 individuals were used for interpolation.
Fig 4
Fig 4. Bayesian clustering in STRUCTURE for the common vole from central Europe.
Results of the Bayesian clustering analysis implemented in STRUCTURE under the admixture model, based on the microsatellite dataset. Plots: vertical columns represent the assignment probabilities to each of the inferred clusters identified for K = 2, 3 and 9. Numbers on horizontal axis match population localities shown in S3 Table. Maps: simplified representation of the structure revealed for K = 2 (above) and K = 3 (below). Localities are colored according to cluster with the highest assignment following the same coloring as the plots.
Fig 5
Fig 5. Interpolation of allelic richness and expected heterozygosity in common voles from central Europe.
IDW interpolation of (A) allelic richness (AR) and (B) expected heterozygosity (HE) for microsatellites from 42 populations of the common vole in central Europe. The locations of populations are marked by black dots in the maps and the AR and HE values for them are given in the text. The interpolated values of both indices based on 12 neighbors are presented in the maps in different colors according to the legend. Only samples with ≥ 5 individuals were used for interpolation. Two Russian populations were excluded from the analysis because they were so distant from other populations.

References

    1. Avise JC. Phylogeography: The History and Formation of Species Cambridge (MA): Harvard University Press, 2000.
    1. Webb T, Bartlein PJ. Global changes during the last 3 million years: climatic controls and biotic responses. Annu Rev Ecol Evol Syst. 1992; 23: 141–173.
    1. Clark PU, Dyke AS, Shakun JD, Carlson AE, Clark J, Wohlfarth B et al. The Last Glacial Maximum. Science. 2009; 325: 710–714. 10.1126/science.1172873 - DOI - PubMed
    1. Wysota W, Lankauf KR, Szmańda J, Chruścińska A, Oczkowski HL, Przegiętka KR. Chronology of the Vistulian (Weichselian) glacial events in the lower Vistula region, middle-north Poland. Geochronometria. 2002; 21: 137–142.
    1. Wysota W, Molewski P, Sokołowski RJ. Record of the Vistula ice lobe advances in the Late Weichselian glacial sequence in north-central Poland. Quat Int. 2009; 207: 26–41.

LinkOut - more resources