. 2016 Dec 15;9(1):114-132.
doi: 10.18632/aging.101127.

Induction of fibroblast senescence generates a non-fibrogenic myofibroblast phenotype that differentially impacts on cancer prognosis

Affiliations

Induction of fibroblast senescence generates a non-fibrogenic myofibroblast phenotype that differentially impacts on cancer prognosis

Massimiliano Mellone et al. Aging (Albany NY). .

Abstract

Cancer-associated fibroblasts (CAF) remain a poorly characterized, heterogeneous cell population. Here we characterized two previously described tumor-promoting CAF sub-types, smooth muscle actin (SMA)-positive myofibroblasts and senescent fibroblasts, identifying a novel link between the two. Analysis of CAF cultured ex vivo, showed that senescent CAF are predominantly SMA-positive; this was confirmed by immunochemistry in head & neck (HNSCC) and esophageal (EAC) cancers. In vitro, we found that fibroblasts induced to senesce develop molecular, ultrastructural and contractile features typical of myofibroblasts and this is dependent on canonical TGF-β signaling. Similar to TGF-β1-generated myofibroblasts, these cells secrete soluble factors that promote tumor cell motility. However, RNA-sequencing revealed significant transcriptomic differences between the two SMA-positive CAF groups, particularly in genes associated with extracellular matrix (ECM) deposition and organization, which differentially promote tumor cell invasion. Notably, second harmonic generation imaging and bioinformatic analysis of SMA-positive human HNSCC and EAC showed that collagen fiber organization correlates with poor prognosis, indicating that heterogeneity within the SMA-positive CAF population differentially impacts on survival. These results show that non-fibrogenic, SMA-positive myofibroblasts can be directly generated through induction of fibroblast senescence and suggest that senescence and myofibroblast differentiation are closely linked processes.

Keywords: collagen; extracellular matrix; myofibroblasts; senescence; senescent fibroblasts; tumor microenvironment.


Conflict of interest statement

CONFLICTS OF INTEREST

The authors disclose no potential conflicts of interest.

Figures
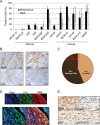
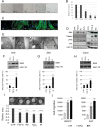
Figure 1
Figure 1. Senescent CAF analyzed ex vivo and in vivo are predominantly SMA-positive
(A) Histogram showing percentage of cells positive for senescence-associated (SA)-β-Galactosidase or SMA-positive stress fiber formation in normal oral fibroblasts (POF) and cancer-associated oral fibroblasts (CAF) grown ex-vivo. Data are presented as Mean ±SEM from 6 POFs and 6 CAF. (B) Representative images of immunohistochemistry on sequential tissue sections of SMA-positive/p16-positive or SMA-positive/p16-negative HNSCC cases. (C) Pie chart showing the percentage of HNSCC cases with stromal staining for SMA or p16. (D) Representative image of double immunofluorescence staining of a p16-positive/SMA-positive HNSCC case showing co-expression of SMA (red) and p16 (green, white arrows; scale bars represent 25μm). (E) Representative immunohistochemistry for SMA and markers of senescence (p53, p21) and oxidative stress (8-OHDG) on sequential tissue sections of HNSCC. See also Supplementary Fig. S2.
Figure 2
Figure 2. Induction of fibroblast senescence generates a myofibroblastic phenotype
HFFF2 fibroblasts were induced to senesce through serial passaging (RS), treatment with γ-irradiation (10Gy; IR) or H2O2 (1mM). Cells were treated with TGF-β1 (2ng/ml) for 72 hours to induce myofibroblast transdifferentiation as a positive control. 4-6 days post stimuli, induction of senescence was confirmed by (A) expression of SA-β-Galactosidase (SA-β-Gal; Scale Bar indicates 100μm) and (B) proliferation assays (cell counts presented as percentage of cells compared to untreated control cells; see also Supplementary Fig. S2A). Cells were examined for myofibroblast features: (C) Representative images of immunofluorescence for SMA expression (green) with DAPI nuclear counterstain (Blue) (Scale Bar indicates 100μm); (D) Western blotting for SMA, palladin and pFAK (HSC-70 as loading control); (E) Representative images of transmission electron microscopy. Arrows highlight sub-membranous microfilaments (Scale Bar indicates 50nm). (F-H) Western blotting for SMA expression (HSC-70 as loading control) and SA-β-Gal quantification following TGF-β1- and irradiation of primary fibroblasts isolated from oral, skin and colonic mucosa respectively. (I) Representative images of collagen gel contraction assays following treatment of HFFF2 with TGF-β1 or different senescence-inducing stimuli. Histogram shows quantification of gel area expressed as the mean ± SEM of 4 replicates; (J) Transwell migration assays with HNSCC (5PT) and EAC (OE33) cell lines. Conditioned media (CM) from HFFF2 fibroblasts induced to senesce through γ-irradiation (10Gy; IR) or to transdifferentiate into myofibroblasts through TGF-β1 was used a chemoattractant in the lower chamber. Data are presented as mean ± SEM and statistics are shown for T-test compared to controls (*p<0.05, **p<0.01, ***p<0.001, ****p<0.0001). See also Supplementary Fig. S1.
Figure 3
Figure 3. Smad signaling mediates senescence induction of a myofibroblastic phenotype
Western blot showing SMA and phospho(p)-Smad2/3 expression following treatment of HFFF2 fibroblasts with TGF-β1 (A) or irradiation (B) (Smad2 and HSC-70 as loading controls). (C) Representative images of immunofluorescence on HFFF2 fibroblasts showing expression of SMA (green), pSmad2/3 (red), SA-β-Galactosidase activity (grey; in bright field) with DAPI nuclear counterstain (Blue) (scale bar indicates 100μm). (D) Western blots showing SMAD3 knock-down (Tot-FAK as loading control) (left) and SMA expression (HSC-70 as loading control; right) in irradiated HFFF2 cells. (E) Western blot for SMA expression in irradiated HFFF2 pre-treated with a pan TGF-β1 inhibitory antibody. (F) TGFβ-1 assay showing luciferase activity controlled by a TGFβ-1 responsive promoter in MLEC cells co-cultured for 24 hours with untreated or irradiated fibroblasts (y axis indicates the ratio between luciferase activity and HFFF2s protein concentration). Data are presented as mean ± SEM and statistics are shown for T-test compared to controls. See also Supplementary Fig. S3.
Figure 4
Figure 4. Senescence- and TGF-β1-induced myofibroblasts have divergent gene expression profiles
(A-B) RNA-sequencing analysis of HFFF2 cells treated with TGF-β1 (2 ng/ml) or irradiation (10Gy) and grown for 7 days. (A) Unsupervised hierarchical clustering of the expression levels of differentially expressed genes (DEGs; FDR adj. p<0.001), identified using GLM likelihood ratio testing. Expression levels were subjected to Z score scaling within each sample for visualization purposes. Distances were calculated using a Euclidean distance measure. (B) Venn diagram showing the number of DEGs up- or downregulated in TGF-β1 and irradiated fibroblasts compared to controls. (C-E) RT-PCR measurements of mRNA expression levels of genes associated with myofibroblasts (C, E) and senescence (D) in HFFF2 cells used in the RNA-sequencing. Data are presented as mean ±SEM and statistics are shown for t-tests compared to control group. See also Supplementary Fig. S4.
Figure 5
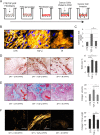
Figure 5. Myofibroblasts and not senescent fibroblasts mediate collagenous ECM deposition
(A) Schematic of experimental procedure for B and C. (B) Representative image of immunofluorescent staining for Fibronectin (FN) in fibroblast-derived matrices (FDM) produced by HFFF2s treated as indicated; FN (orange; pseudo-colored in Fiji) and Dapi (blue) as nuclear counterstain; scale bar represents 50μm. (C) Transwell assay examining OE33 invasion through FDM deposited by HFFF2 fibroblasts induced to transdifferentiate through treatment with TGF-β1 or γ-irradiation (IR). (D-F) Analysis of xenografts formed from 5PT cells injected s.c. into RAG1−/− mice with HFFF2 fibroblasts treated as indicated. (D) Representative images of SMA immunochemistry in 5PT xenografts co-injected with HFFF2s treated as indicated. Histogram shows SMA quantification expressed as % positive area. (E) Representative images of Masson's trichrome staining for collagen (royal blue) with HFFF2s treated as indicated. Histogram shows quantification expressed as % positive area. (F) Representative images showing multi-photon excitation (MPE) filtered for second harmonic generation to identify collagen fibers on sections from the xenograft tumors as indicated (Scale Bar indicates 100μm). Histogram shows quantification of collagen fiber elongation. Data are presented as mean ± SEM and statistics are shown for T-test compared to controls unless otherwise indicated.
Figure 6
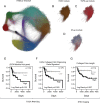
Figure 6. Collagen fiber deposition impacts tumor progression
(A) Gephi network graph where each node represents a gene labelled by color according WGCNA module assignment. Distance between nodes is represented by the TOM connectivity measure. The brown module is the ECM module. (B) ECM module extracted from panel A. (C) Network graph of the ECM module where nodes are color coded according to the correlation with TGF-β1-up DEGs, summarized by a signature eigengene. Red and blue colors show positive and negative correlation, respectively. (D) Correlation of IR-up DEGs with members of the ECM module (color range described above). (E-F) Kaplan-Meier curves showing survival rates in HNSCC patients with greater than average expression of genes associated with myofibroblasts stratified for COL3A1 (E) and CFOG expression (F). (G) Kaplan-Meier curves showing disease specific survival (DSS) rates in HNSCC patients with moderate or high stromal SMA expression (measured by immunohistochemistry), stratified by collagen fiber elongation measured by Second Harmonic Generation imaging. See also Supplementary Fig. S5.

References

    1. Hanahan D, Coussens LM. Accessories to the crime: functions of cells recruited to the tumor microenvironment. Cancer Cell. 2012;21:309–22. doi: 10.1016/j.ccr.2012.02.022. - DOI - PubMed
    1. Orimo A, Gupta PB, Sgroi DC, Arenzana-Seisdedos F, Delaunay T, Naeem R, Carey VJ, Richardson AL, Weinberg RA. Stromal fibroblasts present in invasive human breast carcinomas promote tumor growth and angiogenesis through elevated SDF-1/CXCL12 secretion. Cell. 2005;121:335–48. doi: 10.1016/j.cell.2005.02.034. - DOI - PubMed
    1. Sugimoto H, Mundel TM, Kieran MW, Kalluri R. Identification of fibroblast heterogeneity in the tumor microenvironment. Cancer Biol Ther. 2006;5:1640–46. doi: 10.4161/cbt.5.12.3354. - DOI - PubMed
    1. Eyden B. The myofibroblast: a study of normal, reactive and neoplastic tissues, with an emphasis on ultrastructure. part 2 - tumours and tumour-like lesions. J Submicrosc Cytol Pathol. 2005;37:231–96. - PubMed
    1. De Wever O, Demetter P, Mareel M, Bracke M. Stromal myofibroblasts are drivers of invasive cancer growth. Int J Cancer. 2008;123:2229–38. doi: 10.1002/ijc.23925. - DOI - PubMed

Publication types

Substances