. 2017 Jan 5;541(7635):112-116.
doi: 10.1038/nature20589. Epub 2016 Dec 19.

In situ structures of the genome and genome-delivery apparatus in a single-stranded RNA virus

Affiliations

In situ structures of the genome and genome-delivery apparatus in a single-stranded RNA virus

Xinghong Dai et al. Nature. .

Abstract

Packaging of the genome into a protein capsid and its subsequent delivery into a host cell are two fundamental processes in the life cycle of a virus. Unlike double-stranded DNA viruses, which pump their genome into a preformed capsid, single-stranded RNA (ssRNA) viruses, such as bacteriophage MS2, co-assemble their capsid with the genome; however, the structural basis of this co-assembly is poorly understood. MS2 infects Escherichia coli via the host 'sex pilus' (F-pilus); it was the first fully sequenced organism and is a model system for studies of translational gene regulation, RNA-protein interactions, and RNA virus assembly. Its positive-sense ssRNA genome of 3,569 bases is enclosed in a capsid with one maturation protein monomer and 89 coat protein dimers arranged in a T = 3 icosahedral lattice. The maturation protein is responsible for attaching the virus to an F-pilus and delivering the viral genome into the host during infection, but how the genome is organized and delivered is not known. Here we describe the MS2 structure at 3.6 Å resolution, determined by electron-counting cryo-electron microscopy (cryoEM) and asymmetric reconstruction. We traced approximately 80% of the backbone of the viral genome, built atomic models for 16 RNA stem-loops, and identified three conserved motifs of RNA-coat protein interactions among 15 of these stem-loops with diverse sequences. The stem-loop at the 3' end of the genome interacts extensively with the maturation protein, which, with just a six-helix bundle and a six-stranded β-sheet, forms a genome-delivery apparatus and joins 89 coat protein dimers to form a capsid. This atomic description of genome-capsid interactions in a spherical ssRNA virus provides insight into genome delivery via the host sex pilus and mechanisms underlying ssRNA-capsid co-assembly, and inspires speculation about the links between nucleoprotein complexes and the origins of viruses.


Conflict of interest statement

The authors declare no competing financial interests.

Figures

Extended Data Figure 1
Extended Data Figure 1. Resolution assessment of the cryoEM reconstruction
a,“Gold-standard” Fourier shell correlation (FSC) curve of the cryoEM reconstruction. The average resolution of the final density map is 3.6Å as determined by the FSC=0.143 criterion. b, Local resolution assessed by ResMap. Density voxels are colored according to their local resolution as defined in the color scale on the right side. Only half of the capsid is shown to expose the RNA densities inside. c, d, CryoEM densities of a coat protein dimer (c) or the maturation protein (d) with their bound RNA stem-loops to show quality of the density map. In both cases, the cryoEM densities are semitransparent to show the fitted atomic models of the protein and RNA.
Extended Data Figure 2
Extended Data Figure 2. 3D classification
The entire dataset of the cryoEM images were subjected to 3D classification and refinement starting from a single initial model of the asymmetric reconstruction. Ten classes were arbitrarily set. The resulted density maps were compared with the reconstruction of the whole dataset and with each other. Overall structures of the ten classes are almost identical, except for small regions as exemplified by region enclosed in the dashed circle in the superimposed map. The RNA fragments of these regions have multiple conformations, and are thus not traced in our model. Overall, we were able to trace the RNA density amounting to 80% of the genome.
Extended Data Figures 3-7
Extended Data Figures 3-7. Backbone model of the MS2 genome
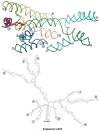
Together with Fig. 2c, d, these figures show the backbone model of MS2 genome segment by segment from 5’ to 3’. The backbone of each segment is rainbow-coloured (blue to red) from 5’ to 3’. Atomic models of high-resolution stem-loops (ribbons) contained in the segment are also shown. Some of the base-pairings in the predicted secondary structure are modified to make it more consistent with the observed structure. Matching stem-loops in the backbone and in the predicted secondary structure are marked with the same number. Dashed boxes in some of the predicted secondary structure panels denote flexible stem-loops that are not well resolved in the cryoEM density map and thus not traceable for backbone.
Extended Data Figure 8
Extended Data Figure 8. Secondary structure of the MS2 genome
Secondary structures of all genome segments in Fig. 2d and Extended Data Fig. 3-7 are assembled to show the secondary structure of the entire MS2 genome. The genome sequences are coloured according to the genes encoded as depicted in the schematic diagram in the bottom, except for the lysis gene which is overlapping with the coat protein gene and the replicase gene. The star signs denote positions of the 16 high-resolution stem-loops. Segments enclosed with dotted boxes or ellipses are flexible.
Extended Data Figure 9
Extended Data Figure 9. CryoEM densities (mesh) and atomic models (stick) of the 15 high-resolution stem-loops that interact with CP-dimers (ribbon)
Figure 1
Figure 1. CryoEM asymmetric reconstruction of MS2 at 3.6Å resolution
a, b, Front (a) and back (b) views of the cryoEM density map along an icosahedral 2-fold symmetry axis with some 2-, 3- and 5-fold axes indicated. The capsid shell is radially coloured with MP highlighted in magenta, and ssRNA genome inside the capsid in blue. c, Cut-open view with half of the capsid shell removed to expose the genome. d, Segmented cryoEM densities (mesh) superimposed with their corresponding atomic models (sticks). Top and bottom-left panels are typical β-strand and α-helix densities from MP, respectively. The bottom-right panel is part of an MP-bound RNA stem-loop. Purines and pyrimidines are readily distinguishable.
Figure 2
Figure 2. Modeling the ssRNA genome
a, Backbone structure of the genome (wire) and non-uniform distribution of the high-resolution stem-loops (ribbons). Backbone of the genome is rainbow-coloured (blue to red) from 5’ to 3’. b-d, An example of tracing RNA backbone. Part of the genome density (grey in b) is segmented out and superimposed with its backbone model (rainbow-coloured wire, blue to red from 5’ to 3’) (b and c). For each of the two high-resolution stem-loops (ribbons in c) contained in this segment, a degenerate sequence was derived based on the resolved bases and used to search against the genome to identify sequence candidates. Each of these short sequence candidates was expanded in both directions to include ~500 bases for secondary structure prediction. The predicted secondary structure was then correlated with the backbone obtained in b and only one of these sequence candidates yielded correct sequence registration of individual stem-loops (indicated by numbers 1-7 in c and d). The backbone model reveals kissing-loop and long-range base-pairing interactions as indicated.
Figure 3
Figure 3. Conserved interaction motifs between RNA stem-loops and CP-dimers
a, Secondary structures of the RNA stem-loops with nucleotides involved in the three types of conserved interaction motifs coloured. Letters beneath some of the stem-loops identify panels in which the atomic model for that stem-loop is shown. b-e, Atomic model of stem-loop 1747-1763 and its interactions with a CP-dimer (pink and sky blue ribbons). In c, positively-charged or polar residues of the CP-dimer interacting with phosphates of the RNA backbone (sticks) are indicated. Zoom-in views of the stem (d) and loop (e) regions show the interaction motifs conserved among the 15 stem-loops. f-j, Accommodation of diversities in sequence or local environment. Stem-loop 2781-2796 (f), viewed in the same orientation as in d, shows that a G forms the same kind of hydrogen bonds with Thr45 and Ser47 as an A in d. Stem-loops 977-990 (g) and 102-114 (h), viewed in the same orientation as in e, show that a purine (G983 in g) instead of a pyrimidine (U1756 in e) stacks with Tyr85 and that a pyrimidine (C109 in h) forms only one hydrogen bond instead of a purine (A1757 in e) forming two hydrogen bonds with Thr45 and Ser47. Stem-loop 179-200 (i, j) binds to a CP-dimer from a very different angle due to steric hindrance of a neighboring stem-loop (not shown). Nonetheless, the RNA fold and one of the three interaction motifs are conserved, although hydrogen bonding with Thr59 instead of Ser47 is formed.
Figure 4
Figure 4. MP and its interactions with the 3’-end stem-loop
a, Incorporation of MP in the capsid shell. MP (magenta) replaces a CP-dimer at a 2-fold symmetry axis and induces structural changes of neighboring CPs. Atomic models of the changed CPs (coloured ribbons) are superimposed with that of CPs at other 2-fold symmetry axes (beige ribbons) which are unaffected by the MP. b, MP model rainbow-coloured (blue to red from N- to C-terminus). c, Binding of the 3’-end stem-loop to MP and neighboring CPs as viewed inside the capsid. d, Base-pairing in the 3’-end stem-loop as observed in our structure interacting with MP (right), or theoretically as free stem-loop (left). e-h, Details of the interactions between the 3’-end stem-loop and the MP or CPs. Panel h is a zoom-in view of the RNA stem region, with half of the stem hidden for clarity.
Figure 5
Figure 5. Binding of MP to the genome and to bacterial F-pilus
a, Overview of MP (magenta) with surrounding RNA stem-loops (wires coloured as in Fig. 2a) shown in the same orientation as in Fig. 3c. b, Same as a but without the RNA backbone model, showing the distribution of positively-charged arginine and lysine residues in MP that bind RNA stem-loops. c, d, Fitting our atomic models (ribbons) of the MS2 virion into a tomographic reconstruction (EMD-2365, semitransparent surface) of MS2 attached to bacterial F-pilus. MP obliquely projects out from the capsid surface, resulting in a slight tilt (~9°) of the MS2 virion when attached to the F-pilus (d).

Similar articles

Cited by

References

    1. Jiang W, et al. Structure of epsilon15 bacteriophage reveals genome organization and DNA packaging/injection apparatus. Nature. 2006;439:612–616. - PMC - PubMed
    1. Lander GC, et al. The structure of an infectious P22 virion shows the signal for headful DNA packaging. Science. 2006;312:1791–1795. - PubMed
    1. Catalano CE. Viral Genome Packaging Machines: Genetics, Structure, and Mechanism. Springer; US: 2005.
    1. Basnak G, et al. Viral genomic single-stranded RNA directs the pathway toward a T=3 capsid. J Mol Biol. 2010;395:924–936. doi: 10.1016/j.jmb.2009.11.018. - DOI - PMC - PubMed
    1. Sun S, Rao VB, Rossmann MG. Genome packaging in viruses. Curr Opin Struct Biol. 2010;20:114–120. - PMC - PubMed

References in Methods

    1. Suloway C, et al. Automated molecular microscopy: the new Leginon system. Journal of structural biology. 2005;151:41–60. - PubMed
    1. Li X, et al. Electron counting and beam-induced motion correction enable near-atomic-resolution single-particle cryo-EM. Nature methods. 2013;10:584–590. - PMC - PubMed
    1. Mindell JA, Grigorieff N. Accurate determination of local defocus and specimen tilt in electron microscopy. Journal of structural biology. 2003;142:334–347. - PubMed
    1. Kivioja T, Ravantti J, Verkhovsky A, Ukkonen E, Bamford D. Local average intensity-based method for identifying spherical particles in electron micrographs. Journal of structural biology. 2000;131:126–134. - PubMed
    1. Ludtke SJ, Baldwin PR, Chiu W. EMAN: semiautomated software for high-resolution single-particle reconstructions. Journal of structural biology. 1999;128:82–97. - PubMed

Publication types

MeSH terms