. 2016 Dec 20;49(12):2725-2735.
doi: 10.1021/acs.accounts.6b00384. Epub 2016 Dec 8.

Nanoarchitecture Based SERS for Biomolecular Fingerprinting and Label-Free Disease Markers Diagnosis

Affiliations

Nanoarchitecture Based SERS for Biomolecular Fingerprinting and Label-Free Disease Markers Diagnosis

Sudarson Sekhar Sinha et al. Acc Chem Res. .

Abstract

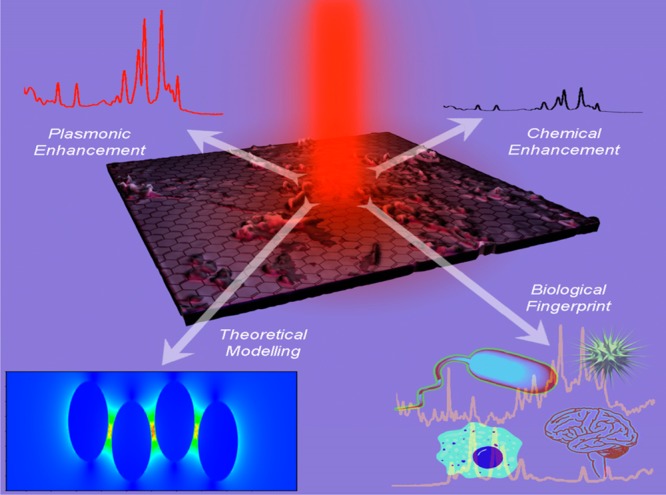
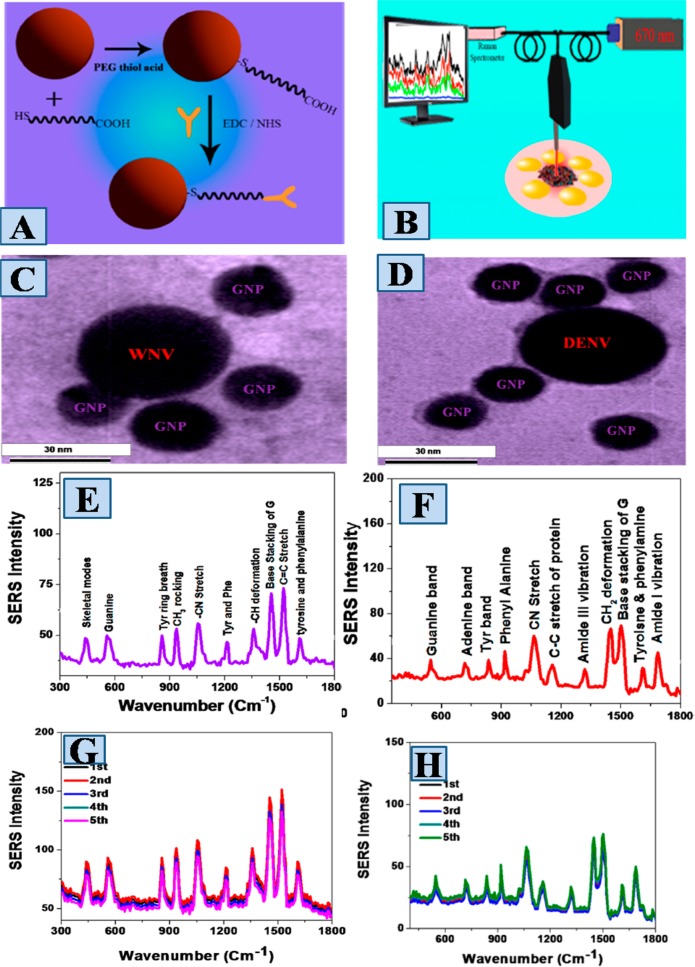
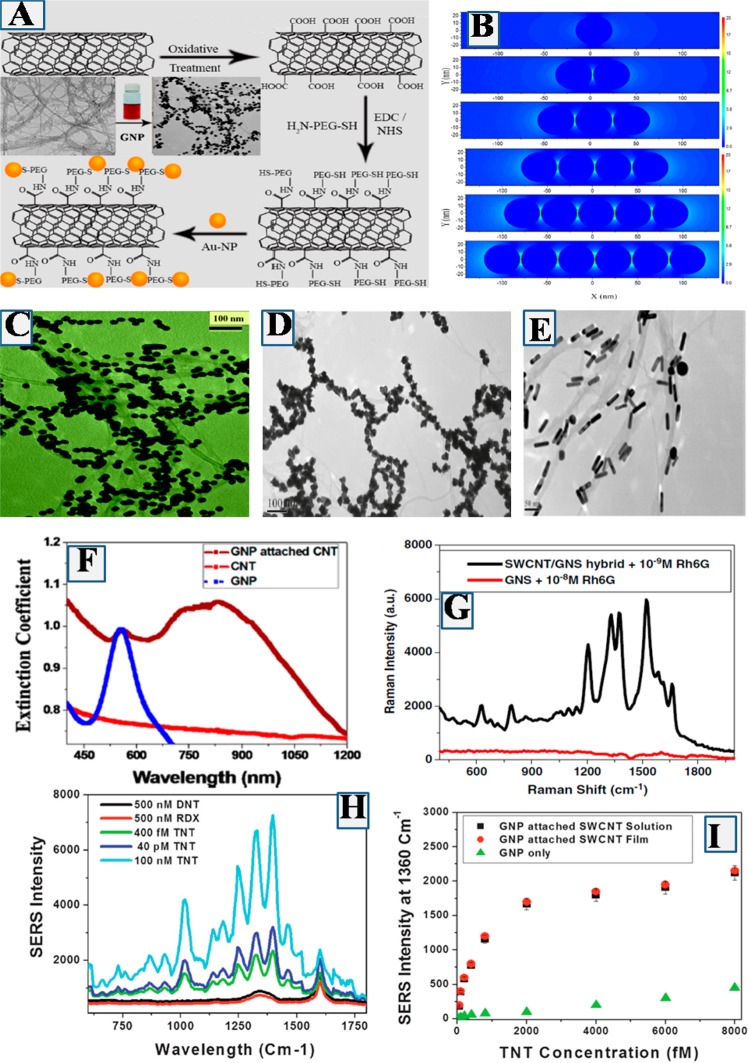
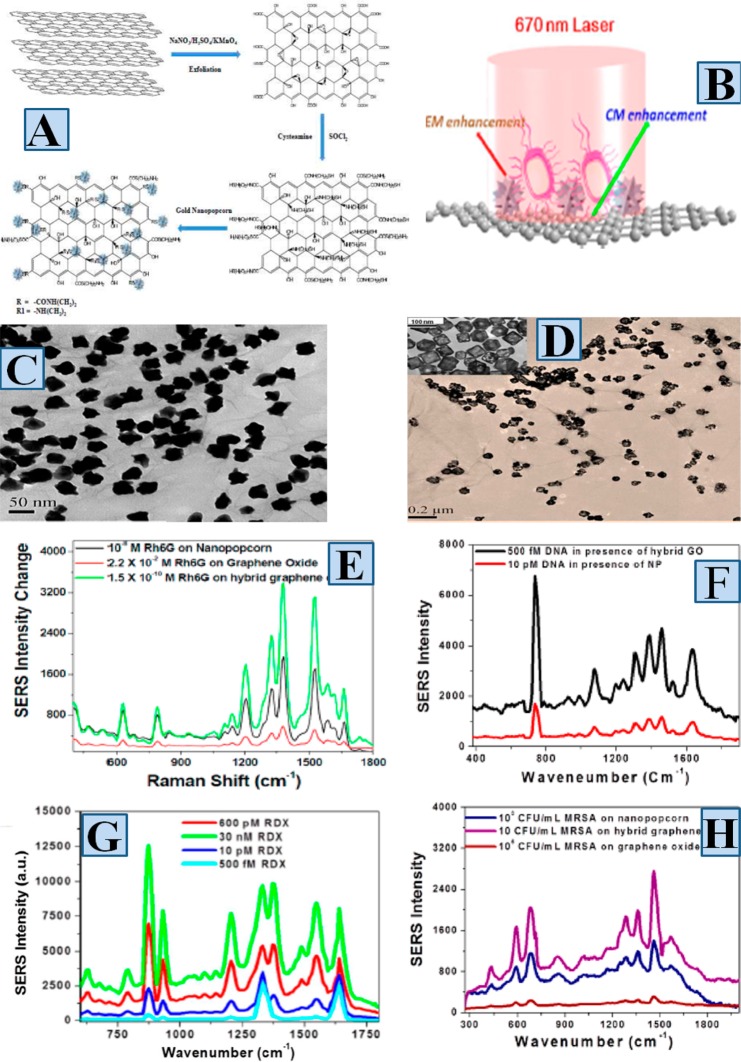
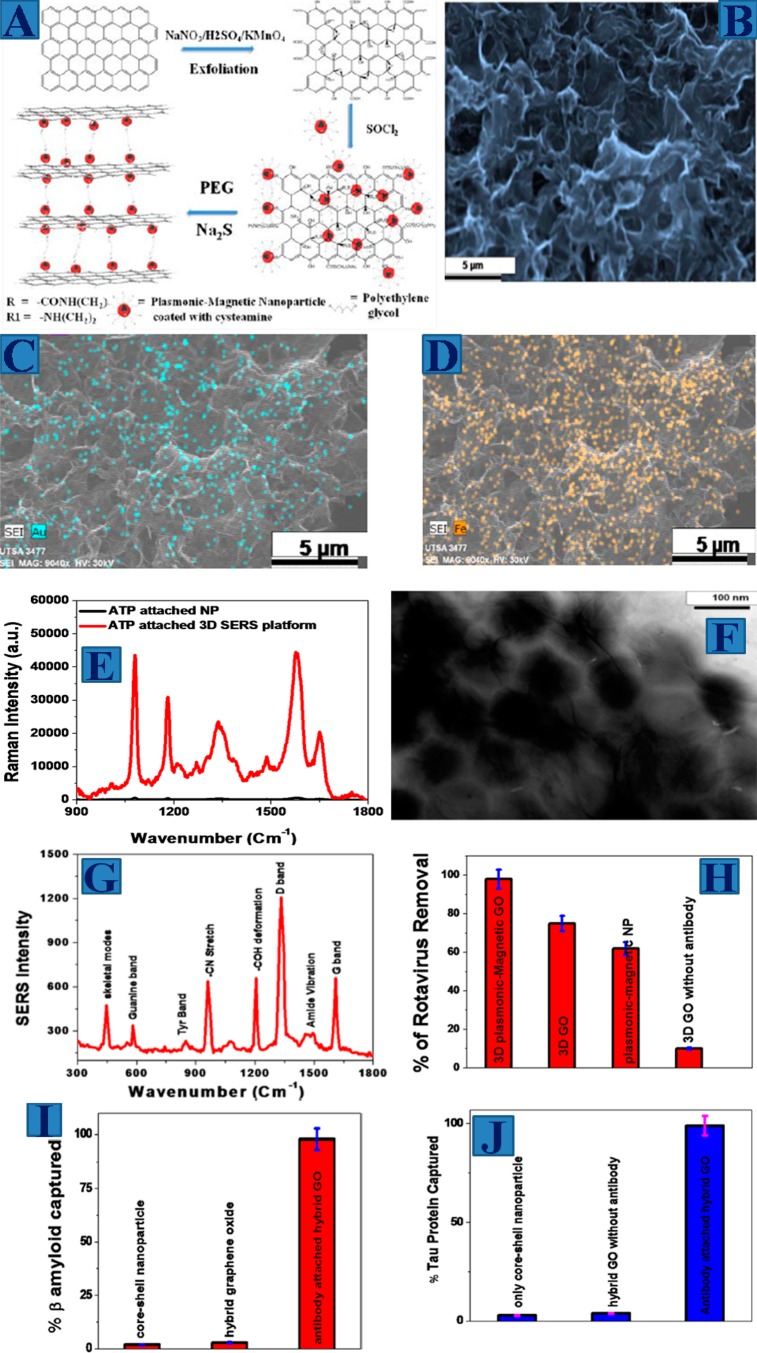
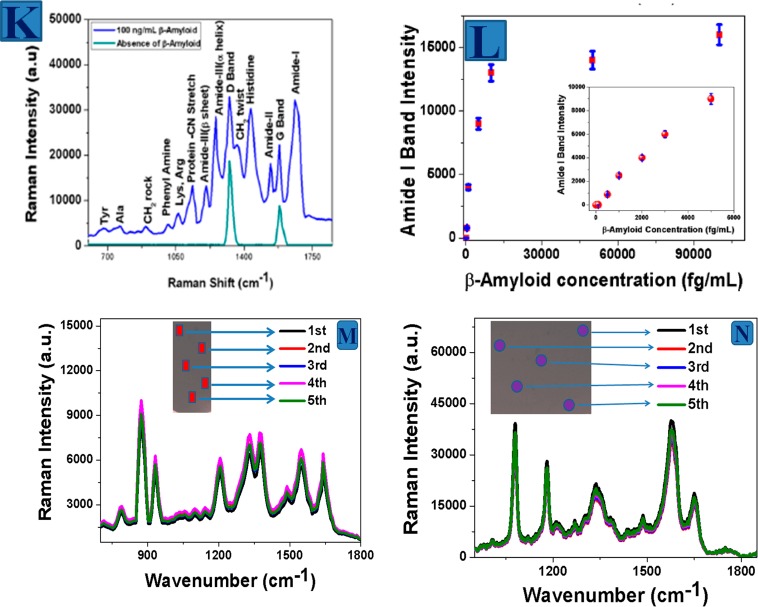
Surface-enhanced Raman spectroscopy (SERS) fingerprinting is highly promising for identifying disease markers from complex mixtures of clinical sample, which has the capability to take medical diagnoses to the next level. Although vibrational frequency in Raman spectra is unique for each biomolecule, which can be used as fingerprint identification, it has not been considered to be used routinely for biosensing due to the fact that the Raman signal is very weak. Contemporary SERS has been demonstrated to be an excellent analytical tool for practical label-free sensing applications due its ability to enhance Raman signals by factors of up to 108-1014 orders of magnitude. Although SERS was discovered more than 40 years ago, its applications are still rare outside the spectroscopy community and it is mainly due to the fact that how to control, manipulate and amplify light on the "hot spots" near the metal surface is in the infancy stage. In this Account, we describe our contribution to develop nanoachitecture based highly reproducible and ultrasensitive detection capability SERS platform via low-cost synthetic routes. Using one-dimensional (1D) carbon nanotube (CNT), two-dimensional (2D) graphene oxide (GO), and zero-dimensional (0D) plasmonic nanoparticle, 0D to 3D SERS substrates have been designed, which represent highly powerful platform for biological diagnosis. We discuss the major design criteria we have used to develop robust SERS substrate to possess high density "hot spots" with very good reproducibility. SERS enhancement factor for 3D SERS substrate is about 5 orders of magnitude higher than only plasmonic nanoparticle and more than 9 orders of magnitude higher than 2D GO. Theoretical finite-difference time-domain (FDTD) stimulation data show that the electric field enhancement |E|2 can be more than 2 orders of magnitude in "hot spots", which suggests that SERS enhancement factors can be greater than 104 due to the formation of high density "hot spots" in 3D substrate. Next, we discuss the utilization of nanoachitecture based SERS substrate for ultrasensitive and selective diagnosis of infectious disease organisms such as drug resistance bacteria and mosquito-borne flavi-viruses that cause significant health problems worldwide. SERS based "whole-organism fingerprints" has been used to identify infectious disease organisms even when they are so closely related that they are difficult to distinguish. The detection capability can be as low as 10 CFU/mL for methicillin-resistant Staphylococcus aureus (MRSA) and 10 PFU/mL for Dengue virus (DENV) and West Nile virus (WNV). After that, we introduce exciting research findings by our group on the applications of nanoachitecture based SERS substrate for the capture and fingerprint detection of rotavirus from water and Alzheimer's disease biomarkers from whole blood sample. The SERS detection limit for β-amyloid (Aβ proteins) and tau protein using 3D SERS platform is several orders of magnitude higher than the currently used technology in clinics. Finally, we highlight the promises, major challenges and prospect of nanoachitecture based SERS in biomedical diagnosis field.


Conflict of interest statement

The authors declare no competing financial interest.

Figures

Figure 1
Figure 1
Schematic representation shows the SERS substrate with high plasmonic and chemical enhancement capability can be used for biological fingerprint.
Figure 2
Figure 2
(A) Synthetic path for the development of antiflaviviral antibody attached plasmonic nanoparticle based SERS. (B) Portable Raman probe we have designed for SERS measurement. (C) TEM image of WNV attached plasmonic nanoparticle assembly. (D) TEM image of DENV attached plasmonic nanoparticle assembly. (E) Raman spectra from DENV conjugated nanoarchitecture. (F) Raman spectra from WNV conjugated nanoarchitecture. (G) Reproducibility of Raman spectra from DENV conjugated nanoarchitecture produce in different batches. (H) Reproducibility of Raman spectra from WNV conjugated nanoarchitecture produce in different batches. Reproduced with permission from ref (32). Copyright 2015 American Chemical Society.
Figure 3
Figure 3
(A) Synthetic path for the development of plasmonic nanoparticle attached hybrid CNT. (B) FDTD simulated data show the electric field enhancement profiles for 40 nm gold nanoparticle assembly structure. (C) TEM image shows plasmonic spherical gold nanoparticles are attached on SWCNT and formed large number of “hot spots” on CNT (Reproduced with permission from ref (37). Copyright 2015 American Chemical Society). (D) TEM image shows plasmonic popcorn shape gold nanoparticles are attached on SWCNT via the formation of “hot spots” (reproduced with permission from ref (39). Copyright 2011 American Chemical Society). (E) TEM image showing plasmonic rod shaped gold nanoparticles are attached on SWCNT via the formation of “hot spot” (Reproduced with permission from ref (42). Copyright 2011 Elsevier). (F) Extinction spectra for GNP, GNP attached SWCNT, and only SWCNT (Reproduced with permission from ref (37). Copyright 2015 American Chemical Society). (G) Raman intensity from Rh6G on nanoparticle and nanoparticle attached SWCNT. (H) Raman intensity from TNT on popcorn shape nanoparticle and nanoparticle attached SWCNT. (I) TNT Raman intensity enhancement on nanoparticle and nanoparticle attached SWCNT (Reproduced with permission from ref (41). Copyright 2012 Royal Society of Chemistry).
Figure 4
Figure 4
(A) Synthetic path for the development of plasmonic nanoparticle attached hybrid 2D GO. (B) Scheme shows 2D hybrid SERS substrate using plasmonic nanoparticle attached GO has capability to tune electromagnetic and chemical enhancement simultaneously. (C) TEM image shows that plasmonic popcorn shape gold nanoparticles are attached on 2D GO and formed large number of “hot spots” on GO (Reproduced with permission from ref (38). Copyright 2013 American Chemical Society). (D) TEM image shows plasmonic gold-nanocages are attached on 2D GO via the formation of “hot spots” (Reproduced with permission from ref (36). Copyright 2014 American Chemical Society). (E) Raman intensity from Rh6G on nanoparticle and nanoparticle attached 2D GO (reproduced with permission from ref (38)., Copyright 2013, American Chemical Society). (F) Raman intensity from partial sequence of the HIV-1 gag gene on nanoparticle and nanoparticle attached 2D GO. (G) Raman intensity from different concentration of RDX on plasmonic gold nanoparticle attached 2D GO (Reproduced with permission from ref (36). Copyright 2014 American Chemical Society). (H) MRSA Raman intensity enhancement on GO, nanoparticle, and nanoparticle attached 2D GO (Reproduced with permission from ref (38). Copyright 2013 American Chemical Society).
Figure 5
Figure 5
(A) Synthetic path for the development of magnetic core-plsmonic shell nanoparticle attached hybrid 3D GO based 3D SERS substrate. (B) SEM image of hybrid 3D graphene oxide based SERS substarte. (C) EDX mapping shows the presence of Au in hybrid 3D GO. (D) EDX mapping shows the presence of Fe in hybrid 3D GO (Reproduced with permission from ref (35). Copyright 2014 American Chemical Society). (E) Raman intensity from p-aminothiophenol on nanoparticle attached 3D GO based SERS substrate (Reproduced with permission from ref (30). Copyright 2016 Royal Society of Chemistry). (F) TEM image shows rotaviruses are captured by 3D SERS substrate. (G) Raman spectra from rotavirus captured by 3D SERS substrate. (H) Rotavirus captured efficiency using SERS substrate (Reproduced with permission from ref (35). Copyright 2014 American Chemical Society). (I) β-amyloid capture efficiency using SERS substrate (Reproduced with permission from ref (35). Copyright 2014 American Chemical Society). (J) Tau protein captured efficiency using SERS substrate. (K) Raman spectra from β amyloid captured by the plasmonic-magnetic hybrid GO substrate. (L) SERS detection efficiency for β amyloid (Reproduced with permission from ref (33). Copyright 2015 American Chemical Society). (M) Distribution of the SERS intensities from p-aminothiophenol over randomly chosen portions on 3D substrate. (N) Distribution of the SERS intensities from RDX over randomly chosen portions on 3D substrate.
Figure 5
Figure 5
(A) Synthetic path for the development of magnetic core-plsmonic shell nanoparticle attached hybrid 3D GO based 3D SERS substrate. (B) SEM image of hybrid 3D graphene oxide based SERS substarte. (C) EDX mapping shows the presence of Au in hybrid 3D GO. (D) EDX mapping shows the presence of Fe in hybrid 3D GO (Reproduced with permission from ref (35). Copyright 2014 American Chemical Society). (E) Raman intensity from p-aminothiophenol on nanoparticle attached 3D GO based SERS substrate (Reproduced with permission from ref (30). Copyright 2016 Royal Society of Chemistry). (F) TEM image shows rotaviruses are captured by 3D SERS substrate. (G) Raman spectra from rotavirus captured by 3D SERS substrate. (H) Rotavirus captured efficiency using SERS substrate (Reproduced with permission from ref (35). Copyright 2014 American Chemical Society). (I) β-amyloid capture efficiency using SERS substrate (Reproduced with permission from ref (35). Copyright 2014 American Chemical Society). (J) Tau protein captured efficiency using SERS substrate. (K) Raman spectra from β amyloid captured by the plasmonic-magnetic hybrid GO substrate. (L) SERS detection efficiency for β amyloid (Reproduced with permission from ref (33). Copyright 2015 American Chemical Society). (M) Distribution of the SERS intensities from p-aminothiophenol over randomly chosen portions on 3D substrate. (N) Distribution of the SERS intensities from RDX over randomly chosen portions on 3D substrate.

Similar articles

Cited by

References

    1. World Health Organization. Worldwide Country Situation Analysis: Response to Antimicrobial Resistance. 2015.
    1. Tackling Drug-Resistant Infections Globally: Final Report and Recommendations (http://amr-review.org/) (accessed March. 17, 2016).
    1. Courtney C. M.; Goodman S. M.; McDaniel J. A.; Madinger N. E.; Chatterjee A.; Nagpal P. Photoexcited quantum dots for killing multidrug-resistant bacteria. Nat. Mater. 2016, 15, 529–534. 10.1038/nmat4542. - DOI - PubMed
    1. Blair J. M. A.; Webber M. A.; Baylay A. J.; Ogbolu D. O.; Piddock L. J. V. Molecular mechanisms of antibiotic resistance. Nat. Rev. Microbiol. 2015, 13, 42–51. 10.1038/nrmicro3380. - DOI - PubMed
    1. Hazarika P.; Russell D. A. Advances in Fingerprint Analysis. Angew. Chem., Int. Ed. 2012, 51, 3524–3531. 10.1002/anie.201104313. - DOI - PubMed

Publication types

MeSH terms

LinkOut - more resources