. 2017 Jun 15;23(12):3084-3096.
doi: 10.1158/1078-0432.CCR-16-2022. Epub 2016 Dec 19.

Mechanisms of Acquired Drug Resistance to the HDAC6 Selective Inhibitor Ricolinostat Reveals Rational Drug-Drug Combination with Ibrutinib

Affiliations

Mechanisms of Acquired Drug Resistance to the HDAC6 Selective Inhibitor Ricolinostat Reveals Rational Drug-Drug Combination with Ibrutinib

Jennifer E Amengual et al. Clin Cancer Res. .

Abstract

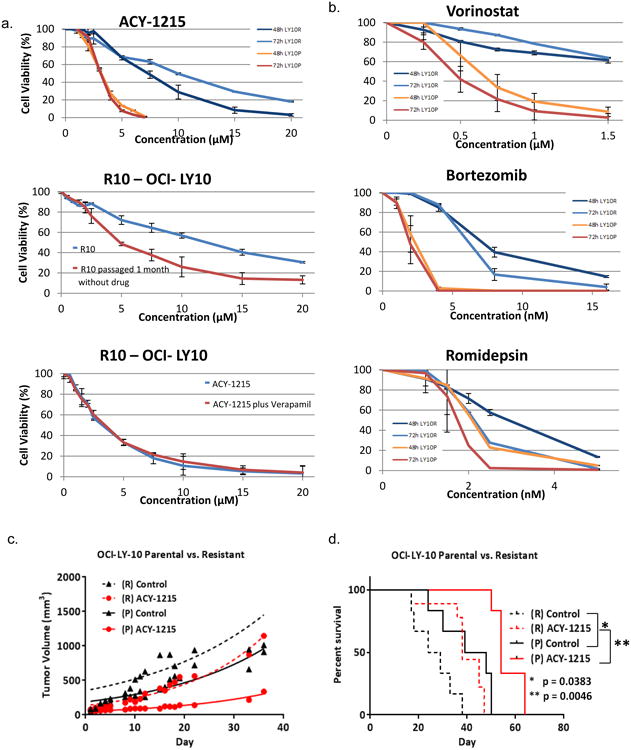
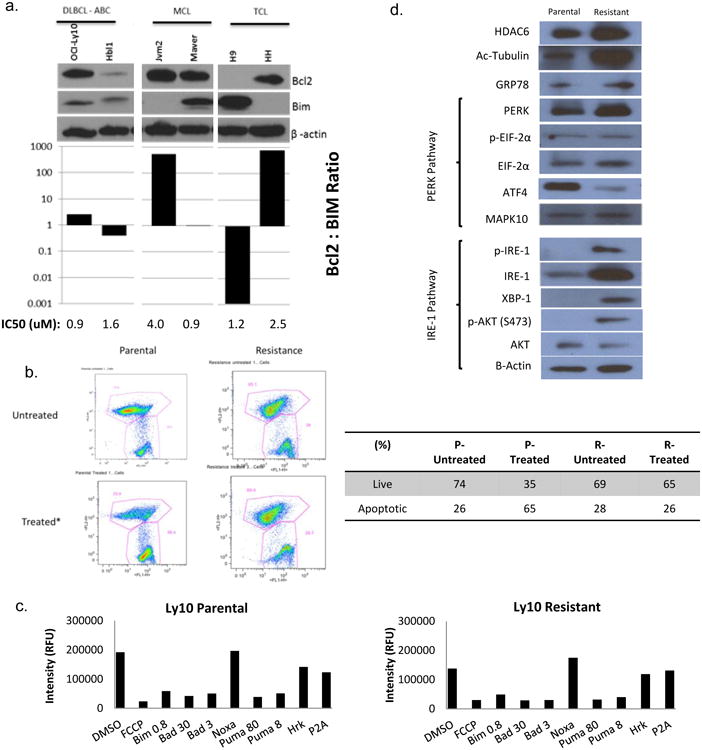
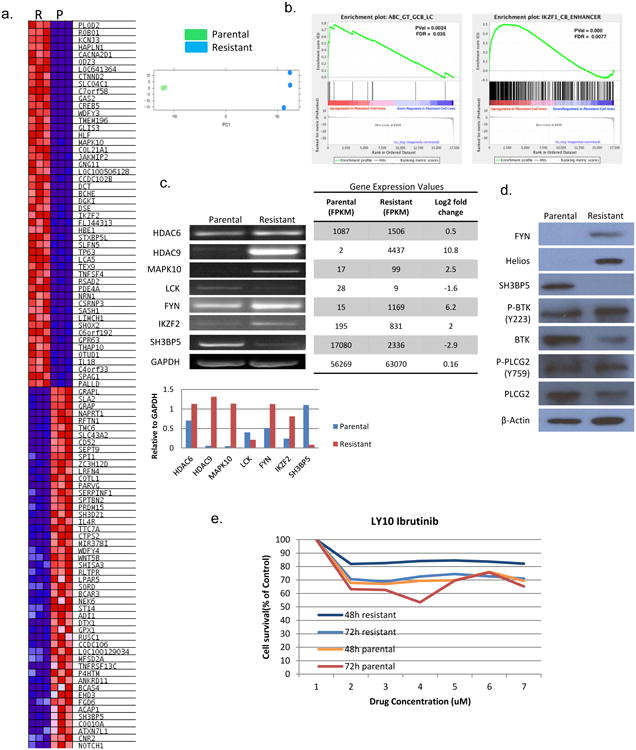
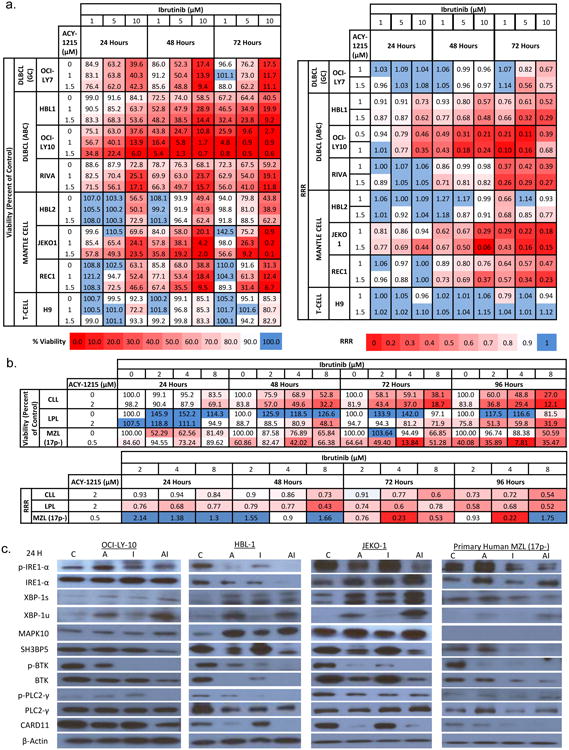
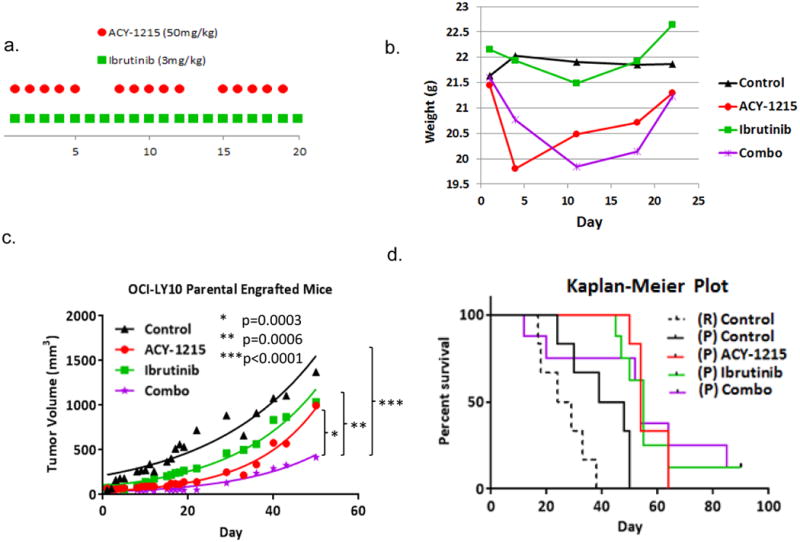
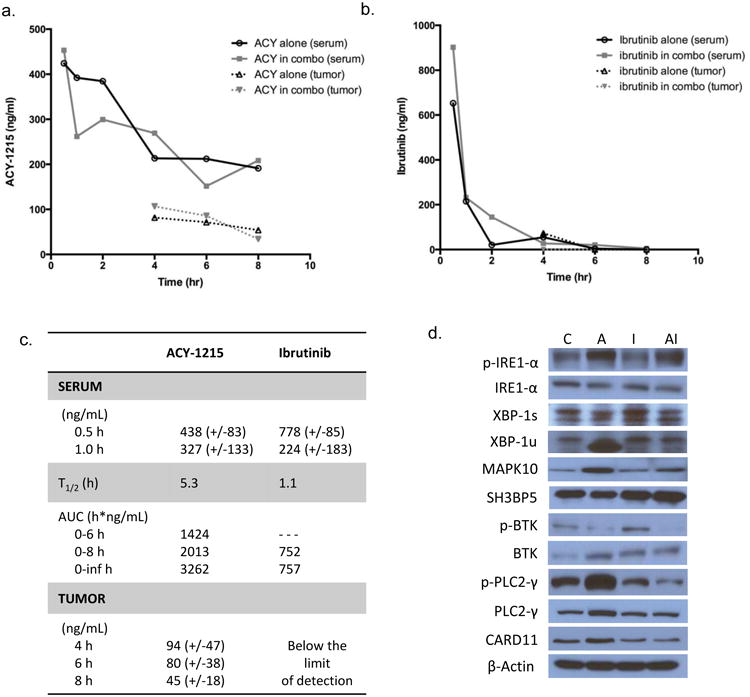
Purpose: Pan-class I/II histone deacetylase (HDAC) inhibitors are effective treatments for select lymphomas. Isoform-selective HDAC inhibitors are emerging as potentially more targeted agents. ACY-1215 (ricolinostat) is a first-in-class selective HDAC6 inhibitor. To better understand the discrete function of HDAC6 and its role in lymphoma, we developed a lymphoma cell line resistant to ACY-1215.Experimental Design: The diffuse large B-cell lymphoma cell line OCI-Ly10 was exposed to increasing concentrations of ACY-1215 over an extended period of time, leading to the development of a resistant cell line. Gene expression profiling (GEP) was performed to investigate differentially expressed genes. Combination studies of ACY-1215 and ibrutinib were performed in cell lines, primary human lymphoma tissue, and a xenograft mouse model.Results: Systematic incremental increases in drug exposure led to the development of distinct resistant cell lines with IC50 values 10- to 20-fold greater than that for parental lines. GEP revealed upregulation of MAPK10, HELIOS, HDAC9, and FYN, as well as downregulation of SH3BP5 and LCK. Gene-set enrichment analysis (GSEA) revealed modulation of the BTK pathway. Ibrutinib was found to be synergistic with ACY-1215 in cell lines as well as in 3 primary patient samples of lymphoma. In vivo confirmation of antitumor synergy was demonstrated with a xenograft of DLBCL.Conclusions: The development of this ACY-1215-resistant cell line has provided valuable insights into the mechanistic role of HDAC6 in lymphoma and offered a novel method to identify rational synergistic drug combinations. Translation of these findings to the clinic is underway. Clin Cancer Res; 23(12); 3084-96. ©2016 AACR.


Conflict of interest statement

Disclosure Conflicts of Interest: J.E.A. received investigational drug and research funding from Acetylon Pharmaceuticals, Inc.

J.E.A. and O.A.O. have provided consultancy for Acetylon Pharmaceuticals, Inc

Figures

Figure 1
Figure 1. Development and Characterization of Selective HDAC6 Inhibitor Resistant Cell Line
The DLBCL cell line, OCI-LY10 was exposed to increasing concentrations of ACY-1215 over time. (A) Concentration : effect relationships were established for resistant and parental Ly10 at 48 and 72 hours following exposure to ACY-1215. 48 hour concentration : effect relationship of increasing concentrations of ACY-1215 in the resistant line after immediate exposure and after a wash-out period of 1 month. Concentration : effect relationship was determined with ACY-1215 alone or in combination with verapamil 20 uM to inhibit efflux pumps. (B) Concentration : effect relationships were established for resistant and parental Ly10 at 48 and 72 hours following exposure to, vorinostat, bortezomib, and romidepsin. (C) SCID-beige mice were injected with LY10 107 in their flanks and treated with ACY-1215 50 mg/kg days 1-5, 8-12, 15-19 via the intraperitoneal route. (D) Kaplan-Meier Curve was calculated for the resistant control mice as compared to the resistant ACY-1215 mice, parental control and treatment cohorts
Figure 2
Figure 2. The IRE-1/XBP-1 pathway is upregulated in cells resistant to ACY-1215
, (A) Western blot analysis of a panel of lymphoma cell lines for Bcl2 and Bim was compared to the IC50 in these cell lines. (B) Mitochondrial membrane potential was measured following 48 hour exposure of cells to ACY-1215 2.5 uM via flow cytometry. (C) BH3 profiling was performed on the parental and resistant cell lines. (D) Baseline characteristics of the resistant line was compared to the parental line with respect to the unfolded protein response (UPR).
Figure 3
Figure 3. Resistant cell line has differentially expressed gene profile as compared to parental line and identifies that the BCR pathway is upregulated in resistant cells
(A) Resistant (R) cells and parental cells (P) were evaluated by RNA Seq for gene expression. The two cells lines were distinct as demonstrated by principle component analysis. The heat map represents the top 100 genes with significant overall 2-log fold change between the resistant and parental lines. (B) Gene set enrichment analysis (GSEA) was performed to compare enrichment of pathways in resistant verses parental lines. (C) Differentially expressed genes of interest were confirmed via PCR for the resistant line as compared to the parental line. (D) Protein expression of genes of interest was confirmed with immunoblot analysis. (E) Concentration : effect relationships of ibrutinib in resistant and parental lines was evaluated at 48 and 72 hours.
Figure 4
Figure 4. Ibrutinib plus ACY-1215 is synergistic in cell lines and primary human lymphoma samples
(A). Heat map represents the viability of a panel of cell lines following treatment with ACY-1215, ibrutinib or the combination at 24, 48, and 72 hours. Red boxes indicate lower viability. Synergy was calculated by the relative risk ration (RRR). RRR < 1 connotes synergy and is represented by red boxes. (B) Primary human lymphoma samples, chronic lymphocytic leukemia (CLL), lymphoplasmacytic lymphoma (LPL), and 17p deleted marginal zone lymphoma (MZL), were treated with ACY-1215, ibrutinib or the combination over 24 to 96 hours. Viability was measured and synergy was calculated by RRR and represented in the heat maps. (C) The IRE-1 and BTK pathways were evaluated following treatment with the combination of ibrutinib and ACY-1215 by immunoblot analysis.
Figure 5
Figure 5. The combination of ACY-1215 and ibrutinib leads to statistically significant tumor growth delay compared to single agent treatment in a xenograft mouse model of lymphoma
(A) SCID-beige mice were injected with LY10 107 in their flanks and treated with ACY-1215 50 mg/kg days 1-5, 8-12, 15-19, ibrutinib 3 mg/kg days 1-20, or the combination via the intraperitoneal route. (B) Mice were weighed every 3-4 days as a measurement for toxicity. (C) Tumor volume was measure over time as a function of treatment group (D) Kaplan-Meier Curve was calculated for the resistant control mice as compared to the parental control and treatment cohorts.
Figure 6
Figure 6. Pharmacokinetic and pharmacodynamics effects of ACY-1215 in combination with ibrutinib in mice
Serum and tumor tissue was collected from mice at sequential time points and analyzed for concentration of ACY-1215 and ibrutinib by LC-MS/MS. Mice were treated with ACY-1215 at 50 mg/kg alone and ACY-1215 50 mg/kg with ibrutinib 3 mg/kg. Drug concentrations are represented as mean values. (A) Graphical representation of ACY-1215 concentration over time. Mice received one dose of ACY-1215 50 mg/kg or ACY-1215 50 mg/kg plus ibrutinib 3 mg/kg for analysis of serum concentration of ACY-1215. For analysis of drug concentration in tumor tissue, ACY-1215 was administered at 50 mg/kg with or without ibrutinib. (B) Graphical representation of ibrutinib concentration over time analyzed in serum and tumor tissue. Mice received one dose of ibrutinib 3 mg/kg via i.p. route. (C) Summary of pharmacokinetic data for ACY-1215 and ibrutinib. (D) Immunoblot analysis of the IRE1 pathway of the UPR and the BTK pathway from whole cell lysates of mouse tumor tissue treated with ACY-1215, ibrutinib or the combination. Mice were treated with a single i.p. injection and analyzed at 6 hours.

References

    1. Duvic M, et al. Phase 2 trial of oral vorinostat (suberoylanilide hydroxamic acid, SAHA) for refractory cutaneous T-cell lymphoma (CTCL) Blood. 2007;109(1):31–9. - PMC - PubMed
    1. Piekarz RL, et al. Phase 2 trial of romidepsin in patients with peripheral T-cell lymphoma. Blood. 2011;117(22):5827–34. - PMC - PubMed
    1. O'Connor OA, et al. Belinostat in Patients With Relapsed or Refractory Peripheral T-Cell Lymphoma: Results of the Pivotal Phase II BELIEF (CLN-19) Study. J Clin Oncol. 2015;33(23):2492–9. - PMC - PubMed
    1. Ning ZQ, et al. Chidamide (CS055/HBI-8000): a new histone deacetylase inhibitor of the benzamide class with antitumor activity and the ability to enhance immune cell-mediated tumor cell cytotoxicity. Cancer Chemotherapy and Pharmacology. 2012;69(4):901–909. - PubMed
    1. San-Miguel JF, et al. Panobinostat plus bortezomib and dexamethasone versus placebo plus bortezomib and dexamethasone in patients with relapsed or relapsed and refractory multiple myeloma: a multicentre, randomised, double-blind phase 3 trial. The Lancet Oncology. 2014;15(11):1195–1206. - PubMed

MeSH terms